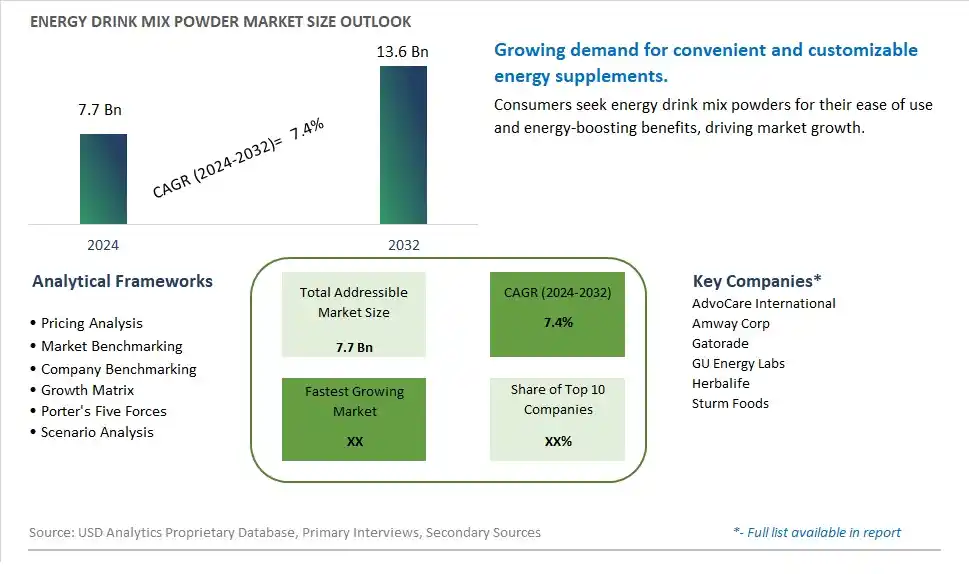
Global Energy Drink Mix Powder Market Size is valued at $7.7 Billion in 2024 and is forecast to register a growth rate (CAGR) of 7.4% to reach $13.6 Billion by 2032.
The global Energy Drink Mix Powder Market Comprehensive Study analyzes and forecasts the market size across 6 regions and 24 countries for diverse segments -By Type (Plastic Bottles, Glass, Others), By Application (Teenagers, Adults, Geriatric)
An Introduction to Energy Drink Mix Powder Market
The Energy Drink Mix Powder market in 2024 is experiencing robust growth, driven by the rising demand for convenient and portable energy-boosting solutions. Energy drink mix powders, known for their ease of use and quick preparation, are popular among athletes, fitness enthusiasts, and busy professionals. The market benefits from the growing trend of health and wellness, advancements in formulation technologies, and the expansion of the sports nutrition sector. Additionally, the increasing popularity of clean label and natural ingredients in energy drink mixes is contributing to market growth.
Energy Drink Mix Powder Competitive Landscape
The market report analyses the leading companies in the industry including AdvoCare International, Amway Corp, Gatorade, GU Energy Labs, Herbalife, Sturm Foods, and Others.
Energy Drink Mix Powder Market Dynamics
Energy Drink Mix Powder Market Trend: Shift Towards Natural and Functional Ingredients in Energy Drink Mix Powders
The market for energy drink mix powders is experiencing a prominent trend towards the shift to natural and functional ingredients. Consumers are increasingly seeking energy beverages that offer not only a boost in energy but also additional health benefits from ingredients such as vitamins, minerals, antioxidants, and botanical extracts. This trend is driven by health-conscious lifestyles, the desire for clean label products, and the perception that natural ingredients provide superior nutritional value and wellness support.
Energy Drink Mix Powder Market Driver: Growing Demand for On-the-Go Energy Solutions
A major driver for the energy drink mix powder market is the growing demand for on-the-go energy solutions. Busy lifestyles, increased work demands, and the desire for convenience drive consumers to seek energy-boosting products that are portable, easy to prepare, and can be consumed anytime, anywhere. Energy drink mix powders offer a convenient and customizable option for consumers to control their energy intake, tailor the flavor intensity, and adjust the energy levels according to their needs and preferences.
Energy Drink Mix Powder Market Opportunity: Development of Functional and Customizable Energy Formulations
The energy drink mix powder market presents a significant opportunity for the development of functional and customizable energy formulations. Companies specializing in energy ingredients and powder blending technologies can collaborate to create energy drink mix powders with added functionalities such as mental focus enhancement, hydration support, electrolyte replenishment, or immune system boosters. This opportunity includes exploring innovative ingredient combinations, flavor profiles, and packaging formats that cater to diverse consumer preferences, including those seeking natural, low-calorie, sugar-free, or performance-enhancing energy drinks. Customizable energy formulations can target specific consumer segments, such as athletes, fitness enthusiasts, students, or professionals, offering tailored solutions for various energy needs and occasions.
Energy Drink Mix Powder Market Share Analysis: Plastic Bottles segment generated the highest revenue share in the industry
The largest segment in the Energy Drink Mix Powder Market is Plastic Bottles. Plastic bottles are widely used in packaging energy drink mix powders due to their convenience, lightweight, durability, and cost-effectiveness. They offer a convenient way for consumers to store and consume energy drink mix powders, whether at home, in the gym, or on-the-go. Plastic bottles also provide manufacturers with flexibility in terms of design, size, and labeling options, allowing them to cater to various consumer preferences and market demands. Further, plastic bottles are less prone to breakage compared to glass, making them suitable for transportation and retail display. The popularity of plastic bottles in the Energy Drink Mix Powder Market is driven by their practicality, affordability, and widespread acceptance among consumers, contributing significantly to the segment's dominance in the market.
Energy Drink Mix Powder Market Share Analysis: Adults is the fastest growing segment over the forecast period to 2032
The fastest-growing segment in the Energy Drink Mix Powder Market is Adults. This demographic group, comprising individuals aged between 18 to 64 years, shows a significant inclination towards energy drink mix powders due to their busy and active lifestyles. Adults often seek quick and convenient energy-boosting solutions to meet the demands of their daily routines, including work, exercise, and social activities. Energy drink mix powders offer a portable and easy-to-prepare option for adults to replenish energy levels and enhance alertness, especially during periods of fatigue or increased physical exertion. The market's growth in this segment is driven by factors such as rising health consciousness, increased disposable income among adults, and the convenience offered by energy drink mix powders in meeting their energy needs on-the-go.
Energy Drink Mix Powder Market Segmentation
By Type
Plastic Bottles
Glass
Others
By Application
Teenagers
Adults
Geriatric
Countries Analyzed
North America (US, Canada, Mexico)
Europe (Germany, UK, France, Spain, Italy, Russia, Rest of Europe)
Asia Pacific (China, India, Japan, South Korea, Australia, South East Asia, Rest of Asia)
South America (Brazil, Argentina, Rest of South America)
Middle East and Africa (Saudi Arabia, UAE, Rest of Middle East, South Africa, Egypt, Rest of Africa)
Energy Drink Mix Powder Companies Profiled in the Study
AdvoCare International
Amway Corp
Gatorade
GU Energy Labs
Herbalife
Sturm Foods
*- List Not Exhaustive
Chapter 1. TABLE OF CONTENTS
Chapter 2. Introduction to Energy Drink Mix Powder Market
2.1. Market Overview
2.2. Key Statistics and Report Highlights
2.3. Scope of the Comprehensive Study
2.3.1. Market Definition
2.3.2 Countries and Regions Covered
2.3.3 Research Objective
2.3.4 Units, Currency, and Conversions
2.3.5 Industry Value Chain
2.4. Key Market Segments
2.5. Key Companies
2.6. Study Period
Chapter 3. Strategic Analysis Review
3.1. Energy Drink Mix Powder Pricing Analysis and Forecast
3.2. Porter’s Five Forces
3.3. Market Ecosystem
3.4. SWOT Analysis
3.5. Regulatory Scenario
3.3. Effects of Inflation, Russia-Ukraine War, moderating economic growth, and other macroeconomic factors
Chapter 4. Competitive Landscape
4.1. Market Share Analysis
4.1.1. Global Energy Drink Mix Powder Market Share by Company, 2023
4.1.2. Product Offerings of Leading Energy Drink Mix Powder Companies
4.2. Market Entropy
4.2.1. New Product Launches in the Industry
4.2.2. Mergers, Acquisitions, Joint ventures, and Partnerships
4.3. Key Strategies and Best Practices
Chapter 5. Global Market Projections: Best, Reference, and Low Case Scenarios
5.1. Growth Analysis- Case Scenario Definitions
5.2. Low Growth Case Scenario Forecasts
5.3. Reference Growth Case Scenario Forecasts
5.4. High Growth Case Scenario Forecasts
Chapter 6. Market Dynamics
6.1. Energy Drink Mix Powder Market Drivers
6.2. Energy Drink Mix Powder Market Challenges
6.6. Energy Drink Mix Powder Market Opportunities
6.4. Energy Drink Mix Powder Market Trends
Chapter 7. Global Energy Drink Mix Powder Market Outlook Trends
7.1. Global Energy Drink Mix Powder Revenue (USD Million) and CAGR (%) by Type (2021-2032)
7.2. Global Energy Drink Mix Powder Revenue (USD Million) and CAGR (%) by Application (2021-2032)
7.3. Global Energy Drink Mix Powder Revenue (USD Million) and CAGR (%) by Product (2021-2032)
By Type
Plastic Bottles
Glass
Others
By Application
Teenagers
Adults
Geriatric
Chapter 8. Global Energy Drink Mix Powder Regional Analysis and Outlook
8.1. Global Energy Drink Mix Powder Revenue (USD Million) By Regions (2021- 2032)
8.2. North America Energy Drink Mix Powder Revenue (USD Million) by Country (2021-2032)
8.2.1. United States Energy Drink Mix Powder Regional Analysis and Outlook
8.2.2. Canada Energy Drink Mix Powder Regional Analysis and Outlook
8.2.3. Mexico Energy Drink Mix Powder Regional Analysis and Outlook
8.3. Europe Energy Drink Mix Powder Revenue (USD Million), by Country (2021-2032)
8.3.1. Germany Energy Drink Mix Powder Regional Analysis and Outlook
8.3.2. France Energy Drink Mix Powder Regional Analysis and Outlook
8.3.3. United Kingdom Energy Drink Mix Powder Regional Analysis and Outlook
8.3.4. Spain Energy Drink Mix Powder Regional Analysis and Outlook
8.3.5. Italy Energy Drink Mix Powder Regional Analysis and Outlook
8.3.6. Russia Energy Drink Mix Powder Regional Analysis and Outlook
8.3.7. Rest of Europe Energy Drink Mix Powder Regional Analysis and Outlook
8.4. Asia Pacific Energy Drink Mix Powder Revenue (USD Million) by Country (2021-2032)
8.4.1. China Energy Drink Mix Powder Regional Analysis and Outlook
8.4.2. Japan Energy Drink Mix Powder Regional Analysis and Outlook
8.4.3. India Energy Drink Mix Powder Regional Analysis and Outlook
8.4.4. South Korea Energy Drink Mix Powder Regional Analysis and Outlook
8.4.5. Australia Energy Drink Mix Powder Regional Analysis and Outlook
8.4.6. South East Asia Energy Drink Mix Powder Regional Analysis and Outlook
8.4.7. Rest of Asia Pacific Energy Drink Mix Powder Regional Analysis and Outlook
8.5. South America Energy Drink Mix Powder Revenue (USD Million), by Country (2021-2032)
8.5.1. Brazil Energy Drink Mix Powder Regional Analysis and Outlook
8.5.2. Argentina Energy Drink Mix Powder Regional Analysis and Outlook
8.5.3. Rest of South America Energy Drink Mix Powder Regional Analysis and Outlook
8.6. Middle East and Africa Energy Drink Mix Powder Revenue (USD Million) by Country (2021-2032)
8.6.1. Middle East Energy Drink Mix Powder Regional Analysis and Outlook
8.6.2. Africa Energy Drink Mix Powder Regional Analysis and Outlook
Chapter 9. North America Energy Drink Mix Powder Analysis and Outlook
9.1. North America Energy Drink Mix Powder Revenue (USD Million) by Segments (2021-2032)
9.1.1. North America Energy Drink Mix Powder Revenue (USD Million) by Type (2021-2032)
9.1.2. North America Energy Drink Mix Powder Revenue (USD Million) by Application (2021-2032)
9.1.3. North America Energy Drink Mix Powder Revenue (USD Million) by Product (2021-2032)
By Type
Plastic Bottles
Glass
Others
By Application
Teenagers
Adults
Geriatric
Chapter 10. Europe Energy Drink Mix Powder Analysis and Outlook
10.1. Europe Energy Drink Mix Powder Revenue (USD Million), by Segments (USD Million) (2021-2032)
10.1.1. Europe Energy Drink Mix Powder Revenue (USD Million) by Type (2021-2032)
10.1.2. Europe Energy Drink Mix Powder Revenue (USD Million) by Application (2021-2032)
10.1.3. Europe Energy Drink Mix Powder Revenue (USD Million) by Product (2021-2032)
By Type
Plastic Bottles
Glass
Others
By Application
Teenagers
Adults
Geriatric
Chapter 11. Asia Pacific Energy Drink Mix Powder Analysis and Outlook
11.1. Asia Pacific Energy Drink Mix Powder Revenue (USD Million), and Revenue (USD Million) by Segments (2021-2032)
11.1.1. Asia Pacific Energy Drink Mix Powder Revenue (USD Million) by Type (2021-2032)
11.1.2. Asia Pacific Energy Drink Mix Powder Revenue (USD Million) by Application (2021-2032)
11.1.3. Asia Pacific Energy Drink Mix Powder Revenue (USD Million) by Product (2021-2032)
By Type
Plastic Bottles
Glass
Others
By Application
Teenagers
Adults
Geriatric
Chapter 12. South America Energy Drink Mix Powder Analysis and Outlook
12.1. South America Energy Drink Mix Powder Revenue (USD Million), by Segments (2021-2032)
12.1.1. South America Energy Drink Mix Powder Revenue (USD Million) by Type (2021-2032)
12.1.2. South America Energy Drink Mix Powder Revenue (USD Million) by Application (2021-2032)
12.1.3. South America Energy Drink Mix Powder Revenue (USD Million) by Product (2021-2032)
By Type
Plastic Bottles
Glass
Others
By Application
Teenagers
Adults
Geriatric
Chapter 13. Middle East and Africa Energy Drink Mix Powder Analysis and Outlook
13.1. Middle East and Africa Energy Drink Mix Powder Revenue (USD Million), by Segments (2021-2032)
13.1.1. Middle East and Africa Energy Drink Mix Powder Revenue (USD Million) by Type (2021-2032)
13.1.2. Middle East and Africa Energy Drink Mix Powder Revenue (USD Million) by Application (2021-2032)
13.1.3. Middle East and Africa Energy Drink Mix Powder Revenue (USD Million) by Product (2021-2032)
By Type
Plastic Bottles
Glass
Others
By Application
Teenagers
Adults
Geriatric
Chapter 14. Energy Drink Mix Powder Company Profiles
14.1 Business Overview
14.2 Product Profiles
14.3 SWOT Profiles
14.5 Recent Developments
14.6 Financial Profile
List of Companies
AdvoCare International
Amway Corp
Gatorade
GU Energy Labs
Herbalife
Sturm Foods
15. Methodology and Data Sources
15.1 Customization Offerings
15.2 Subscription Services
15.3 Related Reports
15.4 Publisher Expertise
LIST OF TABLES
Table 1 Market Segmentation Analysis
Table 2 Global Energy Drink Mix Powder Market Share of Leading Companies, 2023
Table 3 Product Offerings of Leading Companies
Table 4 Low Growth Scenario Forecasts
Table 5 Reference Case Growth Scenario
Table 6 High Growth Case Scenario
Table 7 Global Energy Drink Mix Powder Revenue (USD Million) And CAGR (%) By Type (2021-2032)
Table 8 Global Energy Drink Mix Powder Revenue (USD Million) And CAGR (%) By Application (2021-2032)
Table 9 Global Energy Drink Mix Powder Revenue (USD Million) And CAGR (%) By Product (2021-2032)
Table 10 Global Energy Drink Mix Powder Market Revenue (USD Million) By Regions (2021-2032)
Table 11 Global Energy Drink Mix Powder Market Share (%) By Regions (2021-2032)
Table 12 North America Energy Drink Mix Powder Revenue (USD Million) By Country (2021-2032)
Table 13 Europe Energy Drink Mix Powder Revenue (USD Million) By Country (2021-2032)
Table 14 Asia Pacific Energy Drink Mix Powder Revenue (USD Million) By Country (2021-2032)
Table 15 South America Energy Drink Mix Powder Revenue (USD Million) By Country (2021-2032)
Table 16 Middle East and Africa Energy Drink Mix Powder Revenue (USD Million) By Region (2021-2032)
Table 17 North America Energy Drink Mix Powder Revenue (USD Million) By Type (2021-2032)
Table 18 North America Energy Drink Mix Powder Revenue (USD Million) By Application (2021-2032)
Table 19 North America Energy Drink Mix Powder Revenue (USD Million) By Product (2021-2032)
Table 20 Europe Energy Drink Mix Powder Revenue (USD Million) By Type (2021-2032)
Table 21 Europe Energy Drink Mix Powder Revenue (USD Million) By Application (2021-2032)
Table 22 Europe Energy Drink Mix Powder Revenue (USD Million) By Product (2021-2032)
Table 23 Asia Pacific Energy Drink Mix Powder Revenue (USD Million) By Type (2021-2032)
Table 24 Asia Pacific Energy Drink Mix Powder Revenue (USD Million) By Application (2021-2032)
Table 25 Asia Pacific Energy Drink Mix Powder Revenue (USD Million) By Product (2021-2032)
Table 26 South America Energy Drink Mix Powder Revenue (USD Million) By Type (2021-2032)
Table 27 South America Energy Drink Mix Powder Revenue (USD Million) By Application (2021-2032)
Table 28 South America Energy Drink Mix Powder Revenue (USD Million) By Product (2021-2032)
Table 29 Middle East and Africa Energy Drink Mix Powder Revenue (USD Million) By Type (2021-2032)
Table 30 Middle East and Africa Energy Drink Mix Powder Revenue (USD Million) By Application (2021-2032)
Table 31 Middle East and Africa Energy Drink Mix Powder Revenue (USD Million) By Product (2021-2032)
LIST OF FIGURES
Figure 1. Market Scope
Figure 2. Pricing Forecasts Per Unit, 2023- 2032
Figure 3. Porter’s Five Forces
Figure 4. Global Energy Drink Mix Powder Market Revenue (USD Million) By Regions (2021-2032)
Figure 5. Global Energy Drink Mix Powder Market Share (%) By Regions (2023)
Figure 6. North America Energy Drink Mix Powder Revenue (USD Million) By Country (2021-2032)
Figure 7. United States Energy Drink Mix Powder Revenue (USD Million) By Country (2021-2032)
Figure 8. Canada Energy Drink Mix Powder Revenue (USD Million) By Country (2021-2032)
Figure 9. Mexico Energy Drink Mix Powder Revenue (USD Million) By Country (2021-2032)
Figure 10. Europe Energy Drink Mix Powder Revenue (USD Million) By Country (2021-2032)
Figure 11. Germany Energy Drink Mix Powder Revenue (USD Million) By Country (2021-2032)
Figure 12. France Energy Drink Mix Powder Revenue (USD Million) By Country (2021-2032)
Figure 13. United Kingdom Energy Drink Mix Powder Revenue (USD Million) By Country (2021-2032)
Figure 14. Spain Energy Drink Mix Powder Revenue (USD Million) By Country (2021-2032)
Figure 15. Italy Energy Drink Mix Powder Revenue (USD Million) By Country (2021-2032)
Figure 16. Russia Energy Drink Mix Powder Revenue (USD Million) By Country (2021-2032)
Figure 17. Rest of Europe Energy Drink Mix Powder Revenue (USD Million) By Country (2021-2032)
Figure 11. Asia Pacific Energy Drink Mix Powder Revenue (USD Million) By Country (2021-2032)
Figure 12. China Energy Drink Mix Powder Revenue (USD Million) By Country (2021-2032)
Figure 13. Japan Energy Drink Mix Powder Revenue (USD Million) By Country (2021-2032)
Figure 14. India Energy Drink Mix Powder Revenue (USD Million) By Country (2021-2032)
Figure 15. South Korea Energy Drink Mix Powder Revenue (USD Million) By Country (2021-2032)
Figure 16. Australia Energy Drink Mix Powder Revenue (USD Million) By Country (2021-2032)
Figure 17. South East Asia Energy Drink Mix Powder Revenue (USD Million) By Country (2021-2032)
Figure 18. South America Energy Drink Mix Powder Revenue (USD Million) By Country (2021-2032)
Figure 19. Brazil Energy Drink Mix Powder Revenue (USD Million) By Country (2021-2032)
Figure 20. Argentina Energy Drink Mix Powder Revenue (USD Million) By Country (2021-2032)
Figure 21. Rest of Asia Pacific Energy Drink Mix Powder Revenue (USD Million) By Country (2021-2032)
Figure 22. Middle East and Africa Energy Drink Mix Powder Revenue (USD Million) By Region (2021-2032)
Figure 23. Saudi Arabia Energy Drink Mix Powder Revenue (USD Million) By Region (2021-2032)
Figure 24. The UAE Energy Drink Mix Powder Revenue (USD Million) By Region (2021-2032)
Figure 25. Rest of Middle East Energy Drink Mix Powder Revenue (USD Million) By Region (2021-2032)
Figure 26. South Africa Energy Drink Mix Powder Revenue (USD Million) By Region (2021-2032)
Figure 27. Africa Energy Drink Mix Powder Revenue (USD Million) By Region (2021-2032)
Figure 28. North America Energy Drink Mix Powder Revenue (USD Million) By Type (2021-2032)
Figure 29. North America Energy Drink Mix Powder Revenue (USD Million) By Application (2021-2032)
Figure 30. North America Energy Drink Mix Powder Revenue (USD Million) By Product (2021-2032)
Figure 31. Europe Energy Drink Mix Powder Revenue (USD Million) By Type (2021-2032)
Figure 32. Europe Energy Drink Mix Powder Revenue (USD Million) By Application (2021-2032)
Figure 33. Europe Energy Drink Mix Powder Revenue (USD Million) By Product (2021-2032)
Figure 34. Asia Pacific Energy Drink Mix Powder Revenue (USD Million) By Type (2021-2032)
Figure 35. Asia Pacific Energy Drink Mix Powder Revenue (USD Million) By Application (2021-2032)
Figure 36. Asia Pacific Energy Drink Mix Powder Revenue (USD Million) By Product (2021-2032)
Figure 37. South America Energy Drink Mix Powder Revenue (USD Million) By Type (2021-2032)
Figure 38. South America Energy Drink Mix Powder Revenue (USD Million) By Application (2021-2032)
Figure 39. South America Energy Drink Mix Powder Revenue (USD Million) By Product (2021-2032)
Figure 40. Middle East and Africa Energy Drink Mix Powder Revenue (USD Million) By Type (2021-2032)
Figure 41. Middle East and Africa Energy Drink Mix Powder Revenue (USD Million) By Application (2021-2032)
Figure 42. Middle East and Africa Energy Drink Mix Powder Revenue (USD Million) By Product (2021-2032)
By Type
Plastic Bottles
Glass
Others
By Application
Teenagers
Adults
Geriatric
Countries Analyzed
North America (US, Canada, Mexico)
Europe (Germany, UK, France, Spain, Italy, Russia, Rest of Europe)
Asia Pacific (China, India, Japan, South Korea, Australia, South East Asia, Rest of Asia)
South America (Brazil, Argentina, Rest of South America)
Middle East and Africa (Saudi Arabia, UAE, Rest of Middle East, South Africa, Egypt, Rest of Africa)
