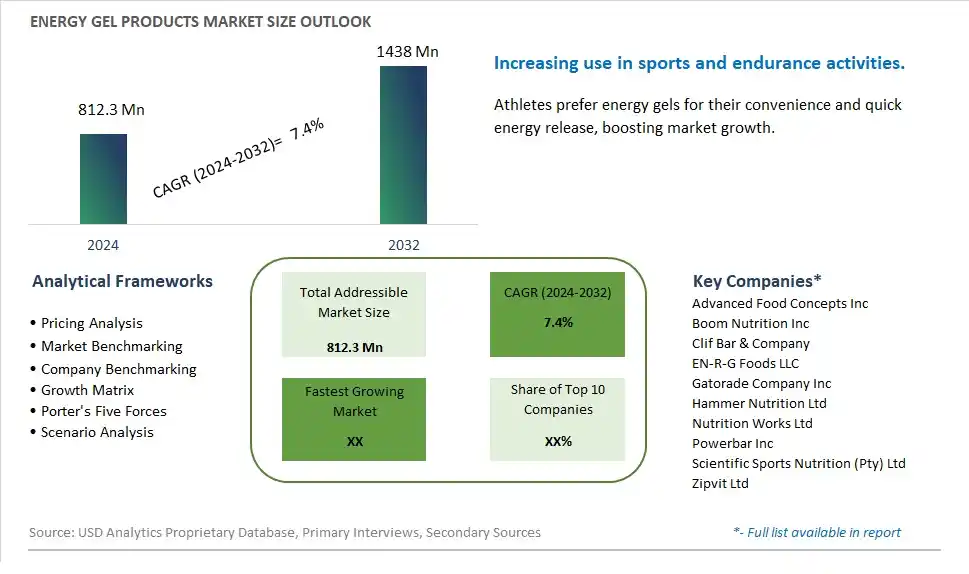
Global Energy Gel Products Market Size is valued at $812.3 Million in 2024 and is forecast to register a growth rate (CAGR) of 7.4% to reach $1438 Million by 2032.
The global Energy Gel Products Market Comprehensive Study analyzes and forecasts the market size across 6 regions and 24 countries for diverse segments -By Flavor (Fruit Flavors, Lemonade/Limeade Flavors, Chocolate Flavor, Coffee/Espresso Flavor, Vanilla Flavor, Blended Flavors, Others), By Type (Organic, Conventional), By Pack Size (Single-Serve, Multi-Serve), By Ingredient (Caffeine-free, With Caffeine), By Sales Channel (Hypermarkets/ Supermarkets, Groceries, Convenience Stores, Specialty Stores, Online Retailers, Others)
An Introduction to Energy Gel Products Market
In 2024, the Energy Gel Products market is witnessing significant growth, driven by the increasing demand for quick and effective energy sources during athletic activities and endurance sports. Energy gels, valued for their convenience, rapid absorption, and performance-enhancing benefits, are popular among runners, cyclists, and outdoor enthusiasts. The market benefits from advancements in gel formulation and packaging technologies, the growing trend of health and fitness, and the expansion of the sports nutrition industry. Additionally, the rising awareness of the benefits of energy gels for sustained performance is contributing to market expansion.
Energy Gel Products Competitive Landscape
The market report analyses the leading companies in the industry including Advanced Food Concepts Inc, Boom Nutrition Inc, Clif Bar & Company, EN-R-G Foods LLC, Gatorade Company Inc, Hammer Nutrition Ltd, Nutrition Works Ltd, Powerbar Inc, Scientific Sports Nutrition (Pty) Ltd, Zipvit Ltd, and Others.
Energy Gel Products Market Dynamics
Energy Gel Products Market Trend: Demand for Convenient and Portable Energy Solutions
The market for energy gel products is experiencing a prominent trend towards the demand for convenient and portable energy solutions. Consumers leading active lifestyles, such as athletes, fitness enthusiasts, and on-the-go professionals, seek energy products that are easy to consume during physical activities or busy schedules. Energy gel products offer a convenient and mess-free option for quick energy replenishment, providing a boost of carbohydrates, electrolytes, and sometimes caffeine in a compact and portable format.
Energy Gel Products Market Driver: Performance Enhancement and Endurance Support in Sports and Fitness
A major driver for the energy gel products market is the focus on performance enhancement and endurance support in sports and fitness activities. Athletes and fitness enthusiasts use energy gels as a convenient source of carbohydrates and energy to fuel their workouts, races, and training sessions. The drive for improved athletic performance, faster recovery, and sustained energy levels during prolonged physical exertion fuels the demand for energy gel products designed to provide rapid energy release, hydration support, and electrolyte balance.
Energy Gel Products Market Opportunity: Innovation in Formulations and Targeted Functionalities
The energy gel products market presents a significant opportunity for innovation in formulations and targeted functionalities. Companies specializing in sports nutrition and energy supplements can develop energy gel products with customized formulations to meet specific performance goals and consumer preferences. This opportunity includes exploring new ingredients, such as natural sweeteners, plant-based carbohydrates, electrolyte blends, amino acids, and adaptogens, to enhance the nutritional profile and functionality of energy gels. Additionally, developing specialized energy gel variants for different sports, intensity levels, and endurance activities can cater to diverse athlete needs and market segments, leading to increased market penetration and consumer satisfaction.
Energy Gel Products Market Share Analysis: Fruit Flavors segment generated the highest revenue share in the industry
The largest segment in the Energy Gel Products Market is Fruit Flavors. These flavors, such as berry, citrus, and tropical fruit variations, hold a dominant position in the market due to their widespread appeal and refreshing taste profiles. Fruit flavors cater to a broad consumer base that includes athletes, fitness enthusiasts, and individuals seeking a quick energy boost during physical activities or busy schedules. The popularity of Fruit Flavors is further enhanced by their natural and vibrant taste, which aligns well with consumer preferences for healthier and more natural energy products. As a result, companies in the energy gel industry focus heavily on developing innovative fruit flavor formulations and expanding their product offerings within this segment to capitalize on its market dominance and meet the growing demand for convenient and functional energy solutions.
Energy Gel Products Market Share Analysis: Organic is the fastest growing segment over the forecast period to 2032
The fastest-growing segment in the Energy Gel Products Market is Organic Energy Gels. With the increasing focus on health-conscious lifestyles and sustainable consumption patterns, consumers are actively seeking organic and natural alternatives across various product categories, including energy gels. Organic energy gels are formulated using certified organic ingredients, free from synthetic additives, pesticides, and genetically modified organisms (GMOs). This segment's rapid growth can be attributed to the rising awareness regarding the benefits of organic products, such as reduced exposure to harmful chemicals and environmental conservation. Consumers perceive organic energy gels as healthier and more environmentally friendly options, driving their demand among fitness enthusiasts, athletes, and health-conscious individuals. As a result, manufacturers are ramping up production and innovation efforts to meet the growing demand for organic energy gels and capitalize on this flourishing market trend.
Energy Gel Products Market Share Analysis: Single-Serve segment generated the highest revenue share in the industry
The largest segment in the Energy Gel Products Market is the Single-Serve pack size category. Single-serve energy gels are designed for convenient consumption during physical activities, such as sports, workouts, or outdoor adventures. They come in individual packaging, offering a precise and portable dose of energy-boosting nutrients. The fast-paced lifestyle and the increasing popularity of on-the-go nutrition solutions have significantly contributed to the dominance of single-serve energy gels in the market. Athletes, fitness enthusiasts, and individuals leading active lifestyles prefer single-serve packs due to their ease of use, hygienic packaging, and suitability for quick energy replenishment during exercise or busy schedules. Further, single-serve packs ensure portion control and minimize wastage, aligning with consumers' preferences for convenience and sustainability. As a result, manufacturers continue to focus on innovating and diversifying their offerings within the single-serve segment to cater to evolving consumer needs and preferences.
Energy Gel Products Market Share Analysis: With Caffeine is the fastest growing segment over the forecast period to 2032
The fastest-growing segment in the Energy Gel Products Market is the "With Caffeine" category. Caffeine is a well-known stimulant that enhances alertness, focus, and endurance, making it a popular ingredient in energy gels targeting athletes, fitness enthusiasts, and individuals seeking a performance boost. The growing awareness of the benefits of caffeine, coupled with an increasing emphasis on sports and fitness activities globally, is driving the rapid growth of energy gels containing caffeine. Athletes and active consumers often use these products to improve their exercise performance, delay fatigue, and enhance overall endurance levels. Additionally, the convenience factor of energy gels, especially those with caffeine, contributes to their rising demand among individuals leading busy lifestyles who need quick and portable energy solutions. Manufacturers are continually innovating to create new formulations with optimal caffeine content, appealing flavors, and functional benefits to meet the evolving preferences and requirements of consumers in the dynamic energy gel market landscape.
Energy Gel Products Market Segmentation
By Flavor
Fruit Flavors
Lemonade/Limeade Flavors
Chocolate Flavor
Coffee/Espresso Flavor
Vanilla Flavor
Blended Flavors
Others
By Type
Organic
Conventional
By Pack Size
Single-Serve
Multi-Serve
By Ingredient
Caffeine-free
With Caffeine
By Sales Channel
Hypermarkets/ Supermarkets
Groceries
Convenience Stores
Specialty Stores
Online Retailers
Others
Countries Analyzed
North America (US, Canada, Mexico)
Europe (Germany, UK, France, Spain, Italy, Russia, Rest of Europe)
Asia Pacific (China, India, Japan, South Korea, Australia, South East Asia, Rest of Asia)
South America (Brazil, Argentina, Rest of South America)
Middle East and Africa (Saudi Arabia, UAE, Rest of Middle East, South Africa, Egypt, Rest of Africa)
Energy Gel Products Companies Profiled in the Study
Advanced Food Concepts Inc
Boom Nutrition Inc
Clif Bar & Company
EN-R-G Foods LLC
Gatorade Company Inc
Hammer Nutrition Ltd
Nutrition Works Ltd
Powerbar Inc
Scientific Sports Nutrition (Pty) Ltd
Zipvit Ltd
*- List Not Exhaustive
Chapter 1. TABLE OF CONTENTS
Chapter 2. Introduction to Energy Gel Products Market
2.1. Market Overview
2.2. Key Statistics and Report Highlights
2.3. Scope of the Comprehensive Study
2.3.1. Market Definition
2.3.2 Countries and Regions Covered
2.3.3 Research Objective
2.3.4 Units, Currency, and Conversions
2.3.5 Industry Value Chain
2.4. Key Market Segments
2.5. Key Companies
2.6. Study Period
Chapter 3. Strategic Analysis Review
3.1. Energy Gel Products Pricing Analysis and Forecast
3.2. Porter’s Five Forces
3.3. Market Ecosystem
3.4. SWOT Analysis
3.5. Regulatory Scenario
3.3. Effects of Inflation, Russia-Ukraine War, moderating economic growth, and other macroeconomic factors
Chapter 4. Competitive Landscape
4.1. Market Share Analysis
4.1.1. Global Energy Gel Products Market Share by Company, 2023
4.1.2. Product Offerings of Leading Energy Gel Products Companies
4.2. Market Entropy
4.2.1. New Product Launches in the Industry
4.2.2. Mergers, Acquisitions, Joint ventures, and Partnerships
4.3. Key Strategies and Best Practices
Chapter 5. Global Market Projections: Best, Reference, and Low Case Scenarios
5.1. Growth Analysis- Case Scenario Definitions
5.2. Low Growth Case Scenario Forecasts
5.3. Reference Growth Case Scenario Forecasts
5.4. High Growth Case Scenario Forecasts
Chapter 6. Market Dynamics
6.1. Energy Gel Products Market Drivers
6.2. Energy Gel Products Market Challenges
6.6. Energy Gel Products Market Opportunities
6.4. Energy Gel Products Market Trends
Chapter 7. Global Energy Gel Products Market Outlook Trends
7.1. Global Energy Gel Products Revenue (USD Million) and CAGR (%) by Type (2021-2032)
7.2. Global Energy Gel Products Revenue (USD Million) and CAGR (%) by Application (2021-2032)
7.3. Global Energy Gel Products Revenue (USD Million) and CAGR (%) by Product (2021-2032)
By Flavor
Fruit Flavors
Lemonade/Limeade Flavors
Chocolate Flavor
Coffee/Espresso Flavor
Vanilla Flavor
Blended Flavors
Others
By Type
Organic
Conventional
By Pack Size
Single-Serve
Multi-Serve
By Ingredient
Caffeine-free
With Caffeine
By Sales Channel
Hypermarkets/ Supermarkets
Groceries
Convenience Stores
Specialty Stores
Online Retailers
Others
Chapter 8. Global Energy Gel Products Regional Analysis and Outlook
8.1. Global Energy Gel Products Revenue (USD Million) By Regions (2021- 2032)
8.2. North America Energy Gel Products Revenue (USD Million) by Country (2021-2032)
8.2.1. United States Energy Gel Products Regional Analysis and Outlook
8.2.2. Canada Energy Gel Products Regional Analysis and Outlook
8.2.3. Mexico Energy Gel Products Regional Analysis and Outlook
8.3. Europe Energy Gel Products Revenue (USD Million), by Country (2021-2032)
8.3.1. Germany Energy Gel Products Regional Analysis and Outlook
8.3.2. France Energy Gel Products Regional Analysis and Outlook
8.3.3. United Kingdom Energy Gel Products Regional Analysis and Outlook
8.3.4. Spain Energy Gel Products Regional Analysis and Outlook
8.3.5. Italy Energy Gel Products Regional Analysis and Outlook
8.3.6. Russia Energy Gel Products Regional Analysis and Outlook
8.3.7. Rest of Europe Energy Gel Products Regional Analysis and Outlook
8.4. Asia Pacific Energy Gel Products Revenue (USD Million) by Country (2021-2032)
8.4.1. China Energy Gel Products Regional Analysis and Outlook
8.4.2. Japan Energy Gel Products Regional Analysis and Outlook
8.4.3. India Energy Gel Products Regional Analysis and Outlook
8.4.4. South Korea Energy Gel Products Regional Analysis and Outlook
8.4.5. Australia Energy Gel Products Regional Analysis and Outlook
8.4.6. South East Asia Energy Gel Products Regional Analysis and Outlook
8.4.7. Rest of Asia Pacific Energy Gel Products Regional Analysis and Outlook
8.5. South America Energy Gel Products Revenue (USD Million), by Country (2021-2032)
8.5.1. Brazil Energy Gel Products Regional Analysis and Outlook
8.5.2. Argentina Energy Gel Products Regional Analysis and Outlook
8.5.3. Rest of South America Energy Gel Products Regional Analysis and Outlook
8.6. Middle East and Africa Energy Gel Products Revenue (USD Million) by Country (2021-2032)
8.6.1. Middle East Energy Gel Products Regional Analysis and Outlook
8.6.2. Africa Energy Gel Products Regional Analysis and Outlook
Chapter 9. North America Energy Gel Products Analysis and Outlook
9.1. North America Energy Gel Products Revenue (USD Million) by Segments (2021-2032)
9.1.1. North America Energy Gel Products Revenue (USD Million) by Type (2021-2032)
9.1.2. North America Energy Gel Products Revenue (USD Million) by Application (2021-2032)
9.1.3. North America Energy Gel Products Revenue (USD Million) by Product (2021-2032)
By Flavor
Fruit Flavors
Lemonade/Limeade Flavors
Chocolate Flavor
Coffee/Espresso Flavor
Vanilla Flavor
Blended Flavors
Others
By Type
Organic
Conventional
By Pack Size
Single-Serve
Multi-Serve
By Ingredient
Caffeine-free
With Caffeine
By Sales Channel
Hypermarkets/ Supermarkets
Groceries
Convenience Stores
Specialty Stores
Online Retailers
Others
Chapter 10. Europe Energy Gel Products Analysis and Outlook
10.1. Europe Energy Gel Products Revenue (USD Million), by Segments (USD Million) (2021-2032)
10.1.1. Europe Energy Gel Products Revenue (USD Million) by Type (2021-2032)
10.1.2. Europe Energy Gel Products Revenue (USD Million) by Application (2021-2032)
10.1.3. Europe Energy Gel Products Revenue (USD Million) by Product (2021-2032)
By Flavor
Fruit Flavors
Lemonade/Limeade Flavors
Chocolate Flavor
Coffee/Espresso Flavor
Vanilla Flavor
Blended Flavors
Others
By Type
Organic
Conventional
By Pack Size
Single-Serve
Multi-Serve
By Ingredient
Caffeine-free
With Caffeine
By Sales Channel
Hypermarkets/ Supermarkets
Groceries
Convenience Stores
Specialty Stores
Online Retailers
Others
Chapter 11. Asia Pacific Energy Gel Products Analysis and Outlook
11.1. Asia Pacific Energy Gel Products Revenue (USD Million), and Revenue (USD Million) by Segments (2021-2032)
11.1.1. Asia Pacific Energy Gel Products Revenue (USD Million) by Type (2021-2032)
11.1.2. Asia Pacific Energy Gel Products Revenue (USD Million) by Application (2021-2032)
11.1.3. Asia Pacific Energy Gel Products Revenue (USD Million) by Product (2021-2032)
By Flavor
Fruit Flavors
Lemonade/Limeade Flavors
Chocolate Flavor
Coffee/Espresso Flavor
Vanilla Flavor
Blended Flavors
Others
By Type
Organic
Conventional
By Pack Size
Single-Serve
Multi-Serve
By Ingredient
Caffeine-free
With Caffeine
By Sales Channel
Hypermarkets/ Supermarkets
Groceries
Convenience Stores
Specialty Stores
Online Retailers
Others
Chapter 12. South America Energy Gel Products Analysis and Outlook
12.1. South America Energy Gel Products Revenue (USD Million), by Segments (2021-2032)
12.1.1. South America Energy Gel Products Revenue (USD Million) by Type (2021-2032)
12.1.2. South America Energy Gel Products Revenue (USD Million) by Application (2021-2032)
12.1.3. South America Energy Gel Products Revenue (USD Million) by Product (2021-2032)
By Flavor
Fruit Flavors
Lemonade/Limeade Flavors
Chocolate Flavor
Coffee/Espresso Flavor
Vanilla Flavor
Blended Flavors
Others
By Type
Organic
Conventional
By Pack Size
Single-Serve
Multi-Serve
By Ingredient
Caffeine-free
With Caffeine
By Sales Channel
Hypermarkets/ Supermarkets
Groceries
Convenience Stores
Specialty Stores
Online Retailers
Others
Chapter 13. Middle East and Africa Energy Gel Products Analysis and Outlook
13.1. Middle East and Africa Energy Gel Products Revenue (USD Million), by Segments (2021-2032)
13.1.1. Middle East and Africa Energy Gel Products Revenue (USD Million) by Type (2021-2032)
13.1.2. Middle East and Africa Energy Gel Products Revenue (USD Million) by Application (2021-2032)
13.1.3. Middle East and Africa Energy Gel Products Revenue (USD Million) by Product (2021-2032)
By Flavor
Fruit Flavors
Lemonade/Limeade Flavors
Chocolate Flavor
Coffee/Espresso Flavor
Vanilla Flavor
Blended Flavors
Others
By Type
Organic
Conventional
By Pack Size
Single-Serve
Multi-Serve
By Ingredient
Caffeine-free
With Caffeine
By Sales Channel
Hypermarkets/ Supermarkets
Groceries
Convenience Stores
Specialty Stores
Online Retailers
Others
Chapter 14. Energy Gel Products Company Profiles
14.1 Business Overview
14.2 Product Profiles
14.3 SWOT Profiles
14.5 Recent Developments
14.6 Financial Profile
List of Companies
Advanced Food Concepts Inc
Boom Nutrition Inc
Clif Bar & Company
EN-R-G Foods LLC
Gatorade Company Inc
Hammer Nutrition Ltd
Nutrition Works Ltd
Powerbar Inc
Scientific Sports Nutrition (Pty) Ltd
Zipvit Ltd
15. Methodology and Data Sources
15.1 Customization Offerings
15.2 Subscription Services
15.3 Related Reports
15.4 Publisher Expertise
LIST OF TABLES
Table 1 Market Segmentation Analysis
Table 2 Global Energy Gel Products Market Share of Leading Companies, 2023
Table 3 Product Offerings of Leading Companies
Table 4 Low Growth Scenario Forecasts
Table 5 Reference Case Growth Scenario
Table 6 High Growth Case Scenario
Table 7 Global Energy Gel Products Revenue (USD Million) And CAGR (%) By Type (2021-2032)
Table 8 Global Energy Gel Products Revenue (USD Million) And CAGR (%) By Application (2021-2032)
Table 9 Global Energy Gel Products Revenue (USD Million) And CAGR (%) By Product (2021-2032)
Table 10 Global Energy Gel Products Market Revenue (USD Million) By Regions (2021-2032)
Table 11 Global Energy Gel Products Market Share (%) By Regions (2021-2032)
Table 12 North America Energy Gel Products Revenue (USD Million) By Country (2021-2032)
Table 13 Europe Energy Gel Products Revenue (USD Million) By Country (2021-2032)
Table 14 Asia Pacific Energy Gel Products Revenue (USD Million) By Country (2021-2032)
Table 15 South America Energy Gel Products Revenue (USD Million) By Country (2021-2032)
Table 16 Middle East and Africa Energy Gel Products Revenue (USD Million) By Region (2021-2032)
Table 17 North America Energy Gel Products Revenue (USD Million) By Type (2021-2032)
Table 18 North America Energy Gel Products Revenue (USD Million) By Application (2021-2032)
Table 19 North America Energy Gel Products Revenue (USD Million) By Product (2021-2032)
Table 20 Europe Energy Gel Products Revenue (USD Million) By Type (2021-2032)
Table 21 Europe Energy Gel Products Revenue (USD Million) By Application (2021-2032)
Table 22 Europe Energy Gel Products Revenue (USD Million) By Product (2021-2032)
Table 23 Asia Pacific Energy Gel Products Revenue (USD Million) By Type (2021-2032)
Table 24 Asia Pacific Energy Gel Products Revenue (USD Million) By Application (2021-2032)
Table 25 Asia Pacific Energy Gel Products Revenue (USD Million) By Product (2021-2032)
Table 26 South America Energy Gel Products Revenue (USD Million) By Type (2021-2032)
Table 27 South America Energy Gel Products Revenue (USD Million) By Application (2021-2032)
Table 28 South America Energy Gel Products Revenue (USD Million) By Product (2021-2032)
Table 29 Middle East and Africa Energy Gel Products Revenue (USD Million) By Type (2021-2032)
Table 30 Middle East and Africa Energy Gel Products Revenue (USD Million) By Application (2021-2032)
Table 31 Middle East and Africa Energy Gel Products Revenue (USD Million) By Product (2021-2032)
LIST OF FIGURES
Figure 1. Market Scope
Figure 2. Pricing Forecasts Per Unit, 2023- 2032
Figure 3. Porter’s Five Forces
Figure 4. Global Energy Gel Products Market Revenue (USD Million) By Regions (2021-2032)
Figure 5. Global Energy Gel Products Market Share (%) By Regions (2023)
Figure 6. North America Energy Gel Products Revenue (USD Million) By Country (2021-2032)
Figure 7. United States Energy Gel Products Revenue (USD Million) By Country (2021-2032)
Figure 8. Canada Energy Gel Products Revenue (USD Million) By Country (2021-2032)
Figure 9. Mexico Energy Gel Products Revenue (USD Million) By Country (2021-2032)
Figure 10. Europe Energy Gel Products Revenue (USD Million) By Country (2021-2032)
Figure 11. Germany Energy Gel Products Revenue (USD Million) By Country (2021-2032)
Figure 12. France Energy Gel Products Revenue (USD Million) By Country (2021-2032)
Figure 13. United Kingdom Energy Gel Products Revenue (USD Million) By Country (2021-2032)
Figure 14. Spain Energy Gel Products Revenue (USD Million) By Country (2021-2032)
Figure 15. Italy Energy Gel Products Revenue (USD Million) By Country (2021-2032)
Figure 16. Russia Energy Gel Products Revenue (USD Million) By Country (2021-2032)
Figure 17. Rest of Europe Energy Gel Products Revenue (USD Million) By Country (2021-2032)
Figure 11. Asia Pacific Energy Gel Products Revenue (USD Million) By Country (2021-2032)
Figure 12. China Energy Gel Products Revenue (USD Million) By Country (2021-2032)
Figure 13. Japan Energy Gel Products Revenue (USD Million) By Country (2021-2032)
Figure 14. India Energy Gel Products Revenue (USD Million) By Country (2021-2032)
Figure 15. South Korea Energy Gel Products Revenue (USD Million) By Country (2021-2032)
Figure 16. Australia Energy Gel Products Revenue (USD Million) By Country (2021-2032)
Figure 17. South East Asia Energy Gel Products Revenue (USD Million) By Country (2021-2032)
Figure 18. South America Energy Gel Products Revenue (USD Million) By Country (2021-2032)
Figure 19. Brazil Energy Gel Products Revenue (USD Million) By Country (2021-2032)
Figure 20. Argentina Energy Gel Products Revenue (USD Million) By Country (2021-2032)
Figure 21. Rest of Asia Pacific Energy Gel Products Revenue (USD Million) By Country (2021-2032)
Figure 22. Middle East and Africa Energy Gel Products Revenue (USD Million) By Region (2021-2032)
Figure 23. Saudi Arabia Energy Gel Products Revenue (USD Million) By Region (2021-2032)
Figure 24. The UAE Energy Gel Products Revenue (USD Million) By Region (2021-2032)
Figure 25. Rest of Middle East Energy Gel Products Revenue (USD Million) By Region (2021-2032)
Figure 26. South Africa Energy Gel Products Revenue (USD Million) By Region (2021-2032)
Figure 27. Africa Energy Gel Products Revenue (USD Million) By Region (2021-2032)
Figure 28. North America Energy Gel Products Revenue (USD Million) By Type (2021-2032)
Figure 29. North America Energy Gel Products Revenue (USD Million) By Application (2021-2032)
Figure 30. North America Energy Gel Products Revenue (USD Million) By Product (2021-2032)
Figure 31. Europe Energy Gel Products Revenue (USD Million) By Type (2021-2032)
Figure 32. Europe Energy Gel Products Revenue (USD Million) By Application (2021-2032)
Figure 33. Europe Energy Gel Products Revenue (USD Million) By Product (2021-2032)
Figure 34. Asia Pacific Energy Gel Products Revenue (USD Million) By Type (2021-2032)
Figure 35. Asia Pacific Energy Gel Products Revenue (USD Million) By Application (2021-2032)
Figure 36. Asia Pacific Energy Gel Products Revenue (USD Million) By Product (2021-2032)
Figure 37. South America Energy Gel Products Revenue (USD Million) By Type (2021-2032)
Figure 38. South America Energy Gel Products Revenue (USD Million) By Application (2021-2032)
Figure 39. South America Energy Gel Products Revenue (USD Million) By Product (2021-2032)
Figure 40. Middle East and Africa Energy Gel Products Revenue (USD Million) By Type (2021-2032)
Figure 41. Middle East and Africa Energy Gel Products Revenue (USD Million) By Application (2021-2032)
Figure 42. Middle East and Africa Energy Gel Products Revenue (USD Million) By Product (2021-2032)
By Flavor
Fruit Flavors
Lemonade/Limeade Flavors
Chocolate Flavor
Coffee/Espresso Flavor
Vanilla Flavor
Blended Flavors
Others
By Type
Organic
Conventional
By Pack Size
Single-Serve
Multi-Serve
By Ingredient
Caffeine-free
With Caffeine
By Sales Channel
Hypermarkets/ Supermarkets
Groceries
Convenience Stores
Specialty Stores
Online Retailers
Others
Countries Analyzed
North America (US, Canada, Mexico)
Europe (Germany, UK, France, Spain, Italy, Russia, Rest of Europe)
Asia Pacific (China, India, Japan, South Korea, Australia, South East Asia, Rest of Asia)
South America (Brazil, Argentina, Rest of South America)
Middle East and Africa (Saudi Arabia, UAE, Rest of Middle East, South Africa, Egypt, Rest of Africa)
