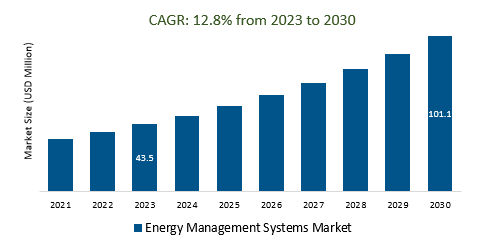
The global market size for energy management systems is projected to witness substantial growth, expanding from an estimated USD 43.5 billion in 2023 to reach USD 101.1 billion by 2030. This growth trajectory reflects a robust Compound Annual Growth Rate (CAGR) of 12.8% between 2023 and 2030.
The momentum behind this expansion is propelled by various laws and regulations established by governments on a regional level across the world. Supportive regulations to curb energy consumption and promote awareness about energy conservation practices support the market outlook. Governments across countries are taking measures to promote the adoption of energy management systems in diverse sectors, including industrial, commercial, and residential applications. Amidst this endeavor, energy management systems hold a pivotal role in optimizing energy utilization, thus contributing to the broader sustainability agenda.
Energy Management Systems Market Analysis
The Energy Management Systems (EMS) market report provides a comprehensive evaluation of the industry landscape, uncovering key trends, drivers, and challenges that shape its trajectory. The increasing global emphasis on sustainability and energy efficiency continues to propel the demand for EMS solutions, driving market growth.
One of the pivotal drivers identified within the analysis is the growing need for organizations to optimize energy consumption. With escalating energy costs and stringent environmental regulations, industries are turning to EMS to monitor, control, and optimize their energy usage. This trend is particularly pronounced across sectors like manufacturing, commercial buildings, and utilities.
The integration of advanced technologies, such as the Internet of Things (IoT) and data analytics, is significantly influencing the EMS market. These technologies enable real-time monitoring and data-driven insights, empowering businesses to make informed decisions regarding energy consumption and efficiency enhancement. The analysis also underscores the role of regulatory frameworks in shaping the EMS landscape. Government initiatives aimed at reducing carbon emissions and promoting sustainable practices are driving organizations to adopt EMS solutions as part of their compliance strategies.
Market Dynamics
Market Trend: Integration of Advanced Technologies for Efficient Energy Management
The Energy Management Systems (EMS) market has witnessed a transformative shift driven by the integration of cutting-edge technologies, particularly the Internet of Things (IoT) and Data Analytics. This presents strong scope for optimizing energy consumption and driving efficiency across various industries.
The IoT's integration with EMS is resulting in a paradigm shift in energy management. Through the deployment of interconnected sensors and devices, organizations can collect real-time data on energy usage, equipment performance, and environmental conditions. This data forms the foundation for informed decision-making, allowing businesses to identify inefficiencies and implement targeted strategies to enhance energy utilization.
Data Analytics amplifies the power of IoT-generated data by providing actionable insights. Advanced algorithms analyze complex datasets to uncover patterns, anomalies, and correlations that might otherwise remain unnoticed. Such insights enable organizations to identify energy-saving opportunities, predict equipment failures, and optimize operational processes, thus achieving substantial cost savings and efficiency improvements. On the other hand, ensuring data security and privacy remains paramount, especially given the sensitive nature of energy consumption data is critical. Additionally, organizations must overcome technical complexities related to data integration and interoperability, requiring robust implementation strategies.
Market Driver: Government initiatives to combat climate change and improve energy efficiency
Energy efficiency entails the judicious utilization of reduced energy inputs to achieve identical tasks or outcomes. In the realm of residential and commercial architecture, energy-efficient structures minimize energy consumption for heating, cooling, appliance usage, and electronics operation. Similarly, energy-efficient industrial facilities optimize energy expenditure in the production of goods.
The Paris Agreement adopted in 2015, ambitious targets for increasing the share of renewable energy by European, Asian, and American countries, carbon pricing mechanisms, energy efficiency standards, labeling programs, research and development (R&D) programs to advance clean energy technologies, energy storage, and carbon capture and storage, and other initiatives support the demand for efficient EMS systems.
By embracing energy conservation initiatives, organizations are focusing on gaining a competitive vantage point. Such positioning as environmentally conscious entities not only enhances consumer trust. In particular, global corporations are steadfastly embracing the ethos of environmental responsibility, aligning their operations with ecological considerations.
Market Opportunity: Rapid growth in Urbanisation and Digitalization Drive Demand for EMS
Digital technologies continue to revolutionize the global energy landscape, driven by heightened connectivity, enhanced reliability, and a steadfast commitment to sustainability. In particular, the integration of intelligent technologies such as smart thermostats is widely used across applications. The latest report by the International Energy Agency (IEA) underscores the significant role of digital tools, including smart lighting, in orchestrating a 10% reduction in energy consumption within buildings. Leading companies aim to achieve the targets through the utilization of real-time data to meticulously enhance operational efficiency.
Concurrently, the convergence of voluminous data resources, pervasive connectivity, and the rapid advancements witnessed in Artificial Intelligence and machine learning are encouraging niche applications and innovative business models throughout the energy sector. This sweeping impact resonates across diverse domains, ranging from the proliferation of autonomous vehicles and shared mobility solutions to the realm of 3D printing and interconnected appliances.
Market Segmentation
The Global Energy Management Systems Market is segmented by Component, Type, Deployment, End-Use Industry, and Region.
The Energy Management Systems Market's prominent category by type is predicted to be BEMS
In 2022, Building Energy Management Systems (BEMS) held a significant one-sixth share in the global energy management system market. These systems are crucial for reducing energy waste in buildings and making their operations more efficient. BEMS helps by gathering and using different types of data to manage buildings better.
In particular, computers and electronic devices use about 6% of a building's energy. Additionally, predictions from the US Energy Information Administration suggest that the energy used by data center servers will increase by five times by 2040, and the energy used by other tech equipment will more than double. BEMS plays a vital role to manage energy use in buildings, especially as technology consumption grows. Integration of BEMS to make buildings more energy-efficient, using data and smart management to improve their overall performance.
The majority of Energy Management Systems are Predicted to be Deployed On-premises
Amidst varying energy consumption rates among different servers, there is significant electricity usage involved. On-premise deployment is widely opted for as cloud-based solutions are still relatively novel. Consequently, maintenance and eventual replacement become imperative for these on-premise servers. However, direct migration to cloud-based alternatives is hindered by the substantial initial costs associated with such systems.
The market is primarily influenced by the retrofitting of existing on-premise servers to incorporate significant energy-efficient enhancements. The key factors driving on-premise deployment include the retrofitting of existing on-premise servers with notable energy-efficient features, specifically the integration of substantial CAPEX. The diverse energy consumption rates of servers lead to substantial electricity consumption. The need for maintaining and replacing on-premise servers, coupled with cost considerations for cloud migration, results in a growing market for on-premise energy management systems.
Food and Beverages held a Prominent Market Share by End-Use industry
Energy Management Systems play a crucial role in safeguarding generators and transformers utilized within the Food and Beverage sector. In today's landscape, effective energy management has evolved from a preference to a requisite for food & beverage plants. Heightened competition, narrower profit margins, and escalating energy expenses are compelling manufacturers to depart from their traditional approach of treating energy consumption as an unregulated overhead.
While electricity stands as the primary energy expenditure for most food & beverage establishments, it presents significant opportunities for cost reduction and swift profitability gains. As the industry undergoes substantial transformation catalyzed by technological advancements and new global frameworks, the food & beverage sector presents robust market demand.
Energy Management Systems ensure the protection of critical assets and also empower businesses to capitalize on energy efficiency, aligning with the industry's evolving dynamics.
North America is anticipated to Dominate the Global Markets
North America holds a prominent position within the Energy Management Systems (EMS) Market. Distinguished by its technological prowess and robust infrastructure, North America is poised to harness the potential of energy management with remarkable efficacy. As industries and businesses in the region embrace sustainability and efficiency as core tenets, the demand for sophisticated EMS solutions surges.
Leading the charge in renewable energy adoption, North America's commitment to reducing carbon footprint further propels the growth of EMS solutions. Regulatory frameworks, driven by environmental imperatives, incentivize enterprises to adopt comprehensive energy management strategies, fuelling the demand for cutting-edge systems. The projected dominance of North America in the EMS Market underscores the region's proactive stance toward innovative energy solutions. As industries pivot towards sustainable practices, the region stands as a beacon of progress, driving the evolution of energy management paradigms and setting a dynamic example for global counterparts.
Segmentation
By Component
- Hardware
- Software
- Services
By Type
By Deployment
By End-Use Industry
- Power & Energy
- Telecom n & IT
- Manufacturing
- Commercial & Residential
- Food & Beverages
- Others
By Region
- North America (United States, Canada, Mexico)
- Europe (Germany, France, United Kingdom, Spain, Italy, Others)
- Asia Pacific (China, India, Japan, South Korea, Australia, Others)
- Latin America (Brazil, Argentina, Others)
- Middle East and Africa (Saudi Arabia, UAE, Kuwait, Other Middle East, South Africa, Nigeria, Other Africa)
Key Players
The Energy Management Systems market is highly competitive, with several key players vying for market share. Leading firms profiled in the study include
- ABB
- Siemens
- Schneider Electric
- General Electric
- Emerson
- Cisco Systems, Inc.
- Honeywell International Inc
- Eaton (Ireland),
- Mitsubishi Electric Corporation
- IBM
- Hitachi
- Rockwell Automation, Inc
- Yokogawa Electric Corporation
- C3 Al
- Delta Electronics, Inc
- Enel X
- Neptune India
- Weidmuller
- Energy Management Systems, Inc.
- Distech Controls
Energy Management Systems Market Outlook 2023
1 Market Overview
1.1 Introduction to Energy Management Systems Market
1.2 Scope of the Study
1.3 Research Objective
1.3.1 Key Market Scope and Segments
1.3.2 Players Covered
1.3.3 Years Considered
2 Executive Summary
2.1 2023 Energy Management Systems Industry- Market Statistics
3 Market Dynamics
3.1 Market Drivers
3.2 Market Challenges
3.3 Market Opportunities
3.4 Market Trends
4 Market Factor Analysis
4.1 Porter’s Five Forces
4.2 Market Entropy
4.2.1 Global Energy Management Systems Market Companies with Area Served
4.2.2 Products Offerings Global Energy Management Systems Market
5 COVID-19 Impact Analysis and Outlook Scenarios
5.1.1 Covid-19 Impact Analysis
5.1.2 Post-COVID-19 Scenario- Low Growth Case
5.1.3 Post-COVID-19 Scenario- Reference Growth Case
5.1.4 Post-COVID-19 Scenario- Low Growth Case
6 Global Energy Management Systems Market Trends
6.1 Global Energy Management Systems Revenue (USD Million) and CAGR (%) by Type (2018-2030)
6.2 Global Energy Management Systems Revenue (USD Million) and CAGR (%) by Applications (2018-2030)
6.3 Global Energy Management Systems Revenue (USD Million) and CAGR (%) by Regions (2018-2030)
7 Global Energy Management Systems Market Revenue (USD Million) by Type, and Applications (2018-2022)
7.1 Global Energy Management Systems Revenue (USD Million) by Type (2018-2022)
7.1.1 Global Energy Management Systems Revenue (USD Million), Market Share (%) by Type (2018-2022)
7.2 Global Energy Management Systems Revenue (USD Million) by Applications (2018-2022)
7.2.1 Global Energy Management Systems Revenue (USD Million), Market Share (%) by Applications (2018-2022)
8 Global Energy Management Systems Development Regional Status and Outlook
8.1 Global Energy Management Systems Revenue (USD Million) By Regions (2018-2022)
8.2 North America Energy Management Systems Revenue (USD Million) by Type, and Application (2018-2022)
8.2.1 North America Energy Management Systems Revenue (USD Million) by Country (2018-2022)
8.2.2 North America Energy Management Systems Revenue (USD Million) by Type (2018-2022)
8.2.3 North America Energy Management Systems Revenue (USD Million) by Applications (2018-2022)
8.3 Europe Energy Management Systems Revenue (USD Million), by Type, and Applications (USD Million) (2018-2022)
8.3.1 Europe Energy Management Systems Revenue (USD Million), by Country (2018-2022)
8.3.2 Europe Energy Management Systems Revenue (USD Million) by Type (2018-2022)
8.3.3 Europe Energy Management Systems Revenue (USD Million) by Applications (2018-2022)
8.4 Asia Pacific Energy Management Systems Revenue (USD Million), and Revenue (USD Million) by Type, and Applications (2018-2022)
8.4.1 Asia Pacific Energy Management Systems Revenue (USD Million) by Country (2018-2022)
8.4.2 Asia Pacific Energy Management Systems Revenue (USD Million) by Type (2018-2022)
8.4.3 Asia Pacific Energy Management Systems Revenue (USD Million) by Applications (2018-2022)
8.5 South America Energy Management Systems Revenue (USD Million), by Type, and Applications (2018-2022)
8.5.1 South America Energy Management Systems Revenue (USD Million), by Country (2018-2022)
8.5.2 South America Energy Management Systems Revenue (USD Million) by Type (2018-2022)
8.5.3 South America Energy Management Systems Revenue (USD Million) by Applications (2018-2022)
8.6 Middle East and Africa Energy Management Systems Revenue (USD Million), by Type, Technology, Application, Thickness (2018-2022)
8.6.1 Middle East and Africa Energy Management Systems Revenue (USD Million) by Country (2018-2022)
8.6.2 Middle East and Africa Energy Management Systems Revenue (USD Million) by Type (2018-2022)
8.6.3 Middle East and Africa Energy Management Systems Revenue (USD Million) by Applications (2018-2022)
9 Company Profiles
10 Global Energy Management Systems Market Revenue (USD Million), by Type, and Applications (2023-2030)
10.1 Global Energy Management Systems Revenue (USD Million) and Market Share (%) by Type (2023-2030)
10.1.1 Global Energy Management Systems Revenue (USD Million), and Market Share (%) by Type (2023-2030)
10.2 Global Energy Management Systems Revenue (USD Million) and Market Share (%) by Applications (2023-2030)
10.2.1 Global Energy Management Systems Revenue (USD Million), and Market Share (%) by Applications (2023-2030)
11 Global Energy Management Systems Development Regional Status and Outlook Forecast
11.1 Global Energy Management Systems Revenue (USD Million) By Regions (2023-2030)
11.2 North America Energy Management Systems Revenue (USD Million) by Type, and Applications (2023-2030)
11.2.1 North America Energy Management Systems Revenue (USD) Million by Country (2023-2030)
11.2.2 North America Energy Management Systems Revenue (USD Million), by Type (2023-2030)
11.2.3 North America Energy Management Systems Revenue (USD Million), Market Share (%) by Applications (2023-2030)
11.3 Europe Energy Management Systems Revenue (USD Million), by Type, and Applications (2023-2030)
11.3.1 Europe Energy Management Systems Revenue (USD Million), by Country (2023-2030)
11.3.2 Europe Energy Management Systems Revenue (USD Million), by Type (2023-2030)
11.3.3 Europe Energy Management Systems Revenue (USD Million), by Applications (2023-2030)
11.4 Asia Pacific Energy Management Systems Revenue (USD Million) by Type, and Applications (2023-2030)
11.4.1 Asia Pacific Energy Management Systems Revenue (USD Million), by Country (2023-2030)
11.4.2 Asia Pacific Energy Management Systems Revenue (USD Million), by Type (2023-2030)
11.4.3 Asia Pacific Energy Management Systems Revenue (USD Million), by Applications (2023-2030)
11.5 South America Energy Management Systems Revenue (USD Million), by Type, and Applications (2023-2030)
11.5.1 South America Energy Management Systems Revenue (USD Million), by Country (2023-2030)
11.5.2 South America Energy Management Systems Revenue (USD Million), by Type (2023-2030)
11.5.3 South America Energy Management Systems Revenue (USD Million), by Applications (2023-2030)
11.6 Middle East and Africa Energy Management Systems Revenue (USD Million), by Type, and Applications (2023-2030)
11.6.1 Middle East and Africa Energy Management Systems Revenue (USD Million), by Region (2023-2030)
11.6.2 Middle East and Africa Energy Management Systems Revenue (USD Million), by Type (2023-2030)
11.6.3 Middle East and Africa Energy Management Systems Revenue (USD Million), by Applications (2023-2030)
12 Methodology and Data Sources
12.1 Methodology/Research Approach
12.1.1 Research Programs/Design
12.1.2 Market Size Estimation
12.1.3 Market Breakdown and Data Triangulation
12.2 Data Sources
12.2.1 Secondary Sources
12.2.2 Primary Sources
12.3 Disclaimer
List Of Tables
Table 1 Market Segmentation Analysis
Table 2 Global Energy Management Systems Market Companies with Areas Served
Table 3 Products Offerings Global Energy Management Systems Market
Table 4 Low Growth Scenario Forecasts
Table 5 Reference Case Growth Scenario
Table 6 High Growth Case Scenario
Table 7 Global Energy Management Systems Revenue (USD Million) And CAGR (%) By Type (2018-2030)
Table 8 Global Energy Management Systems Revenue (USD Million) And CAGR (%) By Applications (2018-2030)
Table 9 Global Energy Management Systems Revenue (USD Million) And CAGR (%) By Regions (2018-2030)
Table 10 Global Energy Management Systems Revenue (USD Million) By Type (2018-2022)
Table 11 Global Energy Management Systems Revenue Market Share (%) By Type (2018-2022)
Table 12 Global Energy Management Systems Revenue (USD Million) By Applications (2018-2022)
Table 13 Global Energy Management Systems Revenue Market Share (%) By Applications (2018-2022)
Table 14 Global Energy Management Systems Market Revenue (USD Million) By Regions (2018-2022)
Table 15 Global Energy Management Systems Market Share (%) By Regions (2018-2022)
Table 16 North America Energy Management Systems Revenue (USD Million) By Country (2018-2022)
Table 17 North America Energy Management Systems Revenue (USD Million) By Type (2018-2022)
Table 18 North America Energy Management Systems Revenue (USD Million) By Applications (2018-2022)
Table 19 Europe Energy Management Systems Revenue (USD Million) By Country (2018-2022)
Table 20 Europe Energy Management Systems Revenue (USD Million) By Type (2018-2022)
Table 21 Europe Energy Management Systems Revenue (USD Million) By Applications (2018-2022)
Table 22 Asia Pacific Energy Management Systems Revenue (USD Million) By Country (2018-2022)
Table 23 Asia Pacific Energy Management Systems Revenue (USD Million) By Type (2018-2022)
Table 24 Asia Pacific Energy Management Systems Revenue (USD Million) By Applications (2018-2022)
Table 25 South America Energy Management Systems Revenue (USD Million) By Country (2018-2022)
Table 26 South America Energy Management Systems Revenue (USD Million) By Type (2018-2022)
Table 27 South America Energy Management Systems Revenue (USD Million) By Applications (2018-2022)
Table 28 Middle East and Africa Energy Management Systems Revenue (USD Million) By Region (2018-2022)
Table 29 Middle East and Africa Energy Management Systems Revenue (USD Million) By Type (2018-2022)
Table 30 Middle East and Africa Energy Management Systems Revenue (USD Million) By Applications (2018-2022)
Table 31 Financial Analysis
Table 32 Global Energy Management Systems Revenue (USD Million) By Type (2023-2030)
Table 33 Global Energy Management Systems Revenue Market Share (%) By Type (2023-2030)
Table 34 Global Energy Management Systems Revenue (USD Million) By Applications (2023-2030)
Table 35 Global Energy Management Systems Revenue Market Share (%) By Applications (2023-2030)
Table 36 Global Energy Management Systems Market Revenue (USD Million), And Revenue (USD Million) By Regions (2023-2030)
Table 37 North America Energy Management Systems Revenue (USD)By Country (2023-2030)
Table 38 North America Energy Management Systems Revenue (USD Million) By Type (2023-2030)
Table 39 North America Energy Management Systems Revenue (USD Million) By Applications (2023-2030)
Table 40 Europe Energy Management Systems Revenue (USD Million) By Country (2023-2030)
Table 41 Europe Energy Management Systems Revenue (USD Million) By Type (2023-2030)
Table 42 Europe Energy Management Systems Revenue (USD Million) By Applications (2023-2030)
Table 43 Asia Pacific Energy Management Systems Revenue (USD Million) By Country (2023-2030)
Table 44 Asia Pacific Energy Management Systems Revenue (USD Million) By Type (2023-2030)
Table 45 Asia Pacific Energy Management Systems Revenue (USD Million) By Applications (2023-2030)
Table 46 South America Energy Management Systems Revenue (USD Million) By Country (2023-2030)
Table 47 South America Energy Management Systems Revenue (USD Million) By Type (2023-2030)
Table 48 South America Energy Management Systems Revenue (USD Million) By Applications (2023-2030)
Table 49 Middle East and Africa Energy Management Systems Revenue (USD Million) By Region (2023-2030)
Table 50 Middle East and Africa Energy Management Systems Revenue (USD Million) By Region (2023-2030)
Table 51 Middle East and Africa Energy Management Systems Revenue (USD Million) By Type (2023-2030)
Table 52 Middle East and Africa Energy Management Systems Revenue (USD Million) By Applications (2023-2030)
Table 53 Research Programs/Design for This Report
Table 54 Key Data Information from Secondary Sources
Table 55 Key Data Information from Primary Sources
List Of Figures
Figure 1 Market Scope
Figure 2 Porter’s Five Forces
Figure 3 Global Energy Management Systems Revenue (USD Million) By Type (2018-2022)
Figure 4 Global Energy Management Systems Revenue Market Share (%) By Type (2022)
Figure 5 Global Energy Management Systems Revenue (USD Million) By Applications (2018-2022)
Figure 6 Global Energy Management Systems Revenue Market Share (%) By Applications (2022)
Figure 7 Global Energy Management Systems Market Revenue (USD Million) By Regions (2018-2022)
Figure 8 Global Energy Management Systems Market Share (%) By Regions (2022)
Figure 9 North America Energy Management Systems Revenue (USD Million) By Country (2018-2022)
Figure 10 North America Energy Management Systems Revenue (USD Million) By Type (2018-2022)
Figure 11 North America Energy Management Systems Revenue (USD Million) By Applications (2018-2022)
Figure 12 Europe Energy Management Systems Revenue (USD Million) By Country (2018-2022)
Figure 13 Europe Energy Management Systems Revenue (USD Million) By Type (2018-2022)
Figure 14 Europe Energy Management Systems Revenue (USD Million) By Applications (2018-2022)
Figure 15 Asia Pacific Energy Management Systems Revenue (USD Million) By Country (2018-2022)
Figure 16 Asia Pacific Energy Management Systems Revenue (USD Million) By Type (2018-2022)
Figure 17 Asia Pacific Energy Management Systems Revenue (USD Million) By Applications (2018-2022)
Figure 18 South America Energy Management Systems Revenue (USD Million) By Country (2018-2022)
Figure 19 South America Energy Management Systems Revenue (USD Million) By Type (2018-2022)
Figure 20 South America Energy Management Systems Revenue (USD Million) By Applications (2018-2022)
Figure 21 Middle East and Africa Energy Management Systems Revenue (USD Million) By Region (2018-2022)
Figure 22 Middle East and Africa Energy Management Systems Revenue (USD Million) By Type (2018-2022)
Figure 23 Middle East and Africa Energy Management Systems Revenue (USD Million) By Applications (2018-2022)
Figure 24 Global Energy Management Systems Revenue (USD Million) By Type (2023-2030)
Figure 25 Global Energy Management Systems Revenue Market Share (%) By Type (2030)
Figure 26 Global Energy Management Systems Revenue (USD Million) By Applications (2023-2030)
Figure 27 Global Energy Management Systems Revenue Market Share (%) By Applications (2030)
Figure 28 Global Energy Management Systems Market Revenue (USD Million) By Regions (2023-2030)
Figure 29 North America Energy Management Systems Revenue (USD Million) By Country (2023-2030)
Figure 30 North America Energy Management Systems Revenue (USD Million) By Type (2023-2030)
Figure 31 North America Energy Management Systems Revenue (USD Million) By Applications (2023-2030)
Figure 32 Europe Energy Management Systems Revenue (USD Million) By Country (2023-2030)
Figure 33 Europe Energy Management Systems Revenue (USD Million) By Type (2023-2030)
Figure 34 Europe Energy Management Systems Revenue (USD Million) By Applications (2023-2030)
Figure 35 Asia Pacific Energy Management Systems Revenue (USD Million) By Country (2023-2030)
Figure 36 Asia Pacific Energy Management Systems Revenue (USD Million) By Type (2023-2030)
Figure 37 Asia Pacific Energy Management Systems Revenue (USD Million) By Applications (2023-2030)
Figure 38 South America Energy Management Systems Revenue (USD Million) By Country (2023-2030)
Figure 39 South America Energy Management Systems Revenue (USD Million) By Type (2023-2030)
Figure 40 South America Energy Management Systems Revenue (USD Million) By Applications (2023-2030)
Figure 41 Middle East and Africa Energy Management Systems Revenue (USD Million) By Region (2023-2030)
Figure 42 Middle East and Africa Energy Management Systems Revenue (USD Million) By Region (2023-2030)
Figure 43 Middle East and Africa Energy Management Systems Revenue (USD Million) By Type (2023-2030)
Figure 44 Middle East and Africa Energy Management Systems Revenue (USD Million) By Applications (2023-2030)
Figure 45 Bottom-Up and Top-Down Approaches For This Report
Figure 46 Data Triangulation
