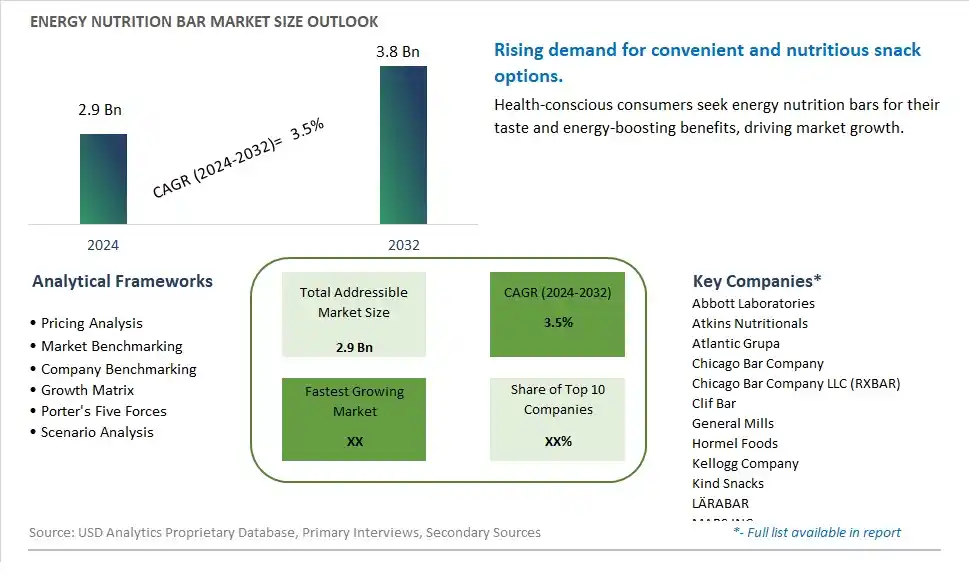
Global Energy Nutrition Bar Market Size is valued at $2.9 Billion in 2024 and is forecast to register a growth rate (CAGR) of 3.5% to reach $3.8 Billion by 2032.
The global Energy Nutrition Bar Market Comprehensive Study analyzes and forecasts the market size across 6 regions and 24 countries for diverse segments -By Type (Cereal Bar, Nut Bar, Protein Bar), By Application (Supermarkets/hypermarkets, Convenience Stores, Online Store, Others)
An Introduction to Energy Nutrition Bar Market
The Energy Nutrition Bar market in 2024 is thriving, fueled by the rising demand for convenient and nutritious on-the-go snacks. Energy nutrition bars, known for their balanced macronutrient profiles and energy-boosting ingredients, are popular among athletes, busy professionals, and health-conscious consumers. The market benefits from advancements in bar formulation and packaging technologies, the growing trend of health and wellness, and the expansion of the functional and sports nutrition sectors. Additionally, the increasing popularity of clean label and natural ingredients in energy bars is driving market growth.
Energy Nutrition Bar Competitive Landscape
The market report analyses the leading companies in the industry including Abbott Laboratories, Atkins Nutritionals, Atlantic Grupa, Chicago Bar Company, Chicago Bar Company LLC (RXBAR), Clif Bar, General Mills, Hormel Foods, Kellogg Company, Kind Snacks, LÄRABAR, MARS INC, NuGo Nutrition, Picky Bars, Power Crunch, Prinsen Berning, ProBar, Quest Nutrition, The Balance Bar, VSI, and Others.
Energy Nutrition Bar Market Dynamics
Energy Nutrition Bar Market Trend: Demand for Healthier and Functional Snacking Options
The market for energy nutrition bars is experiencing a prominent trend towards the demand for healthier and functional snacking options. Consumers are increasingly seeking convenient snacks that not only provide energy but also offer nutritional benefits such as protein, fiber, vitamins, and minerals. Energy nutrition bars cater to this trend by offering a balanced combination of macronutrients and micronutrients in a convenient, on-the-go format, appealing to health-conscious individuals looking for satisfying and nutritious snack choices.
Energy Nutrition Bar Market Driver: Busy Lifestyles and Active On-the-Go Consumption
A major driver for the energy nutrition bar market is busy lifestyles and the demand for active, on-the-go consumption. With hectic schedules, work demands, and physical activities, consumers prefer snacks that are convenient, portable, and can be consumed quickly to fuel their energy needs. Energy nutrition bars provide a convenient and satiating option for consumers to maintain energy levels, curb hunger between meals, and support their active lifestyles, driving the growth of the market for convenient and functional snack solutions.
Energy Nutrition Bar Market Opportunity: Innovation in Flavor Profiles and Functional Ingredients
The energy nutrition bar market presents a significant opportunity for innovation in flavor profiles and functional ingredients. Companies specializing in snack bars and nutrition products can develop energy bars with unique flavor combinations, textures, and sensory experiences to cater to diverse consumer preferences and taste preferences. Additionally, incorporating functional ingredients such as superfoods, probiotics, prebiotics, antioxidants, and adaptogens into energy bars can enhance their nutritional value and appeal to health-conscious consumers seeking specific health benefits from their snacks. Exploring new formulations, clean label ingredients, and sustainable packaging solutions can further differentiate energy nutrition bars in the competitive snack market, creating opportunities for market expansion and consumer loyalty.
Energy Nutrition Bar Market Share Analysis: Cereal Bar segment generated the highest revenue share in the industry
The largest segment in the Energy Nutrition Bar Market is the Cereal Bar category. Cereal bars are immensely popular due to their convenience, portability, and nutritional benefits, making them a go-to choice for consumers seeking a quick energy boost or a healthy snack option. These bars contain a blend of grains, cereals, fruits, nuts, and sometimes chocolate or other flavorings, providing a balanced mix of carbohydrates, proteins, and fats. The widespread appeal of cereal bars lies in their versatility, catering to a broad spectrum of consumers ranging from athletes and fitness enthusiasts to busy professionals and on-the-go individuals. The market for cereal bars continues to expand rapidly, driven by the growing health consciousness among consumers, increased demand for convenient and nutritious snack options, and ongoing product innovations such as gluten-free, organic, and low-sugar variants. Manufacturers are focusing on developing new flavors, incorporating functional ingredients, and enhancing the nutritional profiles of cereal bars to meet the diverse preferences and dietary needs of modern consumers.
Energy Nutrition Bar Market Share Analysis: Online Stores is the fastest growing segment over the forecast period to 2032
The fastest-growing segment in the Energy Nutrition Bar Market is the Online Stores category. With the increasing prevalence of e-commerce platforms and the growing trend of online shopping, consumers are increasingly turning to online channels to purchase their favorite energy nutrition bars. The convenience, accessibility, and wide variety of options available on online stores make them highly attractive to consumers looking for quick and hassle-free shopping experiences. Online platforms also provide detailed product information, customer reviews, and personalized recommendations, enhancing the overall shopping experience for energy nutrition bar consumers. Further, the Past few yearshas further accelerated the shift towards online shopping, as consumers prioritize safety and contactless transactions. As a result, the online sales of energy nutrition bars are expected to witness robust growth, driven by factors such as convenience, wider product assortment, promotional offers, and seamless delivery options provided by e-commerce platforms.
Energy Nutrition Bar Market Segmentation
By Type
Cereal Bar
Nut Bar
Protein Bar
By Application
Supermarkets/hypermarkets
Convenience Stores
Online Store
Others
Countries Analyzed
North America (US, Canada, Mexico)
Europe (Germany, UK, France, Spain, Italy, Russia, Rest of Europe)
Asia Pacific (China, India, Japan, South Korea, Australia, South East Asia, Rest of Asia)
South America (Brazil, Argentina, Rest of South America)
Middle East and Africa (Saudi Arabia, UAE, Rest of Middle East, South Africa, Egypt, Rest of Africa)
Energy Nutrition Bar Companies Profiled in the Study
Abbott Laboratories
Atkins Nutritionals
Atlantic Grupa
Chicago Bar Company
Chicago Bar Company LLC (RXBAR)
Clif Bar
General Mills
Hormel Foods
Kellogg Company
Kind Snacks
LÄRABAR
MARS INC
NuGo Nutrition
Picky Bars
Power Crunch
Prinsen Berning
ProBar
Quest Nutrition
The Balance Bar
VSI
*- List Not Exhaustive
Chapter 1. TABLE OF CONTENTS
Chapter 2. Introduction to Energy Nutrition Bar Market
2.1. Market Overview
2.2. Key Statistics and Report Highlights
2.3. Scope of the Comprehensive Study
2.3.1. Market Definition
2.3.2 Countries and Regions Covered
2.3.3 Research Objective
2.3.4 Units, Currency, and Conversions
2.3.5 Industry Value Chain
2.4. Key Market Segments
2.5. Key Companies
2.6. Study Period
Chapter 3. Strategic Analysis Review
3.1. Energy Nutrition Bar Pricing Analysis and Forecast
3.2. Porter’s Five Forces
3.3. Market Ecosystem
3.4. SWOT Analysis
3.5. Regulatory Scenario
3.3. Effects of Inflation, Russia-Ukraine War, moderating economic growth, and other macroeconomic factors
Chapter 4. Competitive Landscape
4.1. Market Share Analysis
4.1.1. Global Energy Nutrition Bar Market Share by Company, 2023
4.1.2. Product Offerings of Leading Energy Nutrition Bar Companies
4.2. Market Entropy
4.2.1. New Product Launches in the Industry
4.2.2. Mergers, Acquisitions, Joint ventures, and Partnerships
4.3. Key Strategies and Best Practices
Chapter 5. Global Market Projections: Best, Reference, and Low Case Scenarios
5.1. Growth Analysis- Case Scenario Definitions
5.2. Low Growth Case Scenario Forecasts
5.3. Reference Growth Case Scenario Forecasts
5.4. High Growth Case Scenario Forecasts
Chapter 6. Market Dynamics
6.1. Energy Nutrition Bar Market Drivers
6.2. Energy Nutrition Bar Market Challenges
6.6. Energy Nutrition Bar Market Opportunities
6.4. Energy Nutrition Bar Market Trends
Chapter 7. Global Energy Nutrition Bar Market Outlook Trends
7.1. Global Energy Nutrition Bar Revenue (USD Million) and CAGR (%) by Type (2021-2032)
7.2. Global Energy Nutrition Bar Revenue (USD Million) and CAGR (%) by Application (2021-2032)
7.3. Global Energy Nutrition Bar Revenue (USD Million) and CAGR (%) by Product (2021-2032)
By Type
Cereal Bar
Nut Bar
Protein Bar
By Application
Supermarkets/hypermarkets
Convenience Stores
Online Store
Others
Chapter 8. Global Energy Nutrition Bar Regional Analysis and Outlook
8.1. Global Energy Nutrition Bar Revenue (USD Million) By Regions (2021- 2032)
8.2. North America Energy Nutrition Bar Revenue (USD Million) by Country (2021-2032)
8.2.1. United States Energy Nutrition Bar Regional Analysis and Outlook
8.2.2. Canada Energy Nutrition Bar Regional Analysis and Outlook
8.2.3. Mexico Energy Nutrition Bar Regional Analysis and Outlook
8.3. Europe Energy Nutrition Bar Revenue (USD Million), by Country (2021-2032)
8.3.1. Germany Energy Nutrition Bar Regional Analysis and Outlook
8.3.2. France Energy Nutrition Bar Regional Analysis and Outlook
8.3.3. United Kingdom Energy Nutrition Bar Regional Analysis and Outlook
8.3.4. Spain Energy Nutrition Bar Regional Analysis and Outlook
8.3.5. Italy Energy Nutrition Bar Regional Analysis and Outlook
8.3.6. Russia Energy Nutrition Bar Regional Analysis and Outlook
8.3.7. Rest of Europe Energy Nutrition Bar Regional Analysis and Outlook
8.4. Asia Pacific Energy Nutrition Bar Revenue (USD Million) by Country (2021-2032)
8.4.1. China Energy Nutrition Bar Regional Analysis and Outlook
8.4.2. Japan Energy Nutrition Bar Regional Analysis and Outlook
8.4.3. India Energy Nutrition Bar Regional Analysis and Outlook
8.4.4. South Korea Energy Nutrition Bar Regional Analysis and Outlook
8.4.5. Australia Energy Nutrition Bar Regional Analysis and Outlook
8.4.6. South East Asia Energy Nutrition Bar Regional Analysis and Outlook
8.4.7. Rest of Asia Pacific Energy Nutrition Bar Regional Analysis and Outlook
8.5. South America Energy Nutrition Bar Revenue (USD Million), by Country (2021-2032)
8.5.1. Brazil Energy Nutrition Bar Regional Analysis and Outlook
8.5.2. Argentina Energy Nutrition Bar Regional Analysis and Outlook
8.5.3. Rest of South America Energy Nutrition Bar Regional Analysis and Outlook
8.6. Middle East and Africa Energy Nutrition Bar Revenue (USD Million) by Country (2021-2032)
8.6.1. Middle East Energy Nutrition Bar Regional Analysis and Outlook
8.6.2. Africa Energy Nutrition Bar Regional Analysis and Outlook
Chapter 9. North America Energy Nutrition Bar Analysis and Outlook
9.1. North America Energy Nutrition Bar Revenue (USD Million) by Segments (2021-2032)
9.1.1. North America Energy Nutrition Bar Revenue (USD Million) by Type (2021-2032)
9.1.2. North America Energy Nutrition Bar Revenue (USD Million) by Application (2021-2032)
9.1.3. North America Energy Nutrition Bar Revenue (USD Million) by Product (2021-2032)
By Type
Cereal Bar
Nut Bar
Protein Bar
By Application
Supermarkets/hypermarkets
Convenience Stores
Online Store
Others
Chapter 10. Europe Energy Nutrition Bar Analysis and Outlook
10.1. Europe Energy Nutrition Bar Revenue (USD Million), by Segments (USD Million) (2021-2032)
10.1.1. Europe Energy Nutrition Bar Revenue (USD Million) by Type (2021-2032)
10.1.2. Europe Energy Nutrition Bar Revenue (USD Million) by Application (2021-2032)
10.1.3. Europe Energy Nutrition Bar Revenue (USD Million) by Product (2021-2032)
By Type
Cereal Bar
Nut Bar
Protein Bar
By Application
Supermarkets/hypermarkets
Convenience Stores
Online Store
Others
Chapter 11. Asia Pacific Energy Nutrition Bar Analysis and Outlook
11.1. Asia Pacific Energy Nutrition Bar Revenue (USD Million), and Revenue (USD Million) by Segments (2021-2032)
11.1.1. Asia Pacific Energy Nutrition Bar Revenue (USD Million) by Type (2021-2032)
11.1.2. Asia Pacific Energy Nutrition Bar Revenue (USD Million) by Application (2021-2032)
11.1.3. Asia Pacific Energy Nutrition Bar Revenue (USD Million) by Product (2021-2032)
By Type
Cereal Bar
Nut Bar
Protein Bar
By Application
Supermarkets/hypermarkets
Convenience Stores
Online Store
Others
Chapter 12. South America Energy Nutrition Bar Analysis and Outlook
12.1. South America Energy Nutrition Bar Revenue (USD Million), by Segments (2021-2032)
12.1.1. South America Energy Nutrition Bar Revenue (USD Million) by Type (2021-2032)
12.1.2. South America Energy Nutrition Bar Revenue (USD Million) by Application (2021-2032)
12.1.3. South America Energy Nutrition Bar Revenue (USD Million) by Product (2021-2032)
By Type
Cereal Bar
Nut Bar
Protein Bar
By Application
Supermarkets/hypermarkets
Convenience Stores
Online Store
Others
Chapter 13. Middle East and Africa Energy Nutrition Bar Analysis and Outlook
13.1. Middle East and Africa Energy Nutrition Bar Revenue (USD Million), by Segments (2021-2032)
13.1.1. Middle East and Africa Energy Nutrition Bar Revenue (USD Million) by Type (2021-2032)
13.1.2. Middle East and Africa Energy Nutrition Bar Revenue (USD Million) by Application (2021-2032)
13.1.3. Middle East and Africa Energy Nutrition Bar Revenue (USD Million) by Product (2021-2032)
By Type
Cereal Bar
Nut Bar
Protein Bar
By Application
Supermarkets/hypermarkets
Convenience Stores
Online Store
Others
Chapter 14. Energy Nutrition Bar Company Profiles
14.1 Business Overview
14.2 Product Profiles
14.3 SWOT Profiles
14.5 Recent Developments
14.6 Financial Profile
List of Companies
Abbott Laboratories
Atkins Nutritionals
Atlantic Grupa
Chicago Bar Company
Chicago Bar Company LLC (RXBAR)
Clif Bar
General Mills
Hormel Foods
Kellogg Company
Kind Snacks
LÄRABAR
MARS INC
NuGo Nutrition
Picky Bars
Power Crunch
Prinsen Berning
ProBar
Quest Nutrition
The Balance Bar
VSI
15. Methodology and Data Sources
15.1 Customization Offerings
15.2 Subscription Services
15.3 Related Reports
15.4 Publisher Expertise
LIST OF TABLES
Table 1 Market Segmentation Analysis
Table 2 Global Energy Nutrition Bar Market Share of Leading Companies, 2023
Table 3 Product Offerings of Leading Companies
Table 4 Low Growth Scenario Forecasts
Table 5 Reference Case Growth Scenario
Table 6 High Growth Case Scenario
Table 7 Global Energy Nutrition Bar Revenue (USD Million) And CAGR (%) By Type (2021-2032)
Table 8 Global Energy Nutrition Bar Revenue (USD Million) And CAGR (%) By Application (2021-2032)
Table 9 Global Energy Nutrition Bar Revenue (USD Million) And CAGR (%) By Product (2021-2032)
Table 10 Global Energy Nutrition Bar Market Revenue (USD Million) By Regions (2021-2032)
Table 11 Global Energy Nutrition Bar Market Share (%) By Regions (2021-2032)
Table 12 North America Energy Nutrition Bar Revenue (USD Million) By Country (2021-2032)
Table 13 Europe Energy Nutrition Bar Revenue (USD Million) By Country (2021-2032)
Table 14 Asia Pacific Energy Nutrition Bar Revenue (USD Million) By Country (2021-2032)
Table 15 South America Energy Nutrition Bar Revenue (USD Million) By Country (2021-2032)
Table 16 Middle East and Africa Energy Nutrition Bar Revenue (USD Million) By Region (2021-2032)
Table 17 North America Energy Nutrition Bar Revenue (USD Million) By Type (2021-2032)
Table 18 North America Energy Nutrition Bar Revenue (USD Million) By Application (2021-2032)
Table 19 North America Energy Nutrition Bar Revenue (USD Million) By Product (2021-2032)
Table 20 Europe Energy Nutrition Bar Revenue (USD Million) By Type (2021-2032)
Table 21 Europe Energy Nutrition Bar Revenue (USD Million) By Application (2021-2032)
Table 22 Europe Energy Nutrition Bar Revenue (USD Million) By Product (2021-2032)
Table 23 Asia Pacific Energy Nutrition Bar Revenue (USD Million) By Type (2021-2032)
Table 24 Asia Pacific Energy Nutrition Bar Revenue (USD Million) By Application (2021-2032)
Table 25 Asia Pacific Energy Nutrition Bar Revenue (USD Million) By Product (2021-2032)
Table 26 South America Energy Nutrition Bar Revenue (USD Million) By Type (2021-2032)
Table 27 South America Energy Nutrition Bar Revenue (USD Million) By Application (2021-2032)
Table 28 South America Energy Nutrition Bar Revenue (USD Million) By Product (2021-2032)
Table 29 Middle East and Africa Energy Nutrition Bar Revenue (USD Million) By Type (2021-2032)
Table 30 Middle East and Africa Energy Nutrition Bar Revenue (USD Million) By Application (2021-2032)
Table 31 Middle East and Africa Energy Nutrition Bar Revenue (USD Million) By Product (2021-2032)
LIST OF FIGURES
Figure 1. Market Scope
Figure 2. Pricing Forecasts Per Unit, 2023- 2032
Figure 3. Porter’s Five Forces
Figure 4. Global Energy Nutrition Bar Market Revenue (USD Million) By Regions (2021-2032)
Figure 5. Global Energy Nutrition Bar Market Share (%) By Regions (2023)
Figure 6. North America Energy Nutrition Bar Revenue (USD Million) By Country (2021-2032)
Figure 7. United States Energy Nutrition Bar Revenue (USD Million) By Country (2021-2032)
Figure 8. Canada Energy Nutrition Bar Revenue (USD Million) By Country (2021-2032)
Figure 9. Mexico Energy Nutrition Bar Revenue (USD Million) By Country (2021-2032)
Figure 10. Europe Energy Nutrition Bar Revenue (USD Million) By Country (2021-2032)
Figure 11. Germany Energy Nutrition Bar Revenue (USD Million) By Country (2021-2032)
Figure 12. France Energy Nutrition Bar Revenue (USD Million) By Country (2021-2032)
Figure 13. United Kingdom Energy Nutrition Bar Revenue (USD Million) By Country (2021-2032)
Figure 14. Spain Energy Nutrition Bar Revenue (USD Million) By Country (2021-2032)
Figure 15. Italy Energy Nutrition Bar Revenue (USD Million) By Country (2021-2032)
Figure 16. Russia Energy Nutrition Bar Revenue (USD Million) By Country (2021-2032)
Figure 17. Rest of Europe Energy Nutrition Bar Revenue (USD Million) By Country (2021-2032)
Figure 11. Asia Pacific Energy Nutrition Bar Revenue (USD Million) By Country (2021-2032)
Figure 12. China Energy Nutrition Bar Revenue (USD Million) By Country (2021-2032)
Figure 13. Japan Energy Nutrition Bar Revenue (USD Million) By Country (2021-2032)
Figure 14. India Energy Nutrition Bar Revenue (USD Million) By Country (2021-2032)
Figure 15. South Korea Energy Nutrition Bar Revenue (USD Million) By Country (2021-2032)
Figure 16. Australia Energy Nutrition Bar Revenue (USD Million) By Country (2021-2032)
Figure 17. South East Asia Energy Nutrition Bar Revenue (USD Million) By Country (2021-2032)
Figure 18. South America Energy Nutrition Bar Revenue (USD Million) By Country (2021-2032)
Figure 19. Brazil Energy Nutrition Bar Revenue (USD Million) By Country (2021-2032)
Figure 20. Argentina Energy Nutrition Bar Revenue (USD Million) By Country (2021-2032)
Figure 21. Rest of Asia Pacific Energy Nutrition Bar Revenue (USD Million) By Country (2021-2032)
Figure 22. Middle East and Africa Energy Nutrition Bar Revenue (USD Million) By Region (2021-2032)
Figure 23. Saudi Arabia Energy Nutrition Bar Revenue (USD Million) By Region (2021-2032)
Figure 24. The UAE Energy Nutrition Bar Revenue (USD Million) By Region (2021-2032)
Figure 25. Rest of Middle East Energy Nutrition Bar Revenue (USD Million) By Region (2021-2032)
Figure 26. South Africa Energy Nutrition Bar Revenue (USD Million) By Region (2021-2032)
Figure 27. Africa Energy Nutrition Bar Revenue (USD Million) By Region (2021-2032)
Figure 28. North America Energy Nutrition Bar Revenue (USD Million) By Type (2021-2032)
Figure 29. North America Energy Nutrition Bar Revenue (USD Million) By Application (2021-2032)
Figure 30. North America Energy Nutrition Bar Revenue (USD Million) By Product (2021-2032)
Figure 31. Europe Energy Nutrition Bar Revenue (USD Million) By Type (2021-2032)
Figure 32. Europe Energy Nutrition Bar Revenue (USD Million) By Application (2021-2032)
Figure 33. Europe Energy Nutrition Bar Revenue (USD Million) By Product (2021-2032)
Figure 34. Asia Pacific Energy Nutrition Bar Revenue (USD Million) By Type (2021-2032)
Figure 35. Asia Pacific Energy Nutrition Bar Revenue (USD Million) By Application (2021-2032)
Figure 36. Asia Pacific Energy Nutrition Bar Revenue (USD Million) By Product (2021-2032)
Figure 37. South America Energy Nutrition Bar Revenue (USD Million) By Type (2021-2032)
Figure 38. South America Energy Nutrition Bar Revenue (USD Million) By Application (2021-2032)
Figure 39. South America Energy Nutrition Bar Revenue (USD Million) By Product (2021-2032)
Figure 40. Middle East and Africa Energy Nutrition Bar Revenue (USD Million) By Type (2021-2032)
Figure 41. Middle East and Africa Energy Nutrition Bar Revenue (USD Million) By Application (2021-2032)
Figure 42. Middle East and Africa Energy Nutrition Bar Revenue (USD Million) By Product (2021-2032)
By Type
Cereal Bar
Nut Bar
Protein Bar
By Application
Supermarkets/hypermarkets
Convenience Stores
Online Store
Others
Countries Analyzed
North America (US, Canada, Mexico)
Europe (Germany, UK, France, Spain, Italy, Russia, Rest of Europe)
Asia Pacific (China, India, Japan, South Korea, Australia, South East Asia, Rest of Asia)
South America (Brazil, Argentina, Rest of South America)
Middle East and Africa (Saudi Arabia, UAE, Rest of Middle East, South Africa, Egypt, Rest of Africa)
