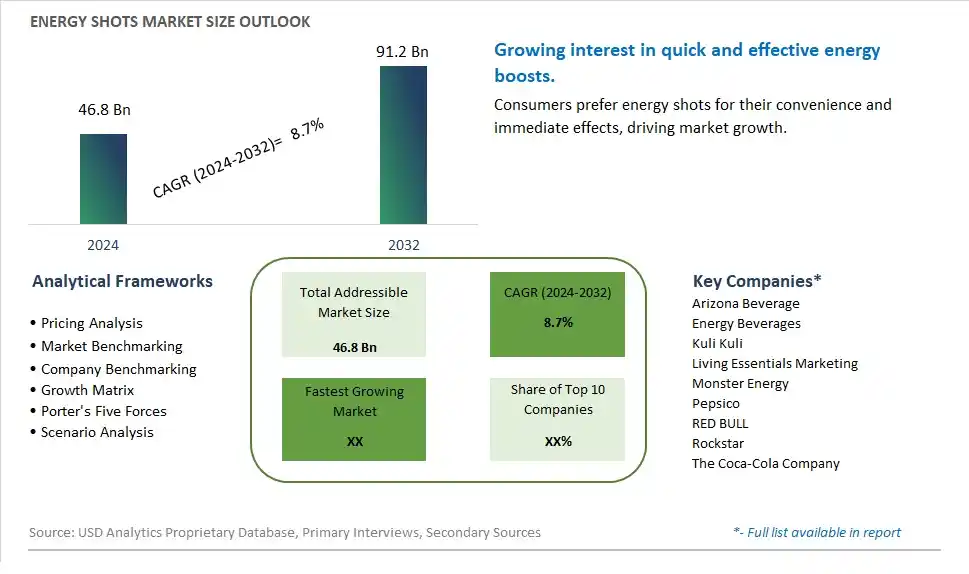
Global Energy Shots Market Size is valued at $46.8 Billion in 2024 and is forecast to register a growth rate (CAGR) of 8.7% to reach $91.2 Billion by 2032.
The global Energy Shots Market Comprehensive Study analyzes and forecasts the market size across 6 regions and 24 countries for diverse segments -By Type (Cherry Flavor, Grape Flavor, Others), By Application (Hypermarkets/Supermarkets, Convenience Stores, Departmental Stores, Online Stores, Others)
An Introduction to Energy Shots Market
In 2024, the Energy Shots market is experiencing robust growth, driven by the rising demand for quick and portable energy-boosting solutions. Energy shots, known for their concentrated formula and convenience, are popular among busy professionals, students, and fitness enthusiasts. The market benefits from advancements in formulation and packaging technologies, the growing trend of health and wellness, and the expansion of the functional beverage sector. Additionally, the increasing focus on natural and clean label ingredients in energy shots is contributing to market growth.
Energy Shots Competitive Landscape
The market report analyses the leading companies in the industry including Arizona Beverage, Energy Beverages, Kuli Kuli, Living Essentials Marketing, Monster Energy, Pepsico, RED BULL, Rockstar, The Coca-Cola Company, and Others.
Energy Shots Market Dynamics
Energy Shots Market Trend: Rise in Demand for Quick and Convenient Energy Boosts
The market for energy shots is experiencing a prominent trend towards the rise in demand for quick and convenient energy boosts. Consumers, particularly those with busy lifestyles or engaged in physical activities, seek instant and portable energy solutions that can provide a rapid boost of alertness, focus, and stamina. Energy shots fulfill this need by offering a concentrated dose of caffeine, B-vitamins, and other energy-boosting ingredients in a small, single-serving format, appealing to individuals looking for immediate energy replenishment on-the-go.
Energy Shots Market Driver: Increased Focus on Mental and Physical Performance Enhancement
A major driver for the energy shots market is the increased focus on mental and physical performance enhancement. Athletes, students, professionals, and individuals in high-demand roles rely on energy shots to improve cognitive function, increase alertness, enhance endurance, and combat fatigue during intense activities or long hours. The drive for improved productivity, concentration, and energy levels drives the demand for energy shots as a convenient and effective solution to support mental and physical performance goals.
Energy Shots Market Opportunity: Diversification of Formulations and Targeted Consumer Segments
The energy shots market presents a significant opportunity for diversification of formulations and targeting specific consumer segments. Companies specializing in energy supplements can innovate by developing energy shots with customized formulations to meet the needs of different consumer groups, such as athletes, gamers, travelers, night-shift workers, and health-conscious individuals. This opportunity includes exploring new ingredients, flavors, and functionalities in energy shots, such as natural caffeine sources, nootropic ingredients, adaptogens, electrolytes, and stress-relieving compounds, to cater to specific performance goals, preferences, and occasions. Additionally, expanding distribution channels, partnerships with retailers, and marketing strategies can help reach untapped market segments and drive growth in the energy shots market.
Energy Shots Market Share Analysis: Cherry Flavor segment generated the highest revenue share in the industry
Among the segments in the Energy Shots Market, the largest segment is Cherry Flavor. Cherry-flavored energy shots have gained significant popularity due to their appealing taste and perceived health benefits. The cherry flavor offers a refreshing and pleasant drinking experience, making it a preferred choice among consumers, especially those seeking a quick energy boost. The sweet and tangy taste of cherry appeals to a wide range of consumers, including athletes, students, and professionals leading busy lifestyles. Further, cherry is often associated with antioxidant properties and natural energy enhancement, further driving its demand in the energy shots market. With increasing consumer awareness about the health benefits of natural flavors and ingredients, cherry-flavored energy shots are expected to continue their dominance in the market. Additionally, product innovation and marketing strategies focusing on the unique attributes of cherry flavor contribute to its sustained growth and market leadership within the energy shots segment.
Energy Shots Market Share Analysis: Online Stores is the fastest growing segment over the forecast period to 2032
The fastest-growing segment in the Energy Shots Market is Online Stores. With the rapid digitalization and increasing preference for online shopping, the online retail sector has witnessed substantial growth in the energy shots market. Consumers are increasingly turning to online platforms to purchase energy shots due to convenience, wide product selection, and attractive discounts. Online stores offer a seamless shopping experience, allowing consumers to compare prices, read reviews, and access detailed product information before making a purchase. Furthermore, the growing popularity of e-commerce platforms and mobile apps has expanded the reach of energy shot manufacturers to a global audience, driving significant sales growth. Factors such as doorstep delivery, secure payment options, and promotional offers contribute to the accelerated growth of energy shots sales through online channels. As consumers continue to embrace digital shopping experiences, online stores are poised to remain the key driver of growth in the Energy Shots Market through 2032.
Energy Shots Market Segmentation
By Type
Cherry Flavor
Grape Flavor
Others
By Application
Hypermarkets/Supermarkets
Convenience Stores
Departmental Stores
Online Stores
Others
Countries Analyzed
North America (US, Canada, Mexico)
Europe (Germany, UK, France, Spain, Italy, Russia, Rest of Europe)
Asia Pacific (China, India, Japan, South Korea, Australia, South East Asia, Rest of Asia)
South America (Brazil, Argentina, Rest of South America)
Middle East and Africa (Saudi Arabia, UAE, Rest of Middle East, South Africa, Egypt, Rest of Africa)
Energy Shots Companies Profiled in the Study
Arizona Beverage
Energy Beverages
Kuli Kuli
Living Essentials Marketing
Monster Energy
Pepsico
RED BULL
Rockstar
The Coca-Cola Company
*- List Not Exhaustive
Chapter 1. TABLE OF CONTENTS
Chapter 2. Introduction to Energy Shots Market
2.1. Market Overview
2.2. Key Statistics and Report Highlights
2.3. Scope of the Comprehensive Study
2.3.1. Market Definition
2.3.2 Countries and Regions Covered
2.3.3 Research Objective
2.3.4 Units, Currency, and Conversions
2.3.5 Industry Value Chain
2.4. Key Market Segments
2.5. Key Companies
2.6. Study Period
Chapter 3. Strategic Analysis Review
3.1. Energy Shots Pricing Analysis and Forecast
3.2. Porter’s Five Forces
3.3. Market Ecosystem
3.4. SWOT Analysis
3.5. Regulatory Scenario
3.3. Effects of Inflation, Russia-Ukraine War, moderating economic growth, and other macroeconomic factors
Chapter 4. Competitive Landscape
4.1. Market Share Analysis
4.1.1. Global Energy Shots Market Share by Company, 2023
4.1.2. Product Offerings of Leading Energy Shots Companies
4.2. Market Entropy
4.2.1. New Product Launches in the Industry
4.2.2. Mergers, Acquisitions, Joint ventures, and Partnerships
4.3. Key Strategies and Best Practices
Chapter 5. Global Market Projections: Best, Reference, and Low Case Scenarios
5.1. Growth Analysis- Case Scenario Definitions
5.2. Low Growth Case Scenario Forecasts
5.3. Reference Growth Case Scenario Forecasts
5.4. High Growth Case Scenario Forecasts
Chapter 6. Market Dynamics
6.1. Energy Shots Market Drivers
6.2. Energy Shots Market Challenges
6.6. Energy Shots Market Opportunities
6.4. Energy Shots Market Trends
Chapter 7. Global Energy Shots Market Outlook Trends
7.1. Global Energy Shots Revenue (USD Million) and CAGR (%) by Type (2021-2032)
7.2. Global Energy Shots Revenue (USD Million) and CAGR (%) by Application (2021-2032)
7.3. Global Energy Shots Revenue (USD Million) and CAGR (%) by Product (2021-2032)
By Type
Cherry Flavor
Grape Flavor
Others
By Application
Hypermarkets/Supermarkets
Convenience Stores
Departmental Stores
Online Stores
Others
Chapter 8. Global Energy Shots Regional Analysis and Outlook
8.1. Global Energy Shots Revenue (USD Million) By Regions (2021- 2032)
8.2. North America Energy Shots Revenue (USD Million) by Country (2021-2032)
8.2.1. United States Energy Shots Regional Analysis and Outlook
8.2.2. Canada Energy Shots Regional Analysis and Outlook
8.2.3. Mexico Energy Shots Regional Analysis and Outlook
8.3. Europe Energy Shots Revenue (USD Million), by Country (2021-2032)
8.3.1. Germany Energy Shots Regional Analysis and Outlook
8.3.2. France Energy Shots Regional Analysis and Outlook
8.3.3. United Kingdom Energy Shots Regional Analysis and Outlook
8.3.4. Spain Energy Shots Regional Analysis and Outlook
8.3.5. Italy Energy Shots Regional Analysis and Outlook
8.3.6. Russia Energy Shots Regional Analysis and Outlook
8.3.7. Rest of Europe Energy Shots Regional Analysis and Outlook
8.4. Asia Pacific Energy Shots Revenue (USD Million) by Country (2021-2032)
8.4.1. China Energy Shots Regional Analysis and Outlook
8.4.2. Japan Energy Shots Regional Analysis and Outlook
8.4.3. India Energy Shots Regional Analysis and Outlook
8.4.4. South Korea Energy Shots Regional Analysis and Outlook
8.4.5. Australia Energy Shots Regional Analysis and Outlook
8.4.6. South East Asia Energy Shots Regional Analysis and Outlook
8.4.7. Rest of Asia Pacific Energy Shots Regional Analysis and Outlook
8.5. South America Energy Shots Revenue (USD Million), by Country (2021-2032)
8.5.1. Brazil Energy Shots Regional Analysis and Outlook
8.5.2. Argentina Energy Shots Regional Analysis and Outlook
8.5.3. Rest of South America Energy Shots Regional Analysis and Outlook
8.6. Middle East and Africa Energy Shots Revenue (USD Million) by Country (2021-2032)
8.6.1. Middle East Energy Shots Regional Analysis and Outlook
8.6.2. Africa Energy Shots Regional Analysis and Outlook
Chapter 9. North America Energy Shots Analysis and Outlook
9.1. North America Energy Shots Revenue (USD Million) by Segments (2021-2032)
9.1.1. North America Energy Shots Revenue (USD Million) by Type (2021-2032)
9.1.2. North America Energy Shots Revenue (USD Million) by Application (2021-2032)
9.1.3. North America Energy Shots Revenue (USD Million) by Product (2021-2032)
By Type
Cherry Flavor
Grape Flavor
Others
By Application
Hypermarkets/Supermarkets
Convenience Stores
Departmental Stores
Online Stores
Others
Chapter 10. Europe Energy Shots Analysis and Outlook
10.1. Europe Energy Shots Revenue (USD Million), by Segments (USD Million) (2021-2032)
10.1.1. Europe Energy Shots Revenue (USD Million) by Type (2021-2032)
10.1.2. Europe Energy Shots Revenue (USD Million) by Application (2021-2032)
10.1.3. Europe Energy Shots Revenue (USD Million) by Product (2021-2032)
By Type
Cherry Flavor
Grape Flavor
Others
By Application
Hypermarkets/Supermarkets
Convenience Stores
Departmental Stores
Online Stores
Others
Chapter 11. Asia Pacific Energy Shots Analysis and Outlook
11.1. Asia Pacific Energy Shots Revenue (USD Million), and Revenue (USD Million) by Segments (2021-2032)
11.1.1. Asia Pacific Energy Shots Revenue (USD Million) by Type (2021-2032)
11.1.2. Asia Pacific Energy Shots Revenue (USD Million) by Application (2021-2032)
11.1.3. Asia Pacific Energy Shots Revenue (USD Million) by Product (2021-2032)
By Type
Cherry Flavor
Grape Flavor
Others
By Application
Hypermarkets/Supermarkets
Convenience Stores
Departmental Stores
Online Stores
Others
Chapter 12. South America Energy Shots Analysis and Outlook
12.1. South America Energy Shots Revenue (USD Million), by Segments (2021-2032)
12.1.1. South America Energy Shots Revenue (USD Million) by Type (2021-2032)
12.1.2. South America Energy Shots Revenue (USD Million) by Application (2021-2032)
12.1.3. South America Energy Shots Revenue (USD Million) by Product (2021-2032)
By Type
Cherry Flavor
Grape Flavor
Others
By Application
Hypermarkets/Supermarkets
Convenience Stores
Departmental Stores
Online Stores
Others
Chapter 13. Middle East and Africa Energy Shots Analysis and Outlook
13.1. Middle East and Africa Energy Shots Revenue (USD Million), by Segments (2021-2032)
13.1.1. Middle East and Africa Energy Shots Revenue (USD Million) by Type (2021-2032)
13.1.2. Middle East and Africa Energy Shots Revenue (USD Million) by Application (2021-2032)
13.1.3. Middle East and Africa Energy Shots Revenue (USD Million) by Product (2021-2032)
By Type
Cherry Flavor
Grape Flavor
Others
By Application
Hypermarkets/Supermarkets
Convenience Stores
Departmental Stores
Online Stores
Others
Chapter 14. Energy Shots Company Profiles
14.1 Business Overview
14.2 Product Profiles
14.3 SWOT Profiles
14.5 Recent Developments
14.6 Financial Profile
List of Companies
Arizona Beverage
Energy Beverages
Kuli Kuli
Living Essentials Marketing
Monster Energy
Pepsico
RED BULL
Rockstar
The Coca-Cola Company
15. Methodology and Data Sources
15.1 Customization Offerings
15.2 Subscription Services
15.3 Related Reports
15.4 Publisher Expertise
LIST OF TABLES
Table 1 Market Segmentation Analysis
Table 2 Global Energy Shots Market Share of Leading Companies, 2023
Table 3 Product Offerings of Leading Companies
Table 4 Low Growth Scenario Forecasts
Table 5 Reference Case Growth Scenario
Table 6 High Growth Case Scenario
Table 7 Global Energy Shots Revenue (USD Million) And CAGR (%) By Type (2021-2032)
Table 8 Global Energy Shots Revenue (USD Million) And CAGR (%) By Application (2021-2032)
Table 9 Global Energy Shots Revenue (USD Million) And CAGR (%) By Product (2021-2032)
Table 10 Global Energy Shots Market Revenue (USD Million) By Regions (2021-2032)
Table 11 Global Energy Shots Market Share (%) By Regions (2021-2032)
Table 12 North America Energy Shots Revenue (USD Million) By Country (2021-2032)
Table 13 Europe Energy Shots Revenue (USD Million) By Country (2021-2032)
Table 14 Asia Pacific Energy Shots Revenue (USD Million) By Country (2021-2032)
Table 15 South America Energy Shots Revenue (USD Million) By Country (2021-2032)
Table 16 Middle East and Africa Energy Shots Revenue (USD Million) By Region (2021-2032)
Table 17 North America Energy Shots Revenue (USD Million) By Type (2021-2032)
Table 18 North America Energy Shots Revenue (USD Million) By Application (2021-2032)
Table 19 North America Energy Shots Revenue (USD Million) By Product (2021-2032)
Table 20 Europe Energy Shots Revenue (USD Million) By Type (2021-2032)
Table 21 Europe Energy Shots Revenue (USD Million) By Application (2021-2032)
Table 22 Europe Energy Shots Revenue (USD Million) By Product (2021-2032)
Table 23 Asia Pacific Energy Shots Revenue (USD Million) By Type (2021-2032)
Table 24 Asia Pacific Energy Shots Revenue (USD Million) By Application (2021-2032)
Table 25 Asia Pacific Energy Shots Revenue (USD Million) By Product (2021-2032)
Table 26 South America Energy Shots Revenue (USD Million) By Type (2021-2032)
Table 27 South America Energy Shots Revenue (USD Million) By Application (2021-2032)
Table 28 South America Energy Shots Revenue (USD Million) By Product (2021-2032)
Table 29 Middle East and Africa Energy Shots Revenue (USD Million) By Type (2021-2032)
Table 30 Middle East and Africa Energy Shots Revenue (USD Million) By Application (2021-2032)
Table 31 Middle East and Africa Energy Shots Revenue (USD Million) By Product (2021-2032)
LIST OF FIGURES
Figure 1. Market Scope
Figure 2. Pricing Forecasts Per Unit, 2023- 2032
Figure 3. Porter’s Five Forces
Figure 4. Global Energy Shots Market Revenue (USD Million) By Regions (2021-2032)
Figure 5. Global Energy Shots Market Share (%) By Regions (2023)
Figure 6. North America Energy Shots Revenue (USD Million) By Country (2021-2032)
Figure 7. United States Energy Shots Revenue (USD Million) By Country (2021-2032)
Figure 8. Canada Energy Shots Revenue (USD Million) By Country (2021-2032)
Figure 9. Mexico Energy Shots Revenue (USD Million) By Country (2021-2032)
Figure 10. Europe Energy Shots Revenue (USD Million) By Country (2021-2032)
Figure 11. Germany Energy Shots Revenue (USD Million) By Country (2021-2032)
Figure 12. France Energy Shots Revenue (USD Million) By Country (2021-2032)
Figure 13. United Kingdom Energy Shots Revenue (USD Million) By Country (2021-2032)
Figure 14. Spain Energy Shots Revenue (USD Million) By Country (2021-2032)
Figure 15. Italy Energy Shots Revenue (USD Million) By Country (2021-2032)
Figure 16. Russia Energy Shots Revenue (USD Million) By Country (2021-2032)
Figure 17. Rest of Europe Energy Shots Revenue (USD Million) By Country (2021-2032)
Figure 11. Asia Pacific Energy Shots Revenue (USD Million) By Country (2021-2032)
Figure 12. China Energy Shots Revenue (USD Million) By Country (2021-2032)
Figure 13. Japan Energy Shots Revenue (USD Million) By Country (2021-2032)
Figure 14. India Energy Shots Revenue (USD Million) By Country (2021-2032)
Figure 15. South Korea Energy Shots Revenue (USD Million) By Country (2021-2032)
Figure 16. Australia Energy Shots Revenue (USD Million) By Country (2021-2032)
Figure 17. South East Asia Energy Shots Revenue (USD Million) By Country (2021-2032)
Figure 18. South America Energy Shots Revenue (USD Million) By Country (2021-2032)
Figure 19. Brazil Energy Shots Revenue (USD Million) By Country (2021-2032)
Figure 20. Argentina Energy Shots Revenue (USD Million) By Country (2021-2032)
Figure 21. Rest of Asia Pacific Energy Shots Revenue (USD Million) By Country (2021-2032)
Figure 22. Middle East and Africa Energy Shots Revenue (USD Million) By Region (2021-2032)
Figure 23. Saudi Arabia Energy Shots Revenue (USD Million) By Region (2021-2032)
Figure 24. The UAE Energy Shots Revenue (USD Million) By Region (2021-2032)
Figure 25. Rest of Middle East Energy Shots Revenue (USD Million) By Region (2021-2032)
Figure 26. South Africa Energy Shots Revenue (USD Million) By Region (2021-2032)
Figure 27. Africa Energy Shots Revenue (USD Million) By Region (2021-2032)
Figure 28. North America Energy Shots Revenue (USD Million) By Type (2021-2032)
Figure 29. North America Energy Shots Revenue (USD Million) By Application (2021-2032)
Figure 30. North America Energy Shots Revenue (USD Million) By Product (2021-2032)
Figure 31. Europe Energy Shots Revenue (USD Million) By Type (2021-2032)
Figure 32. Europe Energy Shots Revenue (USD Million) By Application (2021-2032)
Figure 33. Europe Energy Shots Revenue (USD Million) By Product (2021-2032)
Figure 34. Asia Pacific Energy Shots Revenue (USD Million) By Type (2021-2032)
Figure 35. Asia Pacific Energy Shots Revenue (USD Million) By Application (2021-2032)
Figure 36. Asia Pacific Energy Shots Revenue (USD Million) By Product (2021-2032)
Figure 37. South America Energy Shots Revenue (USD Million) By Type (2021-2032)
Figure 38. South America Energy Shots Revenue (USD Million) By Application (2021-2032)
Figure 39. South America Energy Shots Revenue (USD Million) By Product (2021-2032)
Figure 40. Middle East and Africa Energy Shots Revenue (USD Million) By Type (2021-2032)
Figure 41. Middle East and Africa Energy Shots Revenue (USD Million) By Application (2021-2032)
Figure 42. Middle East and Africa Energy Shots Revenue (USD Million) By Product (2021-2032)
By Type
Cherry Flavor
Grape Flavor
Others
By Application
Hypermarkets/Supermarkets
Convenience Stores
Departmental Stores
Online Stores
Others
Countries Analyzed
North America (US, Canada, Mexico)
Europe (Germany, UK, France, Spain, Italy, Russia, Rest of Europe)
Asia Pacific (China, India, Japan, South Korea, Australia, South East Asia, Rest of Asia)
South America (Brazil, Argentina, Rest of South America)
Middle East and Africa (Saudi Arabia, UAE, Rest of Middle East, South Africa, Egypt, Rest of Africa)
