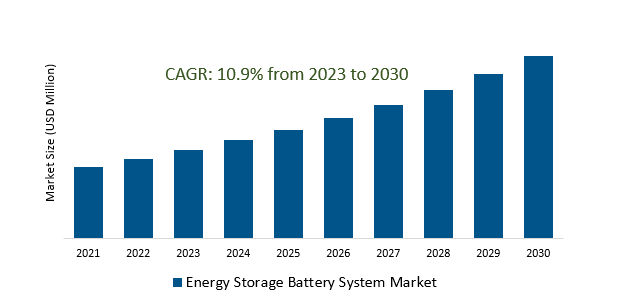
The Energy Storage Battery System Market Size is estimated to register 10.9% growth over the forecast period from 2023 to 2030.
Energy Storage Battery System Market Overview
The surge in the electric vehicle market is demanding advancements in battery technology. Energy storage systems enhance grid stability by providing backup power during outages and supporting critical infrastructure, driving the market growth. Ongoing advancements in battery chemistry and design, including developments in lithium-ion and beyond, aim to increase energy density, extend battery life, and enhance safety features are the key drivers. The emergence of Energy Storage as a Service model provides flexibility and cost-effectiveness for consumers, enabling access to energy storage solutions without the need for large upfront investments. Increasing energy demand and the need for efficient energy management solutions are driving the adoption of energy storage systems. Further, Businesses and utilities are seeking energy storage solutions for backup power and resilience during emergencies.
Energy Storage Battery System Market Dynamics
Market Trends- Renewable energy integration and energy transition are significantly impacting energy storage battery systems within the market transformation.
The rising demand for energy storage solutions capable of seamlessly integrating renewable sources reflects an opportunity for companies to innovate and develop advanced battery technologies, thereby supporting the market.
As nations worldwide commit to reducing carbon footprints and achieving sustainability goals, the integration of renewable energy into existing grids is gaining significant traction.
Enablement of the efficient storage of excess energy produced during peak times and ensuring its availability during periods of low generation are fueling the demand.
Market Driver- The Energy Storage Battery System Market experiences a notable increase in the adoption of residential and commercial battery storage solutions.
The ability to store surplus energy generated from renewable sources like solar panels, enabling self-consumption and reducing reliance on the grid are driving the market growth.
Fluctuating electricity prices and peak demand charges are driving the need for battery storage offers to manage energy costs by storing cheaper off-peak energy for use during higher tariff periods.
Further, technological advancements and declining costs of energy storage systems, particularly lithium-ion batteries are becoming more accessible and economically viable for residential and commercial applications, driving the demand.
Market Opportunity- The expansion of the Electric Vehicle market notably influences the Energy Storage Battery System Market.
The escalating demand for EVs worldwide, primarily due to environmental concerns and governmental initiatives promoting cleaner transportation is the major factor.
Additionally, Technological advancements in battery chemistry, focusing on improving energy density, durability, and charging speed is reflecting the competitive landscape as manufacturers aim to meet EV demands for higher-performance batteries, driving the market growth.
Further, expansion of EV market is propelling the development and enhancement of energy storage battery systems, vital components powering these vehicles.
Market Share Analysis- Lithium-Ion Batteries will register the fastest growth.
The Energy Storage Battery System Market is analyzed across Lithium-Ion Batteries, Advanced Lead-Acid Batteries, Flow Batteries & Others. Lithium-Ion Batteries are poised to register the fastest growth. These batteries are emerging as a dominant force owing to their high energy density, longer cycle life, and lightweight design, making them ideal for various energy storage needs. Lithium-Ion Batteries are extensively utilized in numerous sectors, including electric vehicles (EVs), consumer electronics, residential and commercial energy storage systems, and grid-scale applications. Their widespread adoption of EVs has significantly contributed to their market prominence, offering efficient power sources for these vehicles, and addressing concerns about driving range and charging time. Further, Lithium-Ion Batteries play a pivotal role in renewable energy integration, allowing the storage of surplus energy generated from solar or wind sources for use during times of high demand or low generation.
Market Share Analysis- On-grid held a significant market share in 2023.
The Energy Storage Battery System Market is analyzed across various connection types including On-grid & Off-grid. Of these, On-grid held a significant market share in 2023. These systems are strategically designed to operate in conjunction with the grid infrastructure, supporting utilities and energy providers in managing electricity supply and demand dynamics. On-grid energy storage installations serve multiple purposes, including grid stabilization, frequency regulation, and load management. They play a crucial role in improving grid reliability by storing excess electricity during periods of low demand and discharging it when demand surges. By doing so, they help to balance the load, mitigate fluctuations, and enhance grid stability, ultimately contributing to a more efficient and resilient power network. On-grid battery systems are often employed by utility companies, industries, and commercial entities to optimize energy usage, minimize peak demand charges, and provide ancillary grid services.
Energy Storage Battery System Market News
Caterpillar, a manufacturer of construction and industrial equipment, introduced the Cat ESS suite, an integrated energy storage system (ESS) solution encompassing various battery storage products.
Wartsila introduces the Quantum High Energy storage system, featuring enhanced safety measures and heightened energy density.
Energy Storage Battery System Market Segmentation
By Element
By Battery Type
- Lithium-Ion Batteries
- Advanced Lead-Acid Batteries
- Flow Batteries
- Others
By Connection Type
By Ownership
- Customer-Owned
- Third-Party Owned
- Utility-Owned
By Energy Capacity
- Below 100 MWh
- Between 100 to 500 MWh
- Above 500 MWh
By Application
- Residential
- Commercial
- Utility
By Region
- North America (United States, Canada, Mexico)
- Europe (Germany, France, United Kingdom, Spain, Italy, Others)
- Asia Pacific (China, India, Japan, South Korea, Australia, Others)
- Latin America (Brazil, Argentina, Others)
- Middle East and Africa (Saudi Arabia, UAE, Kuwait, Other Middle East, South Africa, Nigeria, Other Africa)
Energy Storage Battery System Market Companies
- Enersys (United States)
- Exide Industries Ltd. (India)
- BYD (China)
- Contemporary Amperex Technology Co., Limited. (China)
- CALB (China)
- SolarEdge Technologies, Inc (United States).
- LG Chem (South Korea)
- SK Inc. (South Korea)
- Morimura Bros., Inc. (Japan)
- Panasonic Corporation (Japan)
- Samsung SDI Co., Ltd. (South Korea)
- Primus Power Corporation (United States)
*list not exhaustive
Energy Storage Battery System Market Outlook 2023
1 Market Overview
1.1 Introduction to the Energy Storage Battery System Market
1.2 Scope of the Study
1.3 Research Objective
1.3.1 Key Market Scope and Segments
1.3.2 Players Covered
1.3.3 Years Considered
2 Executive Summary
2.1 2023 Energy Storage Battery System Industry- Market Statistics
3 Market Dynamics
3.1 Market Drivers
3.2 Market Challenges
3.3 Market Opportunities
3.4 Market Trends
4 Market Factor Analysis
4.1 Porter’s Five Forces
4.2 Market Entropy
4.2.1 Global Energy Storage Battery System Market Companies with Area Served
4.2.2 Products Offerings Global Energy Storage Battery System Market
5 COVID-19 Impact Analysis and Outlook Scenarios
5.1.1 Covid-19 Impact Analysis
5.1.2 post-COVID-19 Scenario- Low Growth Case
5.1.3 post-COVID-19 Scenario- Reference Growth Case
5.1.4 post-COVID-19 Scenario- Low Growth Case
6 Global Energy Storage Battery System Market Trends
6.1 Global Energy Storage Battery System Revenue (USD Million) and CAGR (%) by Type (2018-2030)
6.2 Global Energy Storage Battery System Revenue (USD Million) and CAGR (%) by Applications (2018-2030)
6.3 Global Energy Storage Battery System Revenue (USD Million) and CAGR (%) by regions (2018-2030)
7 Global Energy Storage Battery System Market Revenue (USD Million) by Type, and Applications (2018-2022)
7.1 Global Energy Storage Battery System Revenue (USD Million) by Type (2018-2022)
7.1.1 Global Energy Storage Battery System Revenue (USD Million), Market Share (%) by Type (2018-2022)
7.2 Global Energy Storage Battery System Revenue (USD Million) by Applications (2018-2022)
7.2.1 Global Energy Storage Battery System Revenue (USD Million), Market Share (%) by Applications (2018-2022)
8 Global Energy Storage Battery System Development Regional Status and Outlook
8.1 Global Energy Storage Battery System Revenue (USD Million) By Regions (2018-2022)
8.2 North America Energy Storage Battery System Revenue (USD Million) by Type, and Application (2018-2022)
8.2.1 North America Energy Storage Battery System Revenue (USD Million) by Country (2018-2022)
8.2.2 North America Energy Storage Battery System Revenue (USD Million) by Type (2018-2022)
8.2.3 North America Energy Storage Battery System Revenue (USD Million) by Applications (2018-2022)
8.3 Europe Energy Storage Battery System Revenue (USD Million), by Type, and Applications (USD Million) (2018-2022)
8.3.1 Europe Energy Storage Battery System Revenue (USD Million), by Country (2018-2022)
8.3.2 Europe Energy Storage Battery System Revenue (USD Million) by Type (2018-2022)
8.3.3 Europe Energy Storage Battery System Revenue (USD Million) by Applications (2018-2022)
8.4 Asia Pacific Energy Storage Battery System Revenue (USD Million), and Revenue (USD Million) by Type, and Applications (2018-2022)
8.4.1 Asia Pacific Energy Storage Battery System Revenue (USD Million) by Country (2018-2022)
8.4.2 Asia Pacific Energy Storage Battery System Revenue (USD Million) by Type (2018-2022)
8.4.3 Asia Pacific Energy Storage Battery System Revenue (USD Million) by Applications (2018-2022)
8.5 South America Energy Storage Battery System Revenue (USD Million), by Type, and Applications (2018-2022)
8.5.1 South America Energy Storage Battery System Revenue (USD Million), by Country (2018-2022)
8.5.2 South America Energy Storage Battery System Revenue (USD Million) by Type (2018-2022)
8.5.3 South America Energy Storage Battery System Revenue (USD Million) by Applications (2018-2022)
8.6 Middle East and Africa Energy Storage Battery System Revenue (USD Million), by Type, Technology, Application, Thickness (2018-2022)
8.6.1 Middle East and Africa Energy Storage Battery System Revenue (USD Million) by Country (2018-2022)
8.6.2 Middle East and Africa Energy Storage Battery System Revenue (USD Million) by Type (2018-2022)
8.6.3 Middle East and Africa Energy Storage Battery System Revenue (USD Million) by Applications (2018-2022)
9 Company Profiles
10 Global Energy Storage Battery System Market Revenue (USD Million), by Type, and Applications (2023-2030)
10.1 Global Energy Storage Battery System Revenue (USD Million) and Market Share (%) by Type (2023-2030)
10.1.1 Global Energy Storage Battery System Revenue (USD Million), and Market Share (%) by Type (2023-2030)
10.2 Global Energy Storage Battery System Revenue (USD Million) and Market Share (%) by Applications (2023-2030)
10.2.1 Global Energy Storage Battery System Revenue (USD Million), and Market Share (%) by Applications (2023-2030)
11 Global Energy Storage Battery System Development Regional Status and Outlook Forecast
11.1 Global Energy Storage Battery System Revenue (USD Million) By Regions (2023-2030)
11.2 North America Energy Storage Battery System Revenue (USD Million) by Type, and Applications (2023-2030)
11.2.1 North America Energy Storage Battery System Revenue (USD) Million by Country (2023-2030)
11.2.2 North America Energy Storage Battery System Revenue (USD Million), by Type (2023-2030)
11.2.3 North America Energy Storage Battery System Revenue (USD Million), Market Share (%) by Applications (2023-2030)
11.3 Europe Energy Storage Battery System Revenue (USD Million), by Type, and Applications (2023-2030)
11.3.1 Europe Energy Storage Battery System Revenue (USD Million), by Country (2023-2030)
11.3.2 Europe Energy Storage Battery System Revenue (USD Million), by Type (2023-2030)
11.3.3 Europe Energy Storage Battery System Revenue (USD Million), by Applications (2023-2030)
11.4 Asia Pacific Energy Storage Battery System Revenue (USD Million) by Type, and Applications (2023-2030)
11.4.1 Asia Pacific Energy Storage Battery System Revenue (USD Million), by Country (2023-2030)
11.4.2 Asia Pacific Energy Storage Battery System Revenue (USD Million), by Type (2023-2030)
11.4.3 Asia Pacific Energy Storage Battery System Revenue (USD Million), by Applications (2023-2030)
11.5 South America Energy Storage Battery System Revenue (USD Million), by Type, and Applications (2023-2030)
11.5.1 South America Energy Storage Battery System Revenue (USD Million), by Country (2023-2030)
11.5.2 South America Energy Storage Battery System Revenue (USD Million), by Type (2023-2030)
11.5.3 South America Energy Storage Battery System Revenue (USD Million), by Applications (2023-2030)
11.6 Middle East and Africa Energy Storage Battery System Revenue (USD Million), by Type, and Applications (2023-2030)
11.6.1 Middle East and Africa Energy Storage Battery System Revenue (USD Million), by region (2023-2030)
11.6.2 Middle East and Africa Energy Storage Battery System Revenue (USD Million), by Type (2023-2030)
11.6.3 Middle East and Africa Energy Storage Battery System Revenue (USD Million), by Applications (2023-2030)
12 Methodology and Data Sources
12.1 Methodology/Research Approach
12.1.1 Research Programs/Design
12.1.2 Market Size Estimation
12.1.3 Market Breakdown and Data Triangulation
12.2 Data Sources
12.2.1 Secondary Sources
12.2.2 Primary Sources
12.3 Disclaimer
List of Tables
Table 1 Market Segmentation Analysis
Table 2 Global Energy Storage Battery System Market Companies with Areas Served
Table 3 Products Offerings Global Energy Storage Battery System Market
Table 4 Low Growth Scenario Forecasts
Table 5 Reference Case Growth Scenario
Table 6 High Growth Case Scenario
Table 7 Global Energy Storage Battery System Revenue (USD Million) And CAGR (%) By Type (2018-2030)
Table 8 Global Energy Storage Battery System Revenue (USD Million) And CAGR (%) By Applications (2018-2030)
Table 9 Global Energy Storage Battery System Revenue (USD Million) And CAGR (%) By Regions (2018-2030)
Table 10 Global Energy Storage Battery System Revenue (USD Million) By Type (2018-2022)
Table 11 Global Energy Storage Battery System Revenue Market Share (%) By Type (2018-2022)
Table 12 Global Energy Storage Battery System Revenue (USD Million) By Applications (2018-2022)
Table 13 Global Energy Storage Battery System Revenue Market Share (%) By Applications (2018-2022)
Table 14 Global Energy Storage Battery System Market Revenue (USD Million) By Regions (2018-2022)
Table 15 Global Energy Storage Battery System Market Share (%) By Regions (2018-2022)
Table 16 North America Energy Storage Battery System Revenue (USD Million) By Country (2018-2022)
Table 17 North America Energy Storage Battery System Revenue (USD Million) By Type (2018-2022)
Table 18 North America Energy Storage Battery System Revenue (USD Million) By Applications (2018-2022)
Table 19 Europe Energy Storage Battery System Revenue (USD Million) By Country (2018-2022)
Table 20 Europe Energy Storage Battery System Revenue (USD Million) By Type (2018-2022)
Table 21 Europe Energy Storage Battery System Revenue (USD Million) By Applications (2018-2022)
Table 22 Asia Pacific Energy Storage Battery System Revenue (USD Million) By Country (2018-2022)
Table 23 Asia Pacific Energy Storage Battery System Revenue (USD Million) By Type (2018-2022)
Table 24 Asia Pacific Energy Storage Battery System Revenue (USD Million) By Applications (2018-2022)
Table 25 South America Energy Storage Battery System Revenue (USD Million) By Country (2018-2022)
Table 26 South America Energy Storage Battery System Revenue (USD Million) By Type (2018-2022)
Table 27 South America Energy Storage Battery System Revenue (USD Million) By Applications (2018-2022)
Table 28 Middle East and Africa Energy Storage Battery System Revenue (USD Million) By Region (2018-2022)
Table 29 Middle East and Africa Energy Storage Battery System Revenue (USD Million) By Type (2018-2022)
Table 30 Middle East and Africa Energy Storage Battery System Revenue (USD Million) By Applications (2018-2022)
Table 31 Financial Analysis
Table 32 Global Energy Storage Battery System Revenue (USD Million) By Type (2023-2030)
Table 33 Global Energy Storage Battery System Revenue Market Share (%) By Type (2023-2030)
Table 34 Global Energy Storage Battery System Revenue (USD Million) By Applications (2023-2030)
Table 35 Global Energy Storage Battery System Revenue Market Share (%) By Applications (2023-2030)
Table 36 Global Energy Storage Battery System Market Revenue (USD Million), And Revenue (USD Million) By Regions (2023-2030)
Table 37 North America Energy Storage Battery System Revenue (USD)By Country (2023-2030)
Table 38 North America Energy Storage Battery System Revenue (USD Million) By Type (2023-2030)
Table 39 North America Energy Storage Battery System Revenue (USD Million) By Applications (2023-2030)
Table 40 Europe Energy Storage Battery System Revenue (USD Million) By Country (2023-2030)
Table 41 Europe Energy Storage Battery System Revenue (USD Million) By Type (2023-2030)
Table 42 Europe Energy Storage Battery System Revenue (USD Million) By Applications (2023-2030)
Table 43 Asia Pacific Energy Storage Battery System Revenue (USD Million) By Country (2023-2030)
Table 44 Asia Pacific Energy Storage Battery System Revenue (USD Million) By Type (2023-2030)
Table 45 Asia Pacific Energy Storage Battery System Revenue (USD Million) By Applications (2023-2030)
Table 46 South America Energy Storage Battery System Revenue (USD Million) By Country (2023-2030)
Table 47 South America Energy Storage Battery System Revenue (USD Million) By Type (2023-2030)
Table 48 South America Energy Storage Battery System Revenue (USD Million) By Applications (2023-2030)
Table 49 Middle East and Africa Energy Storage Battery System Revenue (USD Million) By Region (2023-2030)
Table 50 Middle East and Africa Energy Storage Battery System Revenue (USD Million) By Region (2023-2030)
Table 51 Middle East and Africa Energy Storage Battery System Revenue (USD Million) By Type (2023-2030)
Table 52 Middle East and Africa Energy Storage Battery System Revenue (USD Million) By Applications (2023-2030)
Table 53 Research Programs/Design for This Report
Table 54 Key Data Information from Secondary Sources
Table 55 Key Data Information from Primary Sources
List of Figures
Figure 1 Market Scope
Figure 2 Porter’s Five Forces
Figure 3 Global Energy Storage Battery System Revenue (USD Million) By Type (2018-2022)
Figure 4 Global Energy Storage Battery System Revenue Market Share (%) By Type (2022)
Figure 5 Global Energy Storage Battery System Revenue (USD Million) By Applications (2018-2022)
Figure 6 Global Energy Storage Battery System Revenue Market Share (%) By Applications (2022)
Figure 7 Global Energy Storage Battery System Market Revenue (USD Million) By Regions (2018-2022)
Figure 8 Global Energy Storage Battery System Market Share (%) By Regions (2022)
Figure 9 North America Energy Storage Battery System Revenue (USD Million) By Country (2018-2022)
Figure 10 North America Energy Storage Battery System Revenue (USD Million) By Type (2018-2022)
Figure 11 North America Energy Storage Battery System Revenue (USD Million) By Applications (2018-2022)
Figure 12 Europe Energy Storage Battery System Revenue (USD Million) By Country (2018-2022)
Figure 13 Europe Energy Storage Battery System Revenue (USD Million) By Type (2018-2022)
Figure 14 Europe Energy Storage Battery System Revenue (USD Million) By Applications (2018-2022)
Figure 15 Asia Pacific Energy Storage Battery System Revenue (USD Million) By Country (2018-2022)
Figure 16 Asia Pacific Energy Storage Battery System Revenue (USD Million) By Type (2018-2022)
Figure 17 Asia Pacific Energy Storage Battery System Revenue (USD Million) By Applications (2018-2022)
Figure 18 South America Energy Storage Battery System Revenue (USD Million) By Country (2018-2022)
Figure 19 South America Energy Storage Battery System Revenue (USD Million) By Type (2018-2022)
Figure 20 South America Energy Storage Battery System Revenue (USD Million) By Applications (2018-2022)
Figure 21 Middle East and Africa Energy Storage Battery System Revenue (USD Million) By Region (2018-2022)
Figure 22 Middle East and Africa Energy Storage Battery System Revenue (USD Million) By Type (2018-2022)
Figure 23 Middle East and Africa Energy Storage Battery System Revenue (USD Million) By Applications (2018-2022)
Figure 24 Global Energy Storage Battery System Revenue (USD Million) By Type (2023-2030)
Figure 25 Global Energy Storage Battery System Revenue Market Share (%) By Type (2030)
Figure 26 Global Energy Storage Battery System Revenue (USD Million) By Applications (2023-2030)
Figure 27 Global Energy Storage Battery System Revenue Market Share (%) By Applications (2030)
Figure 28 Global Energy Storage Battery System Market Revenue (USD Million) By Regions (2023-2030)
Figure 29 North America Energy Storage Battery System Revenue (USD Million) By Country (2023-2030)
Figure 30 North America Energy Storage Battery System Revenue (USD Million) By Type (2023-2030)
Figure 31 North America Energy Storage Battery System Revenue (USD Million) By Applications (2023-2030)
Figure 32 Europe Energy Storage Battery System Revenue (USD Million) By Country (2023-2030)
Figure 33 Europe Energy Storage Battery System Revenue (USD Million) By Type (2023-2030)
Figure 34 Europe Energy Storage Battery System Revenue (USD Million) By Applications (2023-2030)
Figure 35 Asia Pacific Energy Storage Battery System Revenue (USD Million) By Country (2023-2030)
Figure 36 Asia Pacific Energy Storage Battery System Revenue (USD Million) By Type (2023-2030)
Figure 37 Asia Pacific Energy Storage Battery System Revenue (USD Million) By Applications (2023-2030)
Figure 38 South America Energy Storage Battery System Revenue (USD Million) By Country (2023-2030)
Figure 39 South America Energy Storage Battery System Revenue (USD Million) By Type (2023-2030)
Figure 40 South America Energy Storage Battery System Revenue (USD Million) By Applications (2023-2030)
Figure 41 Middle East and Africa Energy Storage Battery System Revenue (USD Million) By Region (2023-2030)
Figure 42 Middle East and Africa Energy Storage Battery System Revenue (USD Million) By Region (2023-2030)
Figure 43 Middle East and Africa Energy Storage Battery System Revenue (USD Million) By Type (2023-2030)
Figure 44 Middle East and Africa Energy Storage Battery System Revenue (USD Million) By Applications (2023-2030)
Figure 45 Bottom-Up and Top-Down Approaches for This Report
Figure 46 Data Triangulation
