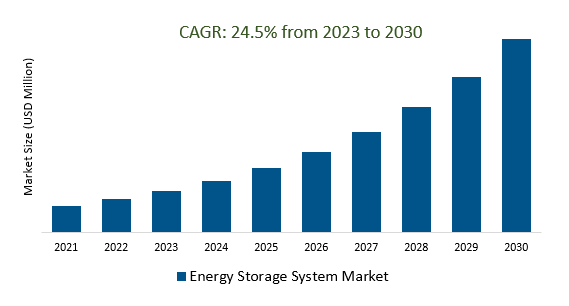
The Global Energy Storage System Market Size is estimated to register 24.5% growth over the forecast period from 2023 to 2030.
The market growth is driven by an increasing rowing trend towards decentralization in energy markets, with a shift from centralized power generation to distributed energy resources. Energy storage systems play a crucial role in this trend by enabling the storage of excess energy at various points in the grid, allowing for more localized and flexible energy distribution. Leading Companies focusing on Advanced Grid-Scale Storage Solutions, Integration of Artificial Intelligence (AI) and Energy Storage, Electrification of More Sectors, and others to boost market shares in the industry.
Market Overview
The global energy storage system (ESS) market has experienced substantial growth, driven by the increasing integration of renewable energy sources, advancements in technologies like lithium-ion batteries, and a growing focus on grid resilience. Key trends include the integration of ESS with renewables, the rise of electric vehicles propelling demand, and the crucial role of energy storage in enhancing grid stability. Government regulations, supportive policies, and ongoing advancements in battery technologies further contribute to the market's evolution. The future scope involves advanced grid-scale solutions, the integration of artificial intelligence, and the electrification of sectors beyond transportation, presenting opportunities for innovation and market expansion.
Market Dynamics
Market Trends- Battery energy storage systems (BESS) play a vital role in integrating renewable energy sources into the grid.
Battery Energy Storage Systems (BESS) are crucial for integrating renewable energy into the grid by smoothing the intermittency of sources like solar and wind, ensuring a stable power supply. They play a vital role in grid stability through rapid-response frequency regulation, offer energy shifting for peak demand management, enhance overall grid resilience with immediate backup power during outages, and support the development of microgrids. Ongoing trends focus on increasing BESS efficiency and scalability through advancements in battery technologies, contributing to a more sustainable energy landscape.
Market Driver- The growing demand for electric vehicles is driving the demand for energy storage systems.
The escalating demand for electric vehicles (EVs) is a key catalyst for the Energy Storage System (ESS) market, driving investments in charging infrastructure and grid support services. ESS plays a crucial role in optimizing EV charging networks, balancing grid loads, and ensuring resilience in the face of increased electricity demand. The symbiotic relationship between EVs and ESS contributes to the growth of both markets, with advancements in battery technologies benefitting both stationary storage applications and electric vehicles. This intersection creates economic opportunities and positions energy storage as an integral component in addressing the evolving challenges and opportunities within the broader energy landscape.
Market Opportunity- Energy storage systems can improve grid resilience and reliability by providing backup power during outages and stabilizing the grid during fluctuations in demand and supply.
Energy Storage Systems (ESS) enhance grid resilience and reliability by offering rapid-response frequency regulation, mitigating the impact of intermittent renewables, and providing immediate backup power during outages. Their role in stabilizing the grid during fluctuations in demand and supply, coupled with grid support services like voltage control and black start capabilities, contributes to the overall reliability of the electricity infrastructure. Additionally, ESS facilitates microgrid resilience and independence, allowing for localized power solutions in the face of wider grid disruptions. These functions underscore the critical role of energy storage in ensuring a dependable and robust energy infrastructure, especially in the context of evolving challenges and uncertainties.
Market Share Analysis- Electrochemical Storage Energy Storage System Market will register the fastest growth
The Global Energy Storage System Market is analyzed across Pumped Storage, Electrochemical Storage, Electromechanical Storage, Thermal Storage, and others. Electrochemical Storage is poised to register the fastest growth. The Electrochemical Energy Storage System (ESS) market encompasses technologies such as lithium-ion batteries, crucial for electric vehicles and grid storage. Fueled by advancements in battery technologies, the electrification of transportation, and the integration of renewables, this market is expanding rapidly. Ongoing research focuses on enhancing energy density, cycle life, and cost-effectiveness. As the global energy landscape shifts towards sustainability, Electrochemical ESS emerges as a vital player, ensuring efficient and reliable energy storage solutions for various applications.
Market Share Analysis- Commercial held a significant market share in 2023
The Global Energy Storage System Market is analyzed across various applications including Residential, Commercial, and others. Of these, Commercial held a significant market share in 2023. The commercial Energy Storage System (ESS) market addresses the energy needs of businesses and industrial facilities, focusing on grid stability, demand management, and cost savings. Offering peak shaving for reduced electricity costs, backup power during outages, and grid support services, commercial ESS supports reliable and efficient energy usage. The market's growth is driven by advancements in battery technologies, government incentives, and the increasing emphasis on sustainable and resilient commercial operations.
Energy Storage System Market Segmentation
By Technology
- Pumped Storage
- Electrochemical Storage
- Electromechanical Storage
- Thermal Storage
By Application
- Residential
- Commercial
- Others
By Region
- North America (United States, Canada, Mexico)
- Europe (Germany, France, United Kingdom, Spain, Italy, Others)
- Asia Pacific (China, India, Japan, South Korea, Australia, Others)
- Latin America (Brazil, Argentina, Others)
- Middle East and Africa (Saudi Arabia, UAE, Kuwait, Other Middle East, South Africa, Nigeria, Other Africa)
Energy Storage System Market companies
- GENERAL ELECTRIC
- LG Chem
- Langley Holdings plc
- Altairnano
- Electrovaya
- Showa Denko Materials Co Ltd
- Maxwell Technologies Inc
- Saft
- The Furukawa Battery Co Ltd
- Ecoult
- Kokam
- Fluence
- Samsung SDI Co Ltd
*List not exhaustive
Energy Storage System Market Outlook 2023
1 Market Overview
1.1 Introduction to the Energy Storage System Market
1.2 Scope of the Study
1.3 Research Objective
1.3.1 Key Market Scope and Segments
1.3.2 Players Covered
1.3.3 Years Considered
2 Executive Summary
2.1 2023 Energy Storage System Industry- Market Statistics
3 Market Dynamics
3.1 Market Drivers
3.2 Market Challenges
3.3 Market Opportunities
3.4 Market Trends
4 Market Factor Analysis
4.1 Porter’s Five Forces
4.2 Market Entropy
4.2.1 Global Energy Storage System Market Companies with Area Served
4.2.2 Products Offerings Global Energy Storage System Market
5 COVID-19 Impact Analysis and Outlook Scenarios
5.1.1 Covid-19 Impact Analysis
5.1.2 post-COVID-19 Scenario- Low Growth Case
5.1.3 post-COVID-19 Scenario- Reference Growth Case
5.1.4 post-COVID-19 Scenario- Low Growth Case
6 Global Energy Storage System Market Trends
6.1 Global Energy Storage System Revenue (USD Million) and CAGR (%) by Type (2018-2030)
6.2 Global Energy Storage System Revenue (USD Million) and CAGR (%) by Applications (2018-2030)
6.3 Global Energy Storage System Revenue (USD Million) and CAGR (%) by regions (2018-2030)
7 Global Energy Storage System Market Revenue (USD Million) by Type, and Applications (2018-2022)
7.1 Global Energy Storage System Revenue (USD Million) by Type (2018-2022)
7.1.1 Global Energy Storage System Revenue (USD Million), Market Share (%) by Type (2018-2022)
7.2 Global Energy Storage System Revenue (USD Million) by Applications (2018-2022)
7.2.1 Global Energy Storage System Revenue (USD Million), Market Share (%) by Applications (2018-2022)
8 Global Energy Storage System Development Regional Status and Outlook
8.1 Global Energy Storage System Revenue (USD Million) By Regions (2018-2022)
8.2 North America Energy Storage System Revenue (USD Million) by Type, and Application (2018-2022)
8.2.1 North America Energy Storage System Revenue (USD Million) by Country (2018-2022)
8.2.2 North America Energy Storage System Revenue (USD Million) by Type (2018-2022)
8.2.3 North America Energy Storage System Revenue (USD Million) by Applications (2018-2022)
8.3 Europe Energy Storage System Revenue (USD Million), by Type, and Applications (USD Million) (2018-2022)
8.3.1 Europe Energy Storage System Revenue (USD Million), by Country (2018-2022)
8.3.2 Europe Energy Storage System Revenue (USD Million) by Type (2018-2022)
8.3.3 Europe Energy Storage System Revenue (USD Million) by Applications (2018-2022)
8.4 Asia Pacific Energy Storage System Revenue (USD Million), and Revenue (USD Million) by Type, and Applications (2018-2022)
8.4.1 Asia Pacific Energy Storage System Revenue (USD Million) by Country (2018-2022)
8.4.2 Asia Pacific Energy Storage System Revenue (USD Million) by Type (2018-2022)
8.4.3 Asia Pacific Energy Storage System Revenue (USD Million) by Applications (2018-2022)
8.5 South America Energy Storage System Revenue (USD Million), by Type, and Applications (2018-2022)
8.5.1 South America Energy Storage System Revenue (USD Million), by Country (2018-2022)
8.5.2 South America Energy Storage System Revenue (USD Million) by Type (2018-2022)
8.5.3 South America Energy Storage System Revenue (USD Million) by Applications (2018-2022)
8.6 Middle East and Africa Energy Storage System Revenue (USD Million), by Type, Technology, Application, Thickness (2018-2022)
8.6.1 Middle East and Africa Energy Storage System Revenue (USD Million) by Country (2018-2022)
8.6.2 Middle East and Africa Energy Storage System Revenue (USD Million) by Type (2018-2022)
8.6.3 Middle East and Africa Energy Storage System Revenue (USD Million) by Applications (2018-2022)
9 Company Profiles
10 Global Energy Storage System Market Revenue (USD Million), by Type, and Applications (2023-2030)
10.1 Global Energy Storage System Revenue (USD Million) and Market Share (%) by Type (2023-2030)
10.1.1 Global Energy Storage System Revenue (USD Million), and Market Share (%) by Type (2023-2030)
10.2 Global Energy Storage System Revenue (USD Million) and Market Share (%) by Applications (2023-2030)
10.2.1 Global Energy Storage System Revenue (USD Million), and Market Share (%) by Applications (2023-2030)
11 Global Energy Storage System Development Regional Status and Outlook Forecast
11.1 Global Energy Storage System Revenue (USD Million) By Regions (2023-2030)
11.2 North America Energy Storage System Revenue (USD Million) by Type, and Applications (2023-2030)
11.2.1 North America Energy Storage System Revenue (USD) Million by Country (2023-2030)
11.2.2 North America Energy Storage System Revenue (USD Million), by Type (2023-2030)
11.2.3 North America Energy Storage System Revenue (USD Million), Market Share (%) by Applications (2023-2030)
11.3 Europe Energy Storage System Revenue (USD Million), by Type, and Applications (2023-2030)
11.3.1 Europe Energy Storage System Revenue (USD Million), by Country (2023-2030)
11.3.2 Europe Energy Storage System Revenue (USD Million), by Type (2023-2030)
11.3.3 Europe Energy Storage System Revenue (USD Million), by Applications (2023-2030)
11.4 Asia Pacific Energy Storage System Revenue (USD Million) by Type, and Applications (2023-2030)
11.4.1 Asia Pacific Energy Storage System Revenue (USD Million), by Country (2023-2030)
11.4.2 Asia Pacific Energy Storage System Revenue (USD Million), by Type (2023-2030)
11.4.3 Asia Pacific Energy Storage System Revenue (USD Million), by Applications (2023-2030)
11.5 South America Energy Storage System Revenue (USD Million), by Type, and Applications (2023-2030)
11.5.1 South America Energy Storage System Revenue (USD Million), by Country (2023-2030)
11.5.2 South America Energy Storage System Revenue (USD Million), by Type (2023-2030)
11.5.3 South America Energy Storage System Revenue (USD Million), by Applications (2023-2030)
11.6 Middle East and Africa Energy Storage System Revenue (USD Million), by Type, and Applications (2023-2030)
11.6.1 Middle East and Africa Energy Storage System Revenue (USD Million), by region (2023-2030)
11.6.2 Middle East and Africa Energy Storage System Revenue (USD Million), by Type (2023-2030)
11.6.3 Middle East and Africa Energy Storage System Revenue (USD Million), by Applications (2023-2030)
12 Methodology and Data Sources
12.1 Methodology/Research Approach
12.1.1 Research Programs/Design
12.1.2 Market Size Estimation
12.1.3 Market Breakdown and Data Triangulation
12.2 Data Sources
12.2.1 Secondary Sources
12.2.2 Primary Sources
12.3 Disclaimer
List of Tables
Table 1 Market Segmentation Analysis
Table 2 Global Energy Storage System Market Companies with Areas Served
Table 3 Products Offerings Global Energy Storage System Market
Table 4 Low Growth Scenario Forecasts
Table 5 Reference Case Growth Scenario
Table 6 High Growth Case Scenario
Table 7 Global Energy Storage System Revenue (USD Million) And CAGR (%) By Type (2018-2030)
Table 8 Global Energy Storage System Revenue (USD Million) And CAGR (%) By Applications (2018-2030)
Table 9 Global Energy Storage System Revenue (USD Million) And CAGR (%) By Regions (2018-2030)
Table 10 Global Energy Storage System Revenue (USD Million) By Type (2018-2022)
Table 11 Global Energy Storage System Revenue Market Share (%) By Type (2018-2022)
Table 12 Global Energy Storage System Revenue (USD Million) By Applications (2018-2022)
Table 13 Global Energy Storage System Revenue Market Share (%) By Applications (2018-2022)
Table 14 Global Energy Storage System Market Revenue (USD Million) By Regions (2018-2022)
Table 15 Global Energy Storage System Market Share (%) By Regions (2018-2022)
Table 16 North America Energy Storage System Revenue (USD Million) By Country (2018-2022)
Table 17 North America Energy Storage System Revenue (USD Million) By Type (2018-2022)
Table 18 North America Energy Storage System Revenue (USD Million) By Applications (2018-2022)
Table 19 Europe Energy Storage System Revenue (USD Million) By Country (2018-2022)
Table 20 Europe Energy Storage System Revenue (USD Million) By Type (2018-2022)
Table 21 Europe Energy Storage System Revenue (USD Million) By Applications (2018-2022)
Table 22 Asia Pacific Energy Storage System Revenue (USD Million) By Country (2018-2022)
Table 23 Asia Pacific Energy Storage System Revenue (USD Million) By Type (2018-2022)
Table 24 Asia Pacific Energy Storage System Revenue (USD Million) By Applications (2018-2022)
Table 25 South America Energy Storage System Revenue (USD Million) By Country (2018-2022)
Table 26 South America Energy Storage System Revenue (USD Million) By Type (2018-2022)
Table 27 South America Energy Storage System Revenue (USD Million) By Applications (2018-2022)
Table 28 Middle East and Africa Energy Storage System Revenue (USD Million) By Region (2018-2022)
Table 29 Middle East and Africa Energy Storage System Revenue (USD Million) By Type (2018-2022)
Table 30 Middle East and Africa Energy Storage System Revenue (USD Million) By Applications (2018-2022)
Table 31 Financial Analysis
Table 32 Global Energy Storage System Revenue (USD Million) By Type (2023-2030)
Table 33 Global Energy Storage System Revenue Market Share (%) By Type (2023-2030)
Table 34 Global Energy Storage System Revenue (USD Million) By Applications (2023-2030)
Table 35 Global Energy Storage System Revenue Market Share (%) By Applications (2023-2030)
Table 36 Global Energy Storage System Market Revenue (USD Million), And Revenue (USD Million) By Regions (2023-2030)
Table 37 North America Energy Storage System Revenue (USD)By Country (2023-2030)
Table 38 North America Energy Storage System Revenue (USD Million) By Type (2023-2030)
Table 39 North America Energy Storage System Revenue (USD Million) By Applications (2023-2030)
Table 40 Europe Energy Storage System Revenue (USD Million) By Country (2023-2030)
Table 41 Europe Energy Storage System Revenue (USD Million) By Type (2023-2030)
Table 42 Europe Energy Storage System Revenue (USD Million) By Applications (2023-2030)
Table 43 Asia Pacific Energy Storage System Revenue (USD Million) By Country (2023-2030)
Table 44 Asia Pacific Energy Storage System Revenue (USD Million) By Type (2023-2030)
Table 45 Asia Pacific Energy Storage System Revenue (USD Million) By Applications (2023-2030)
Table 46 South America Energy Storage System Revenue (USD Million) By Country (2023-2030)
Table 47 South America Energy Storage System Revenue (USD Million) By Type (2023-2030)
Table 48 South America Energy Storage System Revenue (USD Million) By Applications (2023-2030)
Table 49 Middle East and Africa Energy Storage System Revenue (USD Million) By Region (2023-2030)
Table 50 Middle East and Africa Energy Storage System Revenue (USD Million) By Region (2023-2030)
Table 51 Middle East and Africa Energy Storage System Revenue (USD Million) By Type (2023-2030)
Table 52 Middle East and Africa Energy Storage System Revenue (USD Million) By Applications (2023-2030)
Table 53 Research Programs/Design for This Report
Table 54 Key Data Information from Secondary Sources
Table 55 Key Data Information from Primary Sources
List of Figures
Figure 1 Market Scope
Figure 2 Porter’s Five Forces
Figure 3 Global Energy Storage System Revenue (USD Million) By Type (2018-2022)
Figure 4 Global Energy Storage System Revenue Market Share (%) By Type (2022)
Figure 5 Global Energy Storage System Revenue (USD Million) By Applications (2018-2022)
Figure 6 Global Energy Storage System Revenue Market Share (%) By Applications (2022)
Figure 7 Global Energy Storage System Market Revenue (USD Million) By Regions (2018-2022)
Figure 8 Global Energy Storage System Market Share (%) By Regions (2022)
Figure 9 North America Energy Storage System Revenue (USD Million) By Country (2018-2022)
Figure 10 North America Energy Storage System Revenue (USD Million) By Type (2018-2022)
Figure 11 North America Energy Storage System Revenue (USD Million) By Applications (2018-2022)
Figure 12 Europe Energy Storage System Revenue (USD Million) By Country (2018-2022)
Figure 13 Europe Energy Storage System Revenue (USD Million) By Type (2018-2022)
Figure 14 Europe Energy Storage System Revenue (USD Million) By Applications (2018-2022)
Figure 15 Asia Pacific Energy Storage System Revenue (USD Million) By Country (2018-2022)
Figure 16 Asia Pacific Energy Storage System Revenue (USD Million) By Type (2018-2022)
Figure 17 Asia Pacific Energy Storage System Revenue (USD Million) By Applications (2018-2022)
Figure 18 South America Energy Storage System Revenue (USD Million) By Country (2018-2022)
Figure 19 South America Energy Storage System Revenue (USD Million) By Type (2018-2022)
Figure 20 South America Energy Storage System Revenue (USD Million) By Applications (2018-2022)
Figure 21 Middle East and Africa Energy Storage System Revenue (USD Million) By Region (2018-2022)
Figure 22 Middle East and Africa Energy Storage System Revenue (USD Million) By Type (2018-2022)
Figure 23 Middle East and Africa Energy Storage System Revenue (USD Million) By Applications (2018-2022)
Figure 24 Global Energy Storage System Revenue (USD Million) By Type (2023-2030)
Figure 25 Global Energy Storage System Revenue Market Share (%) By Type (2030)
Figure 26 Global Energy Storage System Revenue (USD Million) By Applications (2023-2030)
Figure 27 Global Energy Storage System Revenue Market Share (%) By Applications (2030)
Figure 28 Global Energy Storage System Market Revenue (USD Million) By Regions (2023-2030)
Figure 29 North America Energy Storage System Revenue (USD Million) By Country (2023-2030)
Figure 30 North America Energy Storage System Revenue (USD Million) By Type (2023-2030)
Figure 31 North America Energy Storage System Revenue (USD Million) By Applications (2023-2030)
Figure 32 Europe Energy Storage System Revenue (USD Million) By Country (2023-2030)
Figure 33 Europe Energy Storage System Revenue (USD Million) By Type (2023-2030)
Figure 34 Europe Energy Storage System Revenue (USD Million) By Applications (2023-2030)
Figure 35 Asia Pacific Energy Storage System Revenue (USD Million) By Country (2023-2030)
Figure 36 Asia Pacific Energy Storage System Revenue (USD Million) By Type (2023-2030)
Figure 37 Asia Pacific Energy Storage System Revenue (USD Million) By Applications (2023-2030)
Figure 38 South America Energy Storage System Revenue (USD Million) By Country (2023-2030)
Figure 39 South America Energy Storage System Revenue (USD Million) By Type (2023-2030)
Figure 40 South America Energy Storage System Revenue (USD Million) By Applications (2023-2030)
Figure 41 Middle East and Africa Energy Storage System Revenue (USD Million) By Region (2023-2030)
Figure 42 Middle East and Africa Energy Storage System Revenue (USD Million) By Region (2023-2030)
Figure 43 Middle East and Africa Energy Storage System Revenue (USD Million) By Type (2023-2030)
Figure 44 Middle East and Africa Energy Storage System Revenue (USD Million) By Applications (2023-2030)
Figure 45 Bottom-Up and Top-Down Approaches for This Report
Figure 46 Data Triangulation
