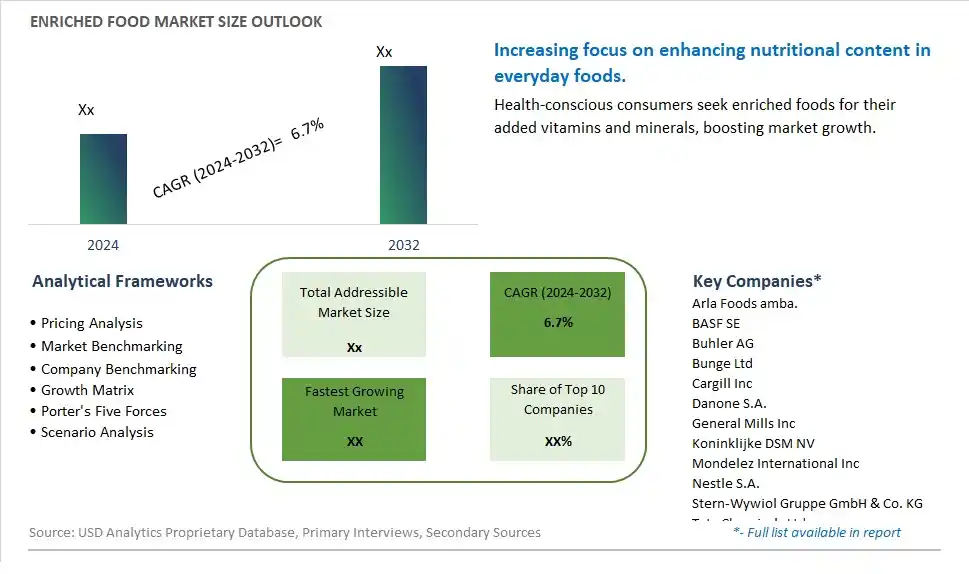
Global Enriched Food Market Size is valued at $XX Million in 2024 and is forecast to register a growth rate (CAGR) of 6.7% to reach $XX Million by 2032.
The global Enriched Food Market Comprehensive Study analyzes and forecasts the market size across 6 regions and 24 countries for diverse segments -By Product (Vitamins, Minerals Cereal-based Products, Dairy Products, Beverages, Infant Formulas, Others), By Application (Basic Food, Processed Food), By Distribution Channel (Supermarket/Hypermarket, Convenience Stores, Drug Store, Online Retail, Others)
An Introduction to Enriched Food Market
The Enriched Food market in 2024 is witnessing significant growth, driven by the increasing demand for nutrient-dense and fortified food products. Enriched foods, which have added vitamins, minerals, and other nutrients, are popular among health-conscious consumers and those with specific dietary needs. The market benefits from advancements in food fortification technologies, the growing trend of health and wellness, and the expansion of the functional food sector. Additionally, the increasing awareness of the benefits of enriched foods for overall health and wellness is contributing to market expansion.
Enriched Food Competitive Landscape
The market report analyses the leading companies in the industry including Arla Foods amba., BASF SE, Buhler AG, Bunge Ltd, Cargill Inc, Danone S.A., General Mills Inc, Koninklijke DSM NV, Mondelez International Inc, Nestle S.A., Stern-Wywiol Gruppe GmbH & Co. KG, Tata Chemicals Ltd, Unilever PLC, and Others.
Enriched Food Market Dynamics
Enriched Food Market Trend: Growing Demand for Functional and Nutrient-Rich Foods
The market for enriched food is experiencing a prominent trend towards the growing demand for functional and nutrient-rich foods. Consumers are increasingly seeking food products that not only provide basic nutrition but also offer additional health benefits, such as vitamins, minerals, antioxidants, omega-3 fatty acids, probiotics, and plant-based nutrients. Enriched foods cater to this trend by fortifying essential nutrients into everyday food items, including cereals, bread, dairy products, beverages, snacks, and ready-to-eat meals, addressing nutritional gaps and supporting overall health and wellness.
Enriched Food Market Driver: Rising Awareness of Health and Nutritional Deficiencies
A major driver for the enriched food market is the rising awareness of health and nutritional deficiencies among consumers. Health-conscious individuals, as well as those following specific dietary patterns or facing dietary restrictions, seek fortified foods as a convenient and effective way to ensure adequate intake of essential nutrients. The drive for preventive healthcare, wellness-focused lifestyles, and personalized nutrition plans fuels the demand for enriched foods as a practical solution to address nutrient deficiencies, support immune function, improve energy levels, and enhance overall nutritional status.
Enriched Food Market Opportunity: Innovation in Fortification Technologies and Targeted Formulations
The enriched food market presents a significant opportunity for innovation in fortification technologies and targeted formulations. Food manufacturers, ingredient suppliers, and nutrition experts can collaborate to develop enriched foods with customized nutrient profiles tailored to specific health benefits, age groups, dietary preferences, and lifestyle needs. This opportunity includes exploring novel fortification methods, such as microencapsulation, nanoemulsions, encapsulation of sensitive nutrients, and controlled-release technologies, to improve nutrient stability, bioavailability, taste, and texture of enriched foods. Additionally, focusing on clean label ingredients, natural fortifiers, sustainable sourcing practices, and transparent labeling can enhance consumer trust, brand loyalty, and market competitiveness in the enriched food segment.
Enriched Food Market Share Analysis: Dairy Products segment generated the highest revenue share in the industry
The largest segment in the Enriched Food Market is Dairy Products. Dairy products such as milk, yogurt, cheese, and butter are integral components of a balanced diet and are commonly enriched with essential vitamins and minerals. They serve as an excellent vehicle for delivering nutrients like calcium, vitamin D, vitamin B12, and potassium, which are crucial for maintaining overall health. Dairy products are widely consumed globally and cater to a diverse range of consumers, including children, adults, and the elderly. Additionally, the versatility of dairy products allows for various enrichment methods, including fortification with omega-3 fatty acids, probiotics, and additional protein, addressing specific nutritional needs and preferences. As awareness of the importance of nutrition grows and consumers seek healthier food options, the demand for enriched dairy products is expected to continue its steady growth trajectory, making it the largest segment in the Enriched Food Market.
Enriched Food Market Share Analysis: Processed Food is the fastest growing segment over the forecast period to 2032
The fastest-growing segment in the Enriched Food Market is Processed Food. Processed food refers to food items that have undergone various methods of preservation, cooking, or packaging to extend shelf life, enhance flavor, and improve convenience. These products often include ready-to-eat meals, snacks, canned goods, frozen foods, and packaged desserts. The growth in the processed food segment can be attributed to several factors. Firstly, busy lifestyles and changing dietary preferences have led to an increased demand for convenient, ready-to-eat food options that are also nutritious. Additionally, advancements in food technology and manufacturing processes have enabled the fortification and enrichment of processed foods with essential vitamins, minerals, fiber, and other nutrients, making them more appealing to health-conscious consumers. As consumers become more aware of the importance of nutrition in overall well-being, the market for enriched processed foods is expected to experience rapid growth, presenting significant opportunities for food manufacturers and retailers to innovate and meet evolving consumer needs.
Enriched Food Market Share Analysis: Supermarket/Hypermarket segment generated the highest revenue share in the industry
The largest segment in the Enriched Food Market's Distribution Channel is Supermarket/Hypermarket. These retail outlets offer a wide range of enriched food products, including vitamins, minerals, fortified cereals, dairy products, beverages, and infant formulas, making them easily accessible to a broad consumer base. Supermarkets and hypermarkets attract customers with their extensive product variety, competitive pricing, promotional offers, and convenient shopping experience. They also benefit from the trust and reliability associated with well-established brands and their focus on providing high-quality, nutritious food options. As consumers increasingly prioritize health and wellness, the demand for enriched food products is expected to grow further, driving the expansion of the supermarket and hypermarket segment within the Enriched Food Market's distribution channels. This growth is fueled by factors such as rising health awareness, lifestyle changes, and the convenience of one-stop shopping for all nutritional needs.
Enriched Food Market Segmentation
By Product
Vitamins
Minerals Cereal-based Products
Dairy Products
Beverages
Infant Formulas
Others
By Application
Basic Food
Processed Food
By Distribution Channel
Supermarket/Hypermarket
Convenience Stores
Drug Store
Online Retail
Others
Countries Analyzed
North America (US, Canada, Mexico)
Europe (Germany, UK, France, Spain, Italy, Russia, Rest of Europe)
Asia Pacific (China, India, Japan, South Korea, Australia, South East Asia, Rest of Asia)
South America (Brazil, Argentina, Rest of South America)
Middle East and Africa (Saudi Arabia, UAE, Rest of Middle East, South Africa, Egypt, Rest of Africa)
Enriched Food Companies Profiled in the Study
Arla Foods amba.
BASF SE
Buhler AG
Bunge Ltd
Cargill Inc
Danone S.A.
General Mills Inc
Koninklijke DSM NV
Mondelez International Inc
Nestle S.A.
Stern-Wywiol Gruppe GmbH & Co. KG
Tata Chemicals Ltd
Unilever PLC
*- List Not Exhaustive
Chapter 1. TABLE OF CONTENTS
Chapter 2. Introduction to Enriched Food Market
2.1. Market Overview
2.2. Key Statistics and Report Highlights
2.3. Scope of the Comprehensive Study
2.3.1. Market Definition
2.3.2 Countries and Regions Covered
2.3.3 Research Objective
2.3.4 Units, Currency, and Conversions
2.3.5 Industry Value Chain
2.4. Key Market Segments
2.5. Key Companies
2.6. Study Period
Chapter 3. Strategic Analysis Review
3.1. Enriched Food Pricing Analysis and Forecast
3.2. Porter’s Five Forces
3.3. Market Ecosystem
3.4. SWOT Analysis
3.5. Regulatory Scenario
3.3. Effects of Inflation, Russia-Ukraine War, moderating economic growth, and other macroeconomic factors
Chapter 4. Competitive Landscape
4.1. Market Share Analysis
4.1.1. Global Enriched Food Market Share by Company, 2023
4.1.2. Product Offerings of Leading Enriched Food Companies
4.2. Market Entropy
4.2.1. New Product Launches in the Industry
4.2.2. Mergers, Acquisitions, Joint ventures, and Partnerships
4.3. Key Strategies and Best Practices
Chapter 5. Global Market Projections: Best, Reference, and Low Case Scenarios
5.1. Growth Analysis- Case Scenario Definitions
5.2. Low Growth Case Scenario Forecasts
5.3. Reference Growth Case Scenario Forecasts
5.4. High Growth Case Scenario Forecasts
Chapter 6. Market Dynamics
6.1. Enriched Food Market Drivers
6.2. Enriched Food Market Challenges
6.6. Enriched Food Market Opportunities
6.4. Enriched Food Market Trends
Chapter 7. Global Enriched Food Market Outlook Trends
7.1. Global Enriched Food Revenue (USD Million) and CAGR (%) by Type (2021-2032)
7.2. Global Enriched Food Revenue (USD Million) and CAGR (%) by Application (2021-2032)
7.3. Global Enriched Food Revenue (USD Million) and CAGR (%) by Product (2021-2032)
By Product
Vitamins
Minerals Cereal-based Products
Dairy Products
Beverages
Infant Formulas
Others
By Application
Basic Food
Processed Food
By Distribution Channel
Supermarket/Hypermarket
Convenience Stores
Drug Store
Online Retail
Others
Chapter 8. Global Enriched Food Regional Analysis and Outlook
8.1. Global Enriched Food Revenue (USD Million) By Regions (2021- 2032)
8.2. North America Enriched Food Revenue (USD Million) by Country (2021-2032)
8.2.1. United States Enriched Food Regional Analysis and Outlook
8.2.2. Canada Enriched Food Regional Analysis and Outlook
8.2.3. Mexico Enriched Food Regional Analysis and Outlook
8.3. Europe Enriched Food Revenue (USD Million), by Country (2021-2032)
8.3.1. Germany Enriched Food Regional Analysis and Outlook
8.3.2. France Enriched Food Regional Analysis and Outlook
8.3.3. United Kingdom Enriched Food Regional Analysis and Outlook
8.3.4. Spain Enriched Food Regional Analysis and Outlook
8.3.5. Italy Enriched Food Regional Analysis and Outlook
8.3.6. Russia Enriched Food Regional Analysis and Outlook
8.3.7. Rest of Europe Enriched Food Regional Analysis and Outlook
8.4. Asia Pacific Enriched Food Revenue (USD Million) by Country (2021-2032)
8.4.1. China Enriched Food Regional Analysis and Outlook
8.4.2. Japan Enriched Food Regional Analysis and Outlook
8.4.3. India Enriched Food Regional Analysis and Outlook
8.4.4. South Korea Enriched Food Regional Analysis and Outlook
8.4.5. Australia Enriched Food Regional Analysis and Outlook
8.4.6. South East Asia Enriched Food Regional Analysis and Outlook
8.4.7. Rest of Asia Pacific Enriched Food Regional Analysis and Outlook
8.5. South America Enriched Food Revenue (USD Million), by Country (2021-2032)
8.5.1. Brazil Enriched Food Regional Analysis and Outlook
8.5.2. Argentina Enriched Food Regional Analysis and Outlook
8.5.3. Rest of South America Enriched Food Regional Analysis and Outlook
8.6. Middle East and Africa Enriched Food Revenue (USD Million) by Country (2021-2032)
8.6.1. Middle East Enriched Food Regional Analysis and Outlook
8.6.2. Africa Enriched Food Regional Analysis and Outlook
Chapter 9. North America Enriched Food Analysis and Outlook
9.1. North America Enriched Food Revenue (USD Million) by Segments (2021-2032)
9.1.1. North America Enriched Food Revenue (USD Million) by Type (2021-2032)
9.1.2. North America Enriched Food Revenue (USD Million) by Application (2021-2032)
9.1.3. North America Enriched Food Revenue (USD Million) by Product (2021-2032)
By Product
Vitamins
Minerals Cereal-based Products
Dairy Products
Beverages
Infant Formulas
Others
By Application
Basic Food
Processed Food
By Distribution Channel
Supermarket/Hypermarket
Convenience Stores
Drug Store
Online Retail
Others
Chapter 10. Europe Enriched Food Analysis and Outlook
10.1. Europe Enriched Food Revenue (USD Million), by Segments (USD Million) (2021-2032)
10.1.1. Europe Enriched Food Revenue (USD Million) by Type (2021-2032)
10.1.2. Europe Enriched Food Revenue (USD Million) by Application (2021-2032)
10.1.3. Europe Enriched Food Revenue (USD Million) by Product (2021-2032)
By Product
Vitamins
Minerals Cereal-based Products
Dairy Products
Beverages
Infant Formulas
Others
By Application
Basic Food
Processed Food
By Distribution Channel
Supermarket/Hypermarket
Convenience Stores
Drug Store
Online Retail
Others
Chapter 11. Asia Pacific Enriched Food Analysis and Outlook
11.1. Asia Pacific Enriched Food Revenue (USD Million), and Revenue (USD Million) by Segments (2021-2032)
11.1.1. Asia Pacific Enriched Food Revenue (USD Million) by Type (2021-2032)
11.1.2. Asia Pacific Enriched Food Revenue (USD Million) by Application (2021-2032)
11.1.3. Asia Pacific Enriched Food Revenue (USD Million) by Product (2021-2032)
By Product
Vitamins
Minerals Cereal-based Products
Dairy Products
Beverages
Infant Formulas
Others
By Application
Basic Food
Processed Food
By Distribution Channel
Supermarket/Hypermarket
Convenience Stores
Drug Store
Online Retail
Others
Chapter 12. South America Enriched Food Analysis and Outlook
12.1. South America Enriched Food Revenue (USD Million), by Segments (2021-2032)
12.1.1. South America Enriched Food Revenue (USD Million) by Type (2021-2032)
12.1.2. South America Enriched Food Revenue (USD Million) by Application (2021-2032)
12.1.3. South America Enriched Food Revenue (USD Million) by Product (2021-2032)
By Product
Vitamins
Minerals Cereal-based Products
Dairy Products
Beverages
Infant Formulas
Others
By Application
Basic Food
Processed Food
By Distribution Channel
Supermarket/Hypermarket
Convenience Stores
Drug Store
Online Retail
Others
Chapter 13. Middle East and Africa Enriched Food Analysis and Outlook
13.1. Middle East and Africa Enriched Food Revenue (USD Million), by Segments (2021-2032)
13.1.1. Middle East and Africa Enriched Food Revenue (USD Million) by Type (2021-2032)
13.1.2. Middle East and Africa Enriched Food Revenue (USD Million) by Application (2021-2032)
13.1.3. Middle East and Africa Enriched Food Revenue (USD Million) by Product (2021-2032)
By Product
Vitamins
Minerals Cereal-based Products
Dairy Products
Beverages
Infant Formulas
Others
By Application
Basic Food
Processed Food
By Distribution Channel
Supermarket/Hypermarket
Convenience Stores
Drug Store
Online Retail
Others
Chapter 14. Enriched Food Company Profiles
14.1 Business Overview
14.2 Product Profiles
14.3 SWOT Profiles
14.5 Recent Developments
14.6 Financial Profile
List of Companies
Arla Foods amba.
BASF SE
Buhler AG
Bunge Ltd
Cargill Inc
Danone S.A.
General Mills Inc
Koninklijke DSM NV
Mondelez International Inc
Nestle S.A.
Stern-Wywiol Gruppe GmbH & Co. KG
Tata Chemicals Ltd
Unilever PLC
15. Methodology and Data Sources
15.1 Customization Offerings
15.2 Subscription Services
15.3 Related Reports
15.4 Publisher Expertise
LIST OF TABLES
Table 1 Market Segmentation Analysis
Table 2 Global Enriched Food Market Share of Leading Companies, 2023
Table 3 Product Offerings of Leading Companies
Table 4 Low Growth Scenario Forecasts
Table 5 Reference Case Growth Scenario
Table 6 High Growth Case Scenario
Table 7 Global Enriched Food Revenue (USD Million) And CAGR (%) By Type (2021-2032)
Table 8 Global Enriched Food Revenue (USD Million) And CAGR (%) By Application (2021-2032)
Table 9 Global Enriched Food Revenue (USD Million) And CAGR (%) By Product (2021-2032)
Table 10 Global Enriched Food Market Revenue (USD Million) By Regions (2021-2032)
Table 11 Global Enriched Food Market Share (%) By Regions (2021-2032)
Table 12 North America Enriched Food Revenue (USD Million) By Country (2021-2032)
Table 13 Europe Enriched Food Revenue (USD Million) By Country (2021-2032)
Table 14 Asia Pacific Enriched Food Revenue (USD Million) By Country (2021-2032)
Table 15 South America Enriched Food Revenue (USD Million) By Country (2021-2032)
Table 16 Middle East and Africa Enriched Food Revenue (USD Million) By Region (2021-2032)
Table 17 North America Enriched Food Revenue (USD Million) By Type (2021-2032)
Table 18 North America Enriched Food Revenue (USD Million) By Application (2021-2032)
Table 19 North America Enriched Food Revenue (USD Million) By Product (2021-2032)
Table 20 Europe Enriched Food Revenue (USD Million) By Type (2021-2032)
Table 21 Europe Enriched Food Revenue (USD Million) By Application (2021-2032)
Table 22 Europe Enriched Food Revenue (USD Million) By Product (2021-2032)
Table 23 Asia Pacific Enriched Food Revenue (USD Million) By Type (2021-2032)
Table 24 Asia Pacific Enriched Food Revenue (USD Million) By Application (2021-2032)
Table 25 Asia Pacific Enriched Food Revenue (USD Million) By Product (2021-2032)
Table 26 South America Enriched Food Revenue (USD Million) By Type (2021-2032)
Table 27 South America Enriched Food Revenue (USD Million) By Application (2021-2032)
Table 28 South America Enriched Food Revenue (USD Million) By Product (2021-2032)
Table 29 Middle East and Africa Enriched Food Revenue (USD Million) By Type (2021-2032)
Table 30 Middle East and Africa Enriched Food Revenue (USD Million) By Application (2021-2032)
Table 31 Middle East and Africa Enriched Food Revenue (USD Million) By Product (2021-2032)
LIST OF FIGURES
Figure 1. Market Scope
Figure 2. Pricing Forecasts Per Unit, 2023- 2032
Figure 3. Porter’s Five Forces
Figure 4. Global Enriched Food Market Revenue (USD Million) By Regions (2021-2032)
Figure 5. Global Enriched Food Market Share (%) By Regions (2023)
Figure 6. North America Enriched Food Revenue (USD Million) By Country (2021-2032)
Figure 7. United States Enriched Food Revenue (USD Million) By Country (2021-2032)
Figure 8. Canada Enriched Food Revenue (USD Million) By Country (2021-2032)
Figure 9. Mexico Enriched Food Revenue (USD Million) By Country (2021-2032)
Figure 10. Europe Enriched Food Revenue (USD Million) By Country (2021-2032)
Figure 11. Germany Enriched Food Revenue (USD Million) By Country (2021-2032)
Figure 12. France Enriched Food Revenue (USD Million) By Country (2021-2032)
Figure 13. United Kingdom Enriched Food Revenue (USD Million) By Country (2021-2032)
Figure 14. Spain Enriched Food Revenue (USD Million) By Country (2021-2032)
Figure 15. Italy Enriched Food Revenue (USD Million) By Country (2021-2032)
Figure 16. Russia Enriched Food Revenue (USD Million) By Country (2021-2032)
Figure 17. Rest of Europe Enriched Food Revenue (USD Million) By Country (2021-2032)
Figure 11. Asia Pacific Enriched Food Revenue (USD Million) By Country (2021-2032)
Figure 12. China Enriched Food Revenue (USD Million) By Country (2021-2032)
Figure 13. Japan Enriched Food Revenue (USD Million) By Country (2021-2032)
Figure 14. India Enriched Food Revenue (USD Million) By Country (2021-2032)
Figure 15. South Korea Enriched Food Revenue (USD Million) By Country (2021-2032)
Figure 16. Australia Enriched Food Revenue (USD Million) By Country (2021-2032)
Figure 17. South East Asia Enriched Food Revenue (USD Million) By Country (2021-2032)
Figure 18. South America Enriched Food Revenue (USD Million) By Country (2021-2032)
Figure 19. Brazil Enriched Food Revenue (USD Million) By Country (2021-2032)
Figure 20. Argentina Enriched Food Revenue (USD Million) By Country (2021-2032)
Figure 21. Rest of Asia Pacific Enriched Food Revenue (USD Million) By Country (2021-2032)
Figure 22. Middle East and Africa Enriched Food Revenue (USD Million) By Region (2021-2032)
Figure 23. Saudi Arabia Enriched Food Revenue (USD Million) By Region (2021-2032)
Figure 24. The UAE Enriched Food Revenue (USD Million) By Region (2021-2032)
Figure 25. Rest of Middle East Enriched Food Revenue (USD Million) By Region (2021-2032)
Figure 26. South Africa Enriched Food Revenue (USD Million) By Region (2021-2032)
Figure 27. Africa Enriched Food Revenue (USD Million) By Region (2021-2032)
Figure 28. North America Enriched Food Revenue (USD Million) By Type (2021-2032)
Figure 29. North America Enriched Food Revenue (USD Million) By Application (2021-2032)
Figure 30. North America Enriched Food Revenue (USD Million) By Product (2021-2032)
Figure 31. Europe Enriched Food Revenue (USD Million) By Type (2021-2032)
Figure 32. Europe Enriched Food Revenue (USD Million) By Application (2021-2032)
Figure 33. Europe Enriched Food Revenue (USD Million) By Product (2021-2032)
Figure 34. Asia Pacific Enriched Food Revenue (USD Million) By Type (2021-2032)
Figure 35. Asia Pacific Enriched Food Revenue (USD Million) By Application (2021-2032)
Figure 36. Asia Pacific Enriched Food Revenue (USD Million) By Product (2021-2032)
Figure 37. South America Enriched Food Revenue (USD Million) By Type (2021-2032)
Figure 38. South America Enriched Food Revenue (USD Million) By Application (2021-2032)
Figure 39. South America Enriched Food Revenue (USD Million) By Product (2021-2032)
Figure 40. Middle East and Africa Enriched Food Revenue (USD Million) By Type (2021-2032)
Figure 41. Middle East and Africa Enriched Food Revenue (USD Million) By Application (2021-2032)
Figure 42. Middle East and Africa Enriched Food Revenue (USD Million) By Product (2021-2032)
By Product
Vitamins
Minerals Cereal-based Products
Dairy Products
Beverages
Infant Formulas
Others
By Application
Basic Food
Processed Food
By Distribution Channel
Supermarket/Hypermarket
Convenience Stores
Drug Store
Online Retail
Others
Countries Analyzed
North America (US, Canada, Mexico)
Europe (Germany, UK, France, Spain, Italy, Russia, Rest of Europe)
Asia Pacific (China, India, Japan, South Korea, Australia, South East Asia, Rest of Asia)
South America (Brazil, Argentina, Rest of South America)
Middle East and Africa (Saudi Arabia, UAE, Rest of Middle East, South Africa, Egypt, Rest of Africa)
