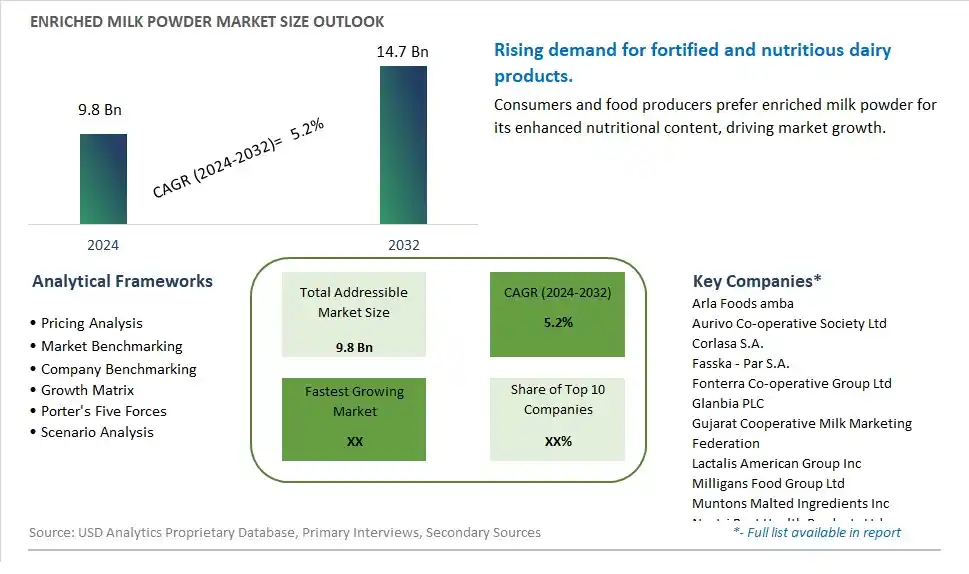
Global Enriched Milk Powder Market Size is valued at $9.8 Billion in 2024 and is forecast to register a growth rate (CAGR) of 5.2% to reach $14.7 Billion by 2032.
The global Enriched Milk Powder Market Comprehensive Study analyzes and forecasts the market size across 6 regions and 24 countries for diverse segments -By Flavor (Regular, Chocolate, Vanilla, Caramel, Others), By Application (Yogurt, Bakery, Ice Cream, Confectionery, Nutrition, Infant Formula, Processed Cheese, Others), By Distribution Channel (Direct Sales, Indirect Sales)
An Introduction to Enriched Milk Powder Market
In 2024, the Enriched Milk Powder market is thriving, fueled by the rising demand for convenient and nutrient-dense dairy products. Enriched milk powder, fortified with essential vitamins and minerals, is popular among health-conscious consumers, infants, and the elderly. The market benefits from advancements in milk fortification and processing technologies, the growing trend of health and wellness, and the expansion of the functional dairy sector. Additionally, the increasing awareness of the benefits of enriched milk powder for overall health and nutrition is driving market growth.
Enriched Milk Powder Competitive Landscape
The market report analyses the leading companies in the industry including Arla Foods amba, Aurivo Co-operative Society Ltd, Corlasa S.A., Fasska - Par S.A., Fonterra Co-operative Group Ltd, Glanbia PLC, Gujarat Cooperative Milk Marketing Federation, Lactalis American Group Inc, Milligans Food Group Ltd, Muntons Malted Ingredients Inc, Nuztri Best Health Products Ltd, Synlait Milk Ltd, Tesco PLC, and Others.
Enriched Milk Powder Market Dynamics
Enriched Milk Powder Market Trend: Shift Towards Fortified and Functional Dairy Products
The market for enriched milk powder is experiencing a prominent trend towards the shift towards fortified and functional dairy products. Consumers are increasingly seeking dairy products that offer additional nutritional benefits beyond basic dairy components. Enriched milk powder caters to this trend by fortifying essential nutrients such as vitamins, minerals, protein, and probiotics into milk powder, providing a convenient and versatile option for consumers to incorporate essential nutrients into their diets while enjoying the familiar taste and versatility of milk.
Enriched Milk Powder Market Driver: Demand for Nutrient-Dense and Convenient Nutrition Sources
A major driver for the enriched milk powder market is the demand for nutrient-dense and convenient nutrition sources. Health-conscious individuals, busy consumers, and those with dietary restrictions or special nutritional needs seek enriched milk powder as a convenient way to enhance their daily nutrient intake. The drive for on-the-go nutrition, functional foods, and wellness-focused diets fuels the demand for enriched milk powder as a practical solution to meet nutrient requirements, support immune health, promote bone strength, and improve overall nutritional status.
Enriched Milk Powder Market Opportunity: Expansion into Targeted Consumer Segments and Applications
The enriched milk powder market presents a significant opportunity for expansion into targeted consumer segments and applications. Companies specializing in dairy products can innovate by developing enriched milk powder variants tailored to specific consumer needs, preferences, and dietary goals. This opportunity includes exploring formulations for infant and toddler nutrition, sports and performance nutrition, senior health, immune support, weight management, and specialty diets. Additionally, expanding distribution channels, partnerships with healthcare providers, and marketing strategies targeting diverse consumer demographics can help capture untapped market segments and drive growth in the enriched milk powder segment.
Enriched Milk Powder Market Share Analysis: Regular segment generated the highest revenue share in the industry
The largest segment in the Enriched Milk Powder Market's Flavor category is Regular. Regular flavored enriched milk powder is a staple choice among consumers due to its versatility and widespread use in various applications. It appeals to a broad demographic, including children, adults, and seniors, making it a popular choice for households and foodservice establishments alike. The Regular flavor offers a balanced and familiar taste profile, making it suitable for consumption on its own or as an ingredient in a wide range of recipes and beverages. Its widespread availability, affordability, and nutritional benefits contribute to its dominance in the enriched milk powder market. As consumers continue to prioritize health and wellness, the demand for enriched milk powder with added vitamins, minerals, and other nutrients is expected to rise, further consolidating the position of the Regular flavor segment in the market.
Enriched Milk Powder Market Share Analysis: Nutrition is the fastest growing segment over the forecast period to 2032
The fastest-growing segment in the Enriched Milk Powder Market's Application category is Nutrition. This segment encompasses enriched milk powder formulations specifically designed to enhance the nutritional content of various food and beverage products. With increasing consumer awareness about the importance of balanced nutrition and the role of fortified foods in meeting dietary needs, the demand for enriched milk powder in the nutrition segment is experiencing rapid growth. Enriched milk powder is commonly used in nutrition bars, functional beverages, and dietary supplements to provide essential vitamins, minerals, protein, and other nutrients. The Nutrition segment is expected to witness substantial growth as health-conscious consumers seek convenient and accessible ways to boost their nutritional intake. This trend is further fueled by the aging population, growing interest in sports nutrition, and rising demand for infant formula with added nutrients. Manufacturers are innovating to develop enriched milk powder formulations tailored to specific nutritional requirements, driving the expansion of the Nutrition segment in the enriched milk powder market.
Enriched Milk Powder Market Share Analysis: Indirect Sales segment generated the highest revenue share in the industry
The largest segment in the Enriched Milk Powder Market's Distribution Channel category is Indirect Sales. Indirect sales refer to the distribution of enriched milk powder through various channels such as wholesalers, distributors, retailers, and online platforms. This segment encompasses a wide range of distribution channels, including supermarkets, hypermarkets, convenience stores, specialty stores, drug stores, and e-commerce platforms. Indirect sales play a crucial role in reaching a diverse consumer base and expanding market reach. These channels offer convenience, accessibility, and a wider product assortment, attracting consumers seeking enriched milk powder products for various applications. Additionally, indirect sales channels often provide promotional activities, discounts, and loyalty programs, further driving consumer engagement and sales growth. As the demand for enriched milk powder continues to rise globally, especially in emerging markets with a growing middle-class population and increasing health awareness, the Indirect Sales segment is expected to maintain its position as the largest and most significant distribution channel for enriched milk powder products.
Enriched Milk Powder Market Segmentation
By Flavor
Regular
Chocolate
Vanilla
Caramel
Others
By Application
Yogurt
Bakery
Ice Cream
Confectionery
Nutrition
Infant Formula
Processed Cheese
Others
By Distribution Channel
Direct Sales
Indirect Sales
Countries Analyzed
North America (US, Canada, Mexico)
Europe (Germany, UK, France, Spain, Italy, Russia, Rest of Europe)
Asia Pacific (China, India, Japan, South Korea, Australia, South East Asia, Rest of Asia)
South America (Brazil, Argentina, Rest of South America)
Middle East and Africa (Saudi Arabia, UAE, Rest of Middle East, South Africa, Egypt, Rest of Africa)
Enriched Milk Powder Companies Profiled in the Study
Arla Foods amba
Aurivo Co-operative Society Ltd
Corlasa S.A.
Fasska - Par S.A.
Fonterra Co-operative Group Ltd
Glanbia PLC
Gujarat Cooperative Milk Marketing Federation
Lactalis American Group Inc
Milligans Food Group Ltd
Muntons Malted Ingredients Inc
Nuztri Best Health Products Ltd
Synlait Milk Ltd
Tesco PLC
*- List Not Exhaustive
Chapter 1. TABLE OF CONTENTS
Chapter 2. Introduction to Enriched Milk Powder Market
2.1. Market Overview
2.2. Key Statistics and Report Highlights
2.3. Scope of the Comprehensive Study
2.3.1. Market Definition
2.3.2 Countries and Regions Covered
2.3.3 Research Objective
2.3.4 Units, Currency, and Conversions
2.3.5 Industry Value Chain
2.4. Key Market Segments
2.5. Key Companies
2.6. Study Period
Chapter 3. Strategic Analysis Review
3.1. Enriched Milk Powder Pricing Analysis and Forecast
3.2. Porter’s Five Forces
3.3. Market Ecosystem
3.4. SWOT Analysis
3.5. Regulatory Scenario
3.3. Effects of Inflation, Russia-Ukraine War, moderating economic growth, and other macroeconomic factors
Chapter 4. Competitive Landscape
4.1. Market Share Analysis
4.1.1. Global Enriched Milk Powder Market Share by Company, 2023
4.1.2. Product Offerings of Leading Enriched Milk Powder Companies
4.2. Market Entropy
4.2.1. New Product Launches in the Industry
4.2.2. Mergers, Acquisitions, Joint ventures, and Partnerships
4.3. Key Strategies and Best Practices
Chapter 5. Global Market Projections: Best, Reference, and Low Case Scenarios
5.1. Growth Analysis- Case Scenario Definitions
5.2. Low Growth Case Scenario Forecasts
5.3. Reference Growth Case Scenario Forecasts
5.4. High Growth Case Scenario Forecasts
Chapter 6. Market Dynamics
6.1. Enriched Milk Powder Market Drivers
6.2. Enriched Milk Powder Market Challenges
6.6. Enriched Milk Powder Market Opportunities
6.4. Enriched Milk Powder Market Trends
Chapter 7. Global Enriched Milk Powder Market Outlook Trends
7.1. Global Enriched Milk Powder Revenue (USD Million) and CAGR (%) by Type (2021-2032)
7.2. Global Enriched Milk Powder Revenue (USD Million) and CAGR (%) by Application (2021-2032)
7.3. Global Enriched Milk Powder Revenue (USD Million) and CAGR (%) by Product (2021-2032)
By Flavor
Regular
Chocolate
Vanilla
Caramel
Others
By Application
Yogurt
Bakery
Ice Cream
Confectionery
Nutrition
Infant Formula
Processed Cheese
Others
By Distribution Channel
Direct Sales
Indirect Sales
Chapter 8. Global Enriched Milk Powder Regional Analysis and Outlook
8.1. Global Enriched Milk Powder Revenue (USD Million) By Regions (2021- 2032)
8.2. North America Enriched Milk Powder Revenue (USD Million) by Country (2021-2032)
8.2.1. United States Enriched Milk Powder Regional Analysis and Outlook
8.2.2. Canada Enriched Milk Powder Regional Analysis and Outlook
8.2.3. Mexico Enriched Milk Powder Regional Analysis and Outlook
8.3. Europe Enriched Milk Powder Revenue (USD Million), by Country (2021-2032)
8.3.1. Germany Enriched Milk Powder Regional Analysis and Outlook
8.3.2. France Enriched Milk Powder Regional Analysis and Outlook
8.3.3. United Kingdom Enriched Milk Powder Regional Analysis and Outlook
8.3.4. Spain Enriched Milk Powder Regional Analysis and Outlook
8.3.5. Italy Enriched Milk Powder Regional Analysis and Outlook
8.3.6. Russia Enriched Milk Powder Regional Analysis and Outlook
8.3.7. Rest of Europe Enriched Milk Powder Regional Analysis and Outlook
8.4. Asia Pacific Enriched Milk Powder Revenue (USD Million) by Country (2021-2032)
8.4.1. China Enriched Milk Powder Regional Analysis and Outlook
8.4.2. Japan Enriched Milk Powder Regional Analysis and Outlook
8.4.3. India Enriched Milk Powder Regional Analysis and Outlook
8.4.4. South Korea Enriched Milk Powder Regional Analysis and Outlook
8.4.5. Australia Enriched Milk Powder Regional Analysis and Outlook
8.4.6. South East Asia Enriched Milk Powder Regional Analysis and Outlook
8.4.7. Rest of Asia Pacific Enriched Milk Powder Regional Analysis and Outlook
8.5. South America Enriched Milk Powder Revenue (USD Million), by Country (2021-2032)
8.5.1. Brazil Enriched Milk Powder Regional Analysis and Outlook
8.5.2. Argentina Enriched Milk Powder Regional Analysis and Outlook
8.5.3. Rest of South America Enriched Milk Powder Regional Analysis and Outlook
8.6. Middle East and Africa Enriched Milk Powder Revenue (USD Million) by Country (2021-2032)
8.6.1. Middle East Enriched Milk Powder Regional Analysis and Outlook
8.6.2. Africa Enriched Milk Powder Regional Analysis and Outlook
Chapter 9. North America Enriched Milk Powder Analysis and Outlook
9.1. North America Enriched Milk Powder Revenue (USD Million) by Segments (2021-2032)
9.1.1. North America Enriched Milk Powder Revenue (USD Million) by Type (2021-2032)
9.1.2. North America Enriched Milk Powder Revenue (USD Million) by Application (2021-2032)
9.1.3. North America Enriched Milk Powder Revenue (USD Million) by Product (2021-2032)
By Flavor
Regular
Chocolate
Vanilla
Caramel
Others
By Application
Yogurt
Bakery
Ice Cream
Confectionery
Nutrition
Infant Formula
Processed Cheese
Others
By Distribution Channel
Direct Sales
Indirect Sales
Chapter 10. Europe Enriched Milk Powder Analysis and Outlook
10.1. Europe Enriched Milk Powder Revenue (USD Million), by Segments (USD Million) (2021-2032)
10.1.1. Europe Enriched Milk Powder Revenue (USD Million) by Type (2021-2032)
10.1.2. Europe Enriched Milk Powder Revenue (USD Million) by Application (2021-2032)
10.1.3. Europe Enriched Milk Powder Revenue (USD Million) by Product (2021-2032)
By Flavor
Regular
Chocolate
Vanilla
Caramel
Others
By Application
Yogurt
Bakery
Ice Cream
Confectionery
Nutrition
Infant Formula
Processed Cheese
Others
By Distribution Channel
Direct Sales
Indirect Sales
Chapter 11. Asia Pacific Enriched Milk Powder Analysis and Outlook
11.1. Asia Pacific Enriched Milk Powder Revenue (USD Million), and Revenue (USD Million) by Segments (2021-2032)
11.1.1. Asia Pacific Enriched Milk Powder Revenue (USD Million) by Type (2021-2032)
11.1.2. Asia Pacific Enriched Milk Powder Revenue (USD Million) by Application (2021-2032)
11.1.3. Asia Pacific Enriched Milk Powder Revenue (USD Million) by Product (2021-2032)
By Flavor
Regular
Chocolate
Vanilla
Caramel
Others
By Application
Yogurt
Bakery
Ice Cream
Confectionery
Nutrition
Infant Formula
Processed Cheese
Others
By Distribution Channel
Direct Sales
Indirect Sales
Chapter 12. South America Enriched Milk Powder Analysis and Outlook
12.1. South America Enriched Milk Powder Revenue (USD Million), by Segments (2021-2032)
12.1.1. South America Enriched Milk Powder Revenue (USD Million) by Type (2021-2032)
12.1.2. South America Enriched Milk Powder Revenue (USD Million) by Application (2021-2032)
12.1.3. South America Enriched Milk Powder Revenue (USD Million) by Product (2021-2032)
By Flavor
Regular
Chocolate
Vanilla
Caramel
Others
By Application
Yogurt
Bakery
Ice Cream
Confectionery
Nutrition
Infant Formula
Processed Cheese
Others
By Distribution Channel
Direct Sales
Indirect Sales
Chapter 13. Middle East and Africa Enriched Milk Powder Analysis and Outlook
13.1. Middle East and Africa Enriched Milk Powder Revenue (USD Million), by Segments (2021-2032)
13.1.1. Middle East and Africa Enriched Milk Powder Revenue (USD Million) by Type (2021-2032)
13.1.2. Middle East and Africa Enriched Milk Powder Revenue (USD Million) by Application (2021-2032)
13.1.3. Middle East and Africa Enriched Milk Powder Revenue (USD Million) by Product (2021-2032)
By Flavor
Regular
Chocolate
Vanilla
Caramel
Others
By Application
Yogurt
Bakery
Ice Cream
Confectionery
Nutrition
Infant Formula
Processed Cheese
Others
By Distribution Channel
Direct Sales
Indirect Sales
Chapter 14. Enriched Milk Powder Company Profiles
14.1 Business Overview
14.2 Product Profiles
14.3 SWOT Profiles
14.5 Recent Developments
14.6 Financial Profile
List of Companies
Arla Foods amba
Aurivo Co-operative Society Ltd
Corlasa S.A.
Fasska - Par S.A.
Fonterra Co-operative Group Ltd
Glanbia PLC
Gujarat Cooperative Milk Marketing Federation
Lactalis American Group Inc
Milligans Food Group Ltd
Muntons Malted Ingredients Inc
Nuztri Best Health Products Ltd
Synlait Milk Ltd
Tesco PLC
15. Methodology and Data Sources
15.1 Customization Offerings
15.2 Subscription Services
15.3 Related Reports
15.4 Publisher Expertise
LIST OF TABLES
Table 1 Market Segmentation Analysis
Table 2 Global Enriched Milk Powder Market Share of Leading Companies, 2023
Table 3 Product Offerings of Leading Companies
Table 4 Low Growth Scenario Forecasts
Table 5 Reference Case Growth Scenario
Table 6 High Growth Case Scenario
Table 7 Global Enriched Milk Powder Revenue (USD Million) And CAGR (%) By Type (2021-2032)
Table 8 Global Enriched Milk Powder Revenue (USD Million) And CAGR (%) By Application (2021-2032)
Table 9 Global Enriched Milk Powder Revenue (USD Million) And CAGR (%) By Product (2021-2032)
Table 10 Global Enriched Milk Powder Market Revenue (USD Million) By Regions (2021-2032)
Table 11 Global Enriched Milk Powder Market Share (%) By Regions (2021-2032)
Table 12 North America Enriched Milk Powder Revenue (USD Million) By Country (2021-2032)
Table 13 Europe Enriched Milk Powder Revenue (USD Million) By Country (2021-2032)
Table 14 Asia Pacific Enriched Milk Powder Revenue (USD Million) By Country (2021-2032)
Table 15 South America Enriched Milk Powder Revenue (USD Million) By Country (2021-2032)
Table 16 Middle East and Africa Enriched Milk Powder Revenue (USD Million) By Region (2021-2032)
Table 17 North America Enriched Milk Powder Revenue (USD Million) By Type (2021-2032)
Table 18 North America Enriched Milk Powder Revenue (USD Million) By Application (2021-2032)
Table 19 North America Enriched Milk Powder Revenue (USD Million) By Product (2021-2032)
Table 20 Europe Enriched Milk Powder Revenue (USD Million) By Type (2021-2032)
Table 21 Europe Enriched Milk Powder Revenue (USD Million) By Application (2021-2032)
Table 22 Europe Enriched Milk Powder Revenue (USD Million) By Product (2021-2032)
Table 23 Asia Pacific Enriched Milk Powder Revenue (USD Million) By Type (2021-2032)
Table 24 Asia Pacific Enriched Milk Powder Revenue (USD Million) By Application (2021-2032)
Table 25 Asia Pacific Enriched Milk Powder Revenue (USD Million) By Product (2021-2032)
Table 26 South America Enriched Milk Powder Revenue (USD Million) By Type (2021-2032)
Table 27 South America Enriched Milk Powder Revenue (USD Million) By Application (2021-2032)
Table 28 South America Enriched Milk Powder Revenue (USD Million) By Product (2021-2032)
Table 29 Middle East and Africa Enriched Milk Powder Revenue (USD Million) By Type (2021-2032)
Table 30 Middle East and Africa Enriched Milk Powder Revenue (USD Million) By Application (2021-2032)
Table 31 Middle East and Africa Enriched Milk Powder Revenue (USD Million) By Product (2021-2032)
LIST OF FIGURES
Figure 1. Market Scope
Figure 2. Pricing Forecasts Per Unit, 2023- 2032
Figure 3. Porter’s Five Forces
Figure 4. Global Enriched Milk Powder Market Revenue (USD Million) By Regions (2021-2032)
Figure 5. Global Enriched Milk Powder Market Share (%) By Regions (2023)
Figure 6. North America Enriched Milk Powder Revenue (USD Million) By Country (2021-2032)
Figure 7. United States Enriched Milk Powder Revenue (USD Million) By Country (2021-2032)
Figure 8. Canada Enriched Milk Powder Revenue (USD Million) By Country (2021-2032)
Figure 9. Mexico Enriched Milk Powder Revenue (USD Million) By Country (2021-2032)
Figure 10. Europe Enriched Milk Powder Revenue (USD Million) By Country (2021-2032)
Figure 11. Germany Enriched Milk Powder Revenue (USD Million) By Country (2021-2032)
Figure 12. France Enriched Milk Powder Revenue (USD Million) By Country (2021-2032)
Figure 13. United Kingdom Enriched Milk Powder Revenue (USD Million) By Country (2021-2032)
Figure 14. Spain Enriched Milk Powder Revenue (USD Million) By Country (2021-2032)
Figure 15. Italy Enriched Milk Powder Revenue (USD Million) By Country (2021-2032)
Figure 16. Russia Enriched Milk Powder Revenue (USD Million) By Country (2021-2032)
Figure 17. Rest of Europe Enriched Milk Powder Revenue (USD Million) By Country (2021-2032)
Figure 11. Asia Pacific Enriched Milk Powder Revenue (USD Million) By Country (2021-2032)
Figure 12. China Enriched Milk Powder Revenue (USD Million) By Country (2021-2032)
Figure 13. Japan Enriched Milk Powder Revenue (USD Million) By Country (2021-2032)
Figure 14. India Enriched Milk Powder Revenue (USD Million) By Country (2021-2032)
Figure 15. South Korea Enriched Milk Powder Revenue (USD Million) By Country (2021-2032)
Figure 16. Australia Enriched Milk Powder Revenue (USD Million) By Country (2021-2032)
Figure 17. South East Asia Enriched Milk Powder Revenue (USD Million) By Country (2021-2032)
Figure 18. South America Enriched Milk Powder Revenue (USD Million) By Country (2021-2032)
Figure 19. Brazil Enriched Milk Powder Revenue (USD Million) By Country (2021-2032)
Figure 20. Argentina Enriched Milk Powder Revenue (USD Million) By Country (2021-2032)
Figure 21. Rest of Asia Pacific Enriched Milk Powder Revenue (USD Million) By Country (2021-2032)
Figure 22. Middle East and Africa Enriched Milk Powder Revenue (USD Million) By Region (2021-2032)
Figure 23. Saudi Arabia Enriched Milk Powder Revenue (USD Million) By Region (2021-2032)
Figure 24. The UAE Enriched Milk Powder Revenue (USD Million) By Region (2021-2032)
Figure 25. Rest of Middle East Enriched Milk Powder Revenue (USD Million) By Region (2021-2032)
Figure 26. South Africa Enriched Milk Powder Revenue (USD Million) By Region (2021-2032)
Figure 27. Africa Enriched Milk Powder Revenue (USD Million) By Region (2021-2032)
Figure 28. North America Enriched Milk Powder Revenue (USD Million) By Type (2021-2032)
Figure 29. North America Enriched Milk Powder Revenue (USD Million) By Application (2021-2032)
Figure 30. North America Enriched Milk Powder Revenue (USD Million) By Product (2021-2032)
Figure 31. Europe Enriched Milk Powder Revenue (USD Million) By Type (2021-2032)
Figure 32. Europe Enriched Milk Powder Revenue (USD Million) By Application (2021-2032)
Figure 33. Europe Enriched Milk Powder Revenue (USD Million) By Product (2021-2032)
Figure 34. Asia Pacific Enriched Milk Powder Revenue (USD Million) By Type (2021-2032)
Figure 35. Asia Pacific Enriched Milk Powder Revenue (USD Million) By Application (2021-2032)
Figure 36. Asia Pacific Enriched Milk Powder Revenue (USD Million) By Product (2021-2032)
Figure 37. South America Enriched Milk Powder Revenue (USD Million) By Type (2021-2032)
Figure 38. South America Enriched Milk Powder Revenue (USD Million) By Application (2021-2032)
Figure 39. South America Enriched Milk Powder Revenue (USD Million) By Product (2021-2032)
Figure 40. Middle East and Africa Enriched Milk Powder Revenue (USD Million) By Type (2021-2032)
Figure 41. Middle East and Africa Enriched Milk Powder Revenue (USD Million) By Application (2021-2032)
Figure 42. Middle East and Africa Enriched Milk Powder Revenue (USD Million) By Product (2021-2032)
By Flavor
Regular
Chocolate
Vanilla
Caramel
Others
By Application
Yogurt
Bakery
Ice Cream
Confectionery
Nutrition
Infant Formula
Processed Cheese
Others
By Distribution Channel
Direct Sales
Indirect Sales
Countries Analyzed
North America (US, Canada, Mexico)
Europe (Germany, UK, France, Spain, Italy, Russia, Rest of Europe)
Asia Pacific (China, India, Japan, South Korea, Australia, South East Asia, Rest of Asia)
South America (Brazil, Argentina, Rest of South America)
Middle East and Africa (Saudi Arabia, UAE, Rest of Middle East, South Africa, Egypt, Rest of Africa)
