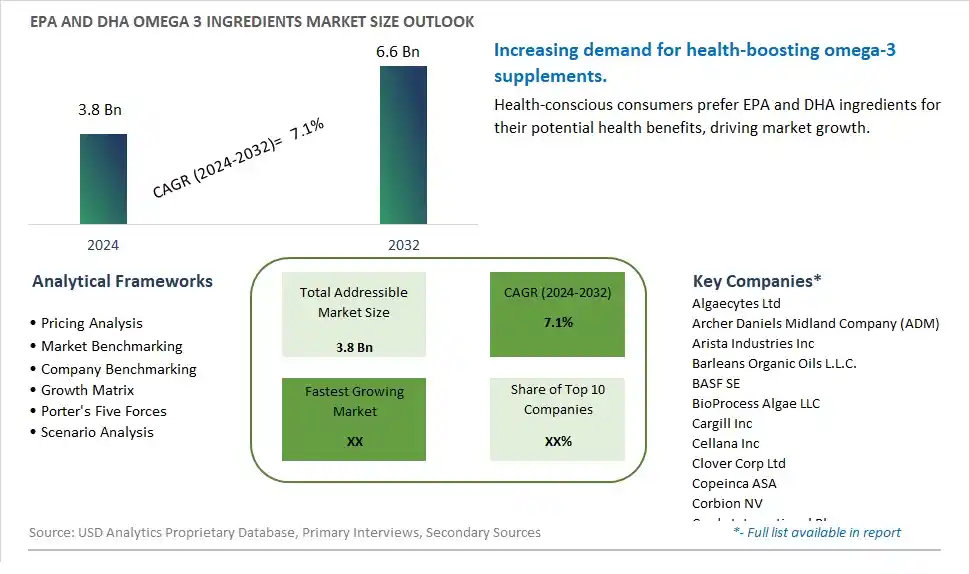
Global EPA and DHA Omega 3 Ingredients Market Size is valued at $3.8 Billion in 2024 and is forecast to register a growth rate (CAGR) of 7.1% to reach $6.6 Billion by 2032.
The global EPA and DHA Omega 3 Ingredients Market Comprehensive Study analyzes and forecasts the market size across 6 regions and 24 countries for diverse segments -By Source (Fish Oil, Algae Oil), By Grade (Technical Grade, Food Grade, Pharma Grade, Feed Grade), By End-User (Food & Beverages, Dietary Supplements, Infant Formula, Pharmaceuticals, Animal Feed, Others)
An Introduction to EPA and DHA Omega 3 Ingredients Market
In 2024, the EPA and DHA Omega 3 Ingredients market is witnessing significant growth, driven by the increasing awareness of the health benefits of omega-3 fatty acids. EPA and DHA, essential for cardiovascular, brain, and joint health, are popular in dietary supplements, functional foods, and infant nutrition. The market benefits from advancements in extraction and formulation technologies, the growing trend of health and wellness, and the expansion of the nutraceutical sector. Additionally, the increasing demand for plant-based and sustainable sources of omega-3 is contributing to market expansion.
EPA and DHA Omega 3 Ingredients Competitive Landscape
The market report analyses the leading companies in the industry including Algaecytes Ltd, Archer Daniels Midland Company (ADM), Arista Industries Inc, Barleans Organic Oils L.L.C., BASF SE, BioProcess Algae LLC, Cargill Inc, Cellana Inc, Clover Corp Ltd, Copeinca ASA, Corbion NV, Croda International Plc, Denomega Nutritional Oils, Epax Norway AS, GC Rieber Oils AS, KD Pharma Group, Luhua Biomarine (Shandong) Co. Ltd, Marine Ingredients LLC, Neptune Wellness Solutions, Novasep Holding SAS, Novotech Nutraceuticals, Omega Protein Corp, Pharma Marine AS, Polaris Nutritional Lipids, Qponics Ltd, Qualitas Health, and Others.
EPA and DHA Omega 3 Ingredients Market Dynamics
EPA and DHA Omega 3 Ingredients Market Trend: Increasing Awareness of Omega-3 Health Benefits
The market for EPA and DHA Omega-3 ingredients is experiencing a prominent trend towards the increasing awareness of Omega-3 health benefits. Consumers are becoming more educated about the positive impact of EPA (eicosapentaenoic acid) and DHA (docosahexaenoic acid) Omega-3 fatty acids on heart health, brain function, and overall well-being. As a result, there is a growing demand for food and supplements fortified with EPA and DHA Omega-3 ingredients, driving market growth and product innovation in the Omega-3 industry.
EPA and DHA Omega 3 Ingredients Market Driver: Consumer Focus on Preventive Healthcare and Wellness
A major driver for the EPA and DHA Omega-3 ingredients market is the consumer focus on preventive healthcare and wellness. With an increasing emphasis on maintaining a healthy lifestyle and preventing chronic diseases, consumers are actively seeking nutritional solutions that support cardiovascular health, cognitive function, and inflammatory response. EPA and DHA Omega-3 ingredients are recognized for their role in promoting heart health, brain development, and reducing inflammation, driving the demand for Omega-3 fortified products in the food, beverage, and dietary supplement sectors.
EPA and DHA Omega 3 Ingredients Market Opportunity: Expansion into Functional Foods and Personalized Nutrition
The EPA and DHA Omega-3 ingredients market presents a significant opportunity for expansion into functional foods and personalized nutrition. Food manufacturers, supplement companies, and healthcare providers can collaborate to develop innovative products that deliver targeted doses of EPA and DHA Omega-3s to meet specific health goals and consumer preferences. This opportunity includes formulating functional foods such as Omega-3 fortified beverages, snacks, cereals, and dairy products, as well as personalized nutrition solutions tailored to different life stages, health conditions, and dietary needs. Additionally, leveraging scientific research, sustainable sourcing practices, and consumer education initiatives can further enhance market penetration, product differentiation, and consumer adoption of EPA and DHA Omega-3 ingredients.
EPA and DHA Omega 3 Ingredients Market Share Analysis: Fish Oil segment generated the highest revenue share in the industry
Fish Oil stands out as the largest segment in the EPA and DHA Omega 3 Ingredients Market. This is primarily due to its widespread availability and historical usage in dietary supplements and functional food products. Fish Oil, extracted from fatty fish like salmon, mackerel, and sardines, is rich in EPA (Eicosapentaenoic Acid) and DHA (Docosahexaenoic Acid), essential omega-3 fatty acids known for their numerous health benefits, including cardiovascular health, cognitive function, and inflammatory response regulation. Fish Oil has been extensively studied and validated for its efficacy, leading to its popularity among consumers seeking natural sources of EPA and DHA. Further, the established supply chain and production infrastructure for fish oil contribute to its dominance in the EPA and DHA Omega 3 Ingredients Market. As the awareness of omega-3 benefits continues to grow and the demand for dietary supplements rises, Fish Oil is expected to maintain its position as the largest segment in the market.
EPA and DHA Omega 3 Ingredients Market Share Analysis: Pharma Grade is the fastest growing segment over the forecast period to 2032
Pharma Grade EPA and DHA Omega 3 Ingredients emerge as the fastest-growing segment in the market. This grade is witnessing rapid growth due to increasing demand from the pharmaceutical industry for incorporating omega-3 fatty acids into various medications and supplements. Pharma Grade ingredients undergo stringent quality control measures and adhere to pharmaceutical standards, ensuring purity, potency, and safety for therapeutic use. The rising prevalence of chronic diseases like cardiovascular disorders, cognitive impairments, and inflammatory conditions has spurred the pharmaceutical sector's interest in formulating omega-3-based drugs and supplements. Additionally, ongoing research and clinical trials showcasing the potential health benefits of EPA and DHA in managing these health conditions further drive the demand for Pharma Grade omega-3 ingredients. As healthcare awareness increases and the trend toward preventive healthcare gains momentum, the Pharma Grade segment is anticipated to continue its robust growth trajectory in the EPA and DHA Omega 3 Ingredients Market, making it a significant player in the market landscape.
EPA and DHA Omega 3 Ingredients Market Share Analysis: Dietary Supplements segment generated the highest revenue share in the industry
The largest segment in the EPA and DHA Omega 3 Ingredients Market is Dietary Supplements. This segment experiences robust growth due to increasing consumer awareness of the health benefits associated with omega-3 fatty acids. Dietary supplements fortified with EPA and DHA are popular among health-conscious individuals seeking to improve cardiovascular health, cognitive function, and overall well-being. The growing aging population and rising incidences of lifestyle-related diseases have fueled the demand for omega-3 supplements globally. Further, advancements in formulation techniques and innovative product offerings, such as flavored and easy-to-consume supplements, have further driven the market's growth. The Dietary Supplements segment caters to a wide range of consumers, including athletes, fitness enthusiasts, pregnant women, and individuals looking to support their immune system and joint health. As the trend toward preventive healthcare continues to gain traction, the demand for EPA and DHA Omega 3 ingredients in dietary supplements is expected to maintain its dominance and contribute significantly to the market's overall growth.
EPA and DHA Omega 3 Ingredients Market Segmentation
By Source
Fish Oil
Algae Oil
By Grade
Technical Grade
Food Grade
Pharma Grade
Feed Grade
By End-User
Food & Beverages
Dietary Supplements
Infant Formula
Pharmaceuticals
Animal Feed
Others
Countries Analyzed
North America (US, Canada, Mexico)
Europe (Germany, UK, France, Spain, Italy, Russia, Rest of Europe)
Asia Pacific (China, India, Japan, South Korea, Australia, South East Asia, Rest of Asia)
South America (Brazil, Argentina, Rest of South America)
Middle East and Africa (Saudi Arabia, UAE, Rest of Middle East, South Africa, Egypt, Rest of Africa)
EPA and DHA Omega 3 Ingredients Companies Profiled in the Study
Algaecytes Ltd
Archer Daniels Midland Company (ADM)
Arista Industries Inc
Barleans Organic Oils L.L.C.
BASF SE
BioProcess Algae LLC
Cargill Inc
Cellana Inc
Clover Corp Ltd
Copeinca ASA
Corbion NV
Croda International Plc
Denomega Nutritional Oils
Epax Norway AS
GC Rieber Oils AS
KD Pharma Group
Luhua Biomarine (Shandong) Co. Ltd
Marine Ingredients LLC
Neptune Wellness Solutions
Novasep Holding SAS
Novotech Nutraceuticals
Omega Protein Corp
Pharma Marine AS
Polaris Nutritional Lipids
Qponics Ltd
Qualitas Health
*- List Not Exhaustive
Chapter 1. TABLE OF CONTENTS
Chapter 2. Introduction to EPA and DHA Omega 3 Ingredients Market
2.1. Market Overview
2.2. Key Statistics and Report Highlights
2.3. Scope of the Comprehensive Study
2.3.1. Market Definition
2.3.2 Countries and Regions Covered
2.3.3 Research Objective
2.3.4 Units, Currency, and Conversions
2.3.5 Industry Value Chain
2.4. Key Market Segments
2.5. Key Companies
2.6. Study Period
Chapter 3. Strategic Analysis Review
3.1. EPA and DHA Omega 3 Ingredients Pricing Analysis and Forecast
3.2. Porter’s Five Forces
3.3. Market Ecosystem
3.4. SWOT Analysis
3.5. Regulatory Scenario
3.3. Effects of Inflation, Russia-Ukraine War, moderating economic growth, and other macroeconomic factors
Chapter 4. Competitive Landscape
4.1. Market Share Analysis
4.1.1. Global EPA and DHA Omega 3 Ingredients Market Share by Company, 2023
4.1.2. Product Offerings of Leading EPA and DHA Omega 3 Ingredients Companies
4.2. Market Entropy
4.2.1. New Product Launches in the Industry
4.2.2. Mergers, Acquisitions, Joint ventures, and Partnerships
4.3. Key Strategies and Best Practices
Chapter 5. Global Market Projections: Best, Reference, and Low Case Scenarios
5.1. Growth Analysis- Case Scenario Definitions
5.2. Low Growth Case Scenario Forecasts
5.3. Reference Growth Case Scenario Forecasts
5.4. High Growth Case Scenario Forecasts
Chapter 6. Market Dynamics
6.1. EPA and DHA Omega 3 Ingredients Market Drivers
6.2. EPA and DHA Omega 3 Ingredients Market Challenges
6.6. EPA and DHA Omega 3 Ingredients Market Opportunities
6.4. EPA and DHA Omega 3 Ingredients Market Trends
Chapter 7. Global EPA and DHA Omega 3 Ingredients Market Outlook Trends
7.1. Global EPA and DHA Omega 3 Ingredients Revenue (USD Million) and CAGR (%) by Type (2021-2032)
7.2. Global EPA and DHA Omega 3 Ingredients Revenue (USD Million) and CAGR (%) by Application (2021-2032)
7.3. Global EPA and DHA Omega 3 Ingredients Revenue (USD Million) and CAGR (%) by Product (2021-2032)
By Source
Fish Oil
Algae Oil
By Grade
Technical Grade
Food Grade
Pharma Grade
Feed Grade
By End-User
Food & Beverages
Dietary Supplements
Infant Formula
Pharmaceuticals
Animal Feed
Others
Chapter 8. Global EPA and DHA Omega 3 Ingredients Regional Analysis and Outlook
8.1. Global EPA and DHA Omega 3 Ingredients Revenue (USD Million) By Regions (2021- 2032)
8.2. North America EPA and DHA Omega 3 Ingredients Revenue (USD Million) by Country (2021-2032)
8.2.1. United States EPA and DHA Omega 3 Ingredients Regional Analysis and Outlook
8.2.2. Canada EPA and DHA Omega 3 Ingredients Regional Analysis and Outlook
8.2.3. Mexico EPA and DHA Omega 3 Ingredients Regional Analysis and Outlook
8.3. Europe EPA and DHA Omega 3 Ingredients Revenue (USD Million), by Country (2021-2032)
8.3.1. Germany EPA and DHA Omega 3 Ingredients Regional Analysis and Outlook
8.3.2. France EPA and DHA Omega 3 Ingredients Regional Analysis and Outlook
8.3.3. United Kingdom EPA and DHA Omega 3 Ingredients Regional Analysis and Outlook
8.3.4. Spain EPA and DHA Omega 3 Ingredients Regional Analysis and Outlook
8.3.5. Italy EPA and DHA Omega 3 Ingredients Regional Analysis and Outlook
8.3.6. Russia EPA and DHA Omega 3 Ingredients Regional Analysis and Outlook
8.3.7. Rest of Europe EPA and DHA Omega 3 Ingredients Regional Analysis and Outlook
8.4. Asia Pacific EPA and DHA Omega 3 Ingredients Revenue (USD Million) by Country (2021-2032)
8.4.1. China EPA and DHA Omega 3 Ingredients Regional Analysis and Outlook
8.4.2. Japan EPA and DHA Omega 3 Ingredients Regional Analysis and Outlook
8.4.3. India EPA and DHA Omega 3 Ingredients Regional Analysis and Outlook
8.4.4. South Korea EPA and DHA Omega 3 Ingredients Regional Analysis and Outlook
8.4.5. Australia EPA and DHA Omega 3 Ingredients Regional Analysis and Outlook
8.4.6. South East Asia EPA and DHA Omega 3 Ingredients Regional Analysis and Outlook
8.4.7. Rest of Asia Pacific EPA and DHA Omega 3 Ingredients Regional Analysis and Outlook
8.5. South America EPA and DHA Omega 3 Ingredients Revenue (USD Million), by Country (2021-2032)
8.5.1. Brazil EPA and DHA Omega 3 Ingredients Regional Analysis and Outlook
8.5.2. Argentina EPA and DHA Omega 3 Ingredients Regional Analysis and Outlook
8.5.3. Rest of South America EPA and DHA Omega 3 Ingredients Regional Analysis and Outlook
8.6. Middle East and Africa EPA and DHA Omega 3 Ingredients Revenue (USD Million) by Country (2021-2032)
8.6.1. Middle East EPA and DHA Omega 3 Ingredients Regional Analysis and Outlook
8.6.2. Africa EPA and DHA Omega 3 Ingredients Regional Analysis and Outlook
Chapter 9. North America EPA and DHA Omega 3 Ingredients Analysis and Outlook
9.1. North America EPA and DHA Omega 3 Ingredients Revenue (USD Million) by Segments (2021-2032)
9.1.1. North America EPA and DHA Omega 3 Ingredients Revenue (USD Million) by Type (2021-2032)
9.1.2. North America EPA and DHA Omega 3 Ingredients Revenue (USD Million) by Application (2021-2032)
9.1.3. North America EPA and DHA Omega 3 Ingredients Revenue (USD Million) by Product (2021-2032)
By Source
Fish Oil
Algae Oil
By Grade
Technical Grade
Food Grade
Pharma Grade
Feed Grade
By End-User
Food & Beverages
Dietary Supplements
Infant Formula
Pharmaceuticals
Animal Feed
Others
Chapter 10. Europe EPA and DHA Omega 3 Ingredients Analysis and Outlook
10.1. Europe EPA and DHA Omega 3 Ingredients Revenue (USD Million), by Segments (USD Million) (2021-2032)
10.1.1. Europe EPA and DHA Omega 3 Ingredients Revenue (USD Million) by Type (2021-2032)
10.1.2. Europe EPA and DHA Omega 3 Ingredients Revenue (USD Million) by Application (2021-2032)
10.1.3. Europe EPA and DHA Omega 3 Ingredients Revenue (USD Million) by Product (2021-2032)
By Source
Fish Oil
Algae Oil
By Grade
Technical Grade
Food Grade
Pharma Grade
Feed Grade
By End-User
Food & Beverages
Dietary Supplements
Infant Formula
Pharmaceuticals
Animal Feed
Others
Chapter 11. Asia Pacific EPA and DHA Omega 3 Ingredients Analysis and Outlook
11.1. Asia Pacific EPA and DHA Omega 3 Ingredients Revenue (USD Million), and Revenue (USD Million) by Segments (2021-2032)
11.1.1. Asia Pacific EPA and DHA Omega 3 Ingredients Revenue (USD Million) by Type (2021-2032)
11.1.2. Asia Pacific EPA and DHA Omega 3 Ingredients Revenue (USD Million) by Application (2021-2032)
11.1.3. Asia Pacific EPA and DHA Omega 3 Ingredients Revenue (USD Million) by Product (2021-2032)
By Source
Fish Oil
Algae Oil
By Grade
Technical Grade
Food Grade
Pharma Grade
Feed Grade
By End-User
Food & Beverages
Dietary Supplements
Infant Formula
Pharmaceuticals
Animal Feed
Others
Chapter 12. South America EPA and DHA Omega 3 Ingredients Analysis and Outlook
12.1. South America EPA and DHA Omega 3 Ingredients Revenue (USD Million), by Segments (2021-2032)
12.1.1. South America EPA and DHA Omega 3 Ingredients Revenue (USD Million) by Type (2021-2032)
12.1.2. South America EPA and DHA Omega 3 Ingredients Revenue (USD Million) by Application (2021-2032)
12.1.3. South America EPA and DHA Omega 3 Ingredients Revenue (USD Million) by Product (2021-2032)
By Source
Fish Oil
Algae Oil
By Grade
Technical Grade
Food Grade
Pharma Grade
Feed Grade
By End-User
Food & Beverages
Dietary Supplements
Infant Formula
Pharmaceuticals
Animal Feed
Others
Chapter 13. Middle East and Africa EPA and DHA Omega 3 Ingredients Analysis and Outlook
13.1. Middle East and Africa EPA and DHA Omega 3 Ingredients Revenue (USD Million), by Segments (2021-2032)
13.1.1. Middle East and Africa EPA and DHA Omega 3 Ingredients Revenue (USD Million) by Type (2021-2032)
13.1.2. Middle East and Africa EPA and DHA Omega 3 Ingredients Revenue (USD Million) by Application (2021-2032)
13.1.3. Middle East and Africa EPA and DHA Omega 3 Ingredients Revenue (USD Million) by Product (2021-2032)
By Source
Fish Oil
Algae Oil
By Grade
Technical Grade
Food Grade
Pharma Grade
Feed Grade
By End-User
Food & Beverages
Dietary Supplements
Infant Formula
Pharmaceuticals
Animal Feed
Others
Chapter 14. EPA and DHA Omega 3 Ingredients Company Profiles
14.1 Business Overview
14.2 Product Profiles
14.3 SWOT Profiles
14.5 Recent Developments
14.6 Financial Profile
List of Companies
Algaecytes Ltd
Archer Daniels Midland Company (ADM)
Arista Industries Inc
Barleans Organic Oils L.L.C.
BASF SE
BioProcess Algae LLC
Cargill Inc
Cellana Inc
Clover Corp Ltd
Copeinca ASA
Corbion NV
Croda International Plc
Denomega Nutritional Oils
Epax Norway AS
GC Rieber Oils AS
KD Pharma Group
Luhua Biomarine (Shandong) Co. Ltd
Marine Ingredients LLC
Neptune Wellness Solutions
Novasep Holding SAS
Novotech Nutraceuticals
Omega Protein Corp
Pharma Marine AS
Polaris Nutritional Lipids
Qponics Ltd
Qualitas Health
15. Methodology and Data Sources
15.1 Customization Offerings
15.2 Subscription Services
15.3 Related Reports
15.4 Publisher Expertise
LIST OF TABLES
Table 1 Market Segmentation Analysis
Table 2 Global EPA and DHA Omega 3 Ingredients Market Share of Leading Companies, 2023
Table 3 Product Offerings of Leading Companies
Table 4 Low Growth Scenario Forecasts
Table 5 Reference Case Growth Scenario
Table 6 High Growth Case Scenario
Table 7 Global EPA and DHA Omega 3 Ingredients Revenue (USD Million) And CAGR (%) By Type (2021-2032)
Table 8 Global EPA and DHA Omega 3 Ingredients Revenue (USD Million) And CAGR (%) By Application (2021-2032)
Table 9 Global EPA and DHA Omega 3 Ingredients Revenue (USD Million) And CAGR (%) By Product (2021-2032)
Table 10 Global EPA and DHA Omega 3 Ingredients Market Revenue (USD Million) By Regions (2021-2032)
Table 11 Global EPA and DHA Omega 3 Ingredients Market Share (%) By Regions (2021-2032)
Table 12 North America EPA and DHA Omega 3 Ingredients Revenue (USD Million) By Country (2021-2032)
Table 13 Europe EPA and DHA Omega 3 Ingredients Revenue (USD Million) By Country (2021-2032)
Table 14 Asia Pacific EPA and DHA Omega 3 Ingredients Revenue (USD Million) By Country (2021-2032)
Table 15 South America EPA and DHA Omega 3 Ingredients Revenue (USD Million) By Country (2021-2032)
Table 16 Middle East and Africa EPA and DHA Omega 3 Ingredients Revenue (USD Million) By Region (2021-2032)
Table 17 North America EPA and DHA Omega 3 Ingredients Revenue (USD Million) By Type (2021-2032)
Table 18 North America EPA and DHA Omega 3 Ingredients Revenue (USD Million) By Application (2021-2032)
Table 19 North America EPA and DHA Omega 3 Ingredients Revenue (USD Million) By Product (2021-2032)
Table 20 Europe EPA and DHA Omega 3 Ingredients Revenue (USD Million) By Type (2021-2032)
Table 21 Europe EPA and DHA Omega 3 Ingredients Revenue (USD Million) By Application (2021-2032)
Table 22 Europe EPA and DHA Omega 3 Ingredients Revenue (USD Million) By Product (2021-2032)
Table 23 Asia Pacific EPA and DHA Omega 3 Ingredients Revenue (USD Million) By Type (2021-2032)
Table 24 Asia Pacific EPA and DHA Omega 3 Ingredients Revenue (USD Million) By Application (2021-2032)
Table 25 Asia Pacific EPA and DHA Omega 3 Ingredients Revenue (USD Million) By Product (2021-2032)
Table 26 South America EPA and DHA Omega 3 Ingredients Revenue (USD Million) By Type (2021-2032)
Table 27 South America EPA and DHA Omega 3 Ingredients Revenue (USD Million) By Application (2021-2032)
Table 28 South America EPA and DHA Omega 3 Ingredients Revenue (USD Million) By Product (2021-2032)
Table 29 Middle East and Africa EPA and DHA Omega 3 Ingredients Revenue (USD Million) By Type (2021-2032)
Table 30 Middle East and Africa EPA and DHA Omega 3 Ingredients Revenue (USD Million) By Application (2021-2032)
Table 31 Middle East and Africa EPA and DHA Omega 3 Ingredients Revenue (USD Million) By Product (2021-2032)
LIST OF FIGURES
Figure 1. Market Scope
Figure 2. Pricing Forecasts Per Unit, 2023- 2032
Figure 3. Porter’s Five Forces
Figure 4. Global EPA and DHA Omega 3 Ingredients Market Revenue (USD Million) By Regions (2021-2032)
Figure 5. Global EPA and DHA Omega 3 Ingredients Market Share (%) By Regions (2023)
Figure 6. North America EPA and DHA Omega 3 Ingredients Revenue (USD Million) By Country (2021-2032)
Figure 7. United States EPA and DHA Omega 3 Ingredients Revenue (USD Million) By Country (2021-2032)
Figure 8. Canada EPA and DHA Omega 3 Ingredients Revenue (USD Million) By Country (2021-2032)
Figure 9. Mexico EPA and DHA Omega 3 Ingredients Revenue (USD Million) By Country (2021-2032)
Figure 10. Europe EPA and DHA Omega 3 Ingredients Revenue (USD Million) By Country (2021-2032)
Figure 11. Germany EPA and DHA Omega 3 Ingredients Revenue (USD Million) By Country (2021-2032)
Figure 12. France EPA and DHA Omega 3 Ingredients Revenue (USD Million) By Country (2021-2032)
Figure 13. United Kingdom EPA and DHA Omega 3 Ingredients Revenue (USD Million) By Country (2021-2032)
Figure 14. Spain EPA and DHA Omega 3 Ingredients Revenue (USD Million) By Country (2021-2032)
Figure 15. Italy EPA and DHA Omega 3 Ingredients Revenue (USD Million) By Country (2021-2032)
Figure 16. Russia EPA and DHA Omega 3 Ingredients Revenue (USD Million) By Country (2021-2032)
Figure 17. Rest of Europe EPA and DHA Omega 3 Ingredients Revenue (USD Million) By Country (2021-2032)
Figure 11. Asia Pacific EPA and DHA Omega 3 Ingredients Revenue (USD Million) By Country (2021-2032)
Figure 12. China EPA and DHA Omega 3 Ingredients Revenue (USD Million) By Country (2021-2032)
Figure 13. Japan EPA and DHA Omega 3 Ingredients Revenue (USD Million) By Country (2021-2032)
Figure 14. India EPA and DHA Omega 3 Ingredients Revenue (USD Million) By Country (2021-2032)
Figure 15. South Korea EPA and DHA Omega 3 Ingredients Revenue (USD Million) By Country (2021-2032)
Figure 16. Australia EPA and DHA Omega 3 Ingredients Revenue (USD Million) By Country (2021-2032)
Figure 17. South East Asia EPA and DHA Omega 3 Ingredients Revenue (USD Million) By Country (2021-2032)
Figure 18. South America EPA and DHA Omega 3 Ingredients Revenue (USD Million) By Country (2021-2032)
Figure 19. Brazil EPA and DHA Omega 3 Ingredients Revenue (USD Million) By Country (2021-2032)
Figure 20. Argentina EPA and DHA Omega 3 Ingredients Revenue (USD Million) By Country (2021-2032)
Figure 21. Rest of Asia Pacific EPA and DHA Omega 3 Ingredients Revenue (USD Million) By Country (2021-2032)
Figure 22. Middle East and Africa EPA and DHA Omega 3 Ingredients Revenue (USD Million) By Region (2021-2032)
Figure 23. Saudi Arabia EPA and DHA Omega 3 Ingredients Revenue (USD Million) By Region (2021-2032)
Figure 24. The UAE EPA and DHA Omega 3 Ingredients Revenue (USD Million) By Region (2021-2032)
Figure 25. Rest of Middle East EPA and DHA Omega 3 Ingredients Revenue (USD Million) By Region (2021-2032)
Figure 26. South Africa EPA and DHA Omega 3 Ingredients Revenue (USD Million) By Region (2021-2032)
Figure 27. Africa EPA and DHA Omega 3 Ingredients Revenue (USD Million) By Region (2021-2032)
Figure 28. North America EPA and DHA Omega 3 Ingredients Revenue (USD Million) By Type (2021-2032)
Figure 29. North America EPA and DHA Omega 3 Ingredients Revenue (USD Million) By Application (2021-2032)
Figure 30. North America EPA and DHA Omega 3 Ingredients Revenue (USD Million) By Product (2021-2032)
Figure 31. Europe EPA and DHA Omega 3 Ingredients Revenue (USD Million) By Type (2021-2032)
Figure 32. Europe EPA and DHA Omega 3 Ingredients Revenue (USD Million) By Application (2021-2032)
Figure 33. Europe EPA and DHA Omega 3 Ingredients Revenue (USD Million) By Product (2021-2032)
Figure 34. Asia Pacific EPA and DHA Omega 3 Ingredients Revenue (USD Million) By Type (2021-2032)
Figure 35. Asia Pacific EPA and DHA Omega 3 Ingredients Revenue (USD Million) By Application (2021-2032)
Figure 36. Asia Pacific EPA and DHA Omega 3 Ingredients Revenue (USD Million) By Product (2021-2032)
Figure 37. South America EPA and DHA Omega 3 Ingredients Revenue (USD Million) By Type (2021-2032)
Figure 38. South America EPA and DHA Omega 3 Ingredients Revenue (USD Million) By Application (2021-2032)
Figure 39. South America EPA and DHA Omega 3 Ingredients Revenue (USD Million) By Product (2021-2032)
Figure 40. Middle East and Africa EPA and DHA Omega 3 Ingredients Revenue (USD Million) By Type (2021-2032)
Figure 41. Middle East and Africa EPA and DHA Omega 3 Ingredients Revenue (USD Million) By Application (2021-2032)
Figure 42. Middle East and Africa EPA and DHA Omega 3 Ingredients Revenue (USD Million) By Product (2021-2032)
By Source
Fish Oil
Algae Oil
By Grade
Technical Grade
Food Grade
Pharma Grade
Feed Grade
By End-User
Food & Beverages
Dietary Supplements
Infant Formula
Pharmaceuticals
Animal Feed
Others
Countries Analyzed
North America (US, Canada, Mexico)
Europe (Germany, UK, France, Spain, Italy, Russia, Rest of Europe)
Asia Pacific (China, India, Japan, South Korea, Australia, South East Asia, Rest of Asia)
South America (Brazil, Argentina, Rest of South America)
Middle East and Africa (Saudi Arabia, UAE, Rest of Middle East, South Africa, Egypt, Rest of Africa)
