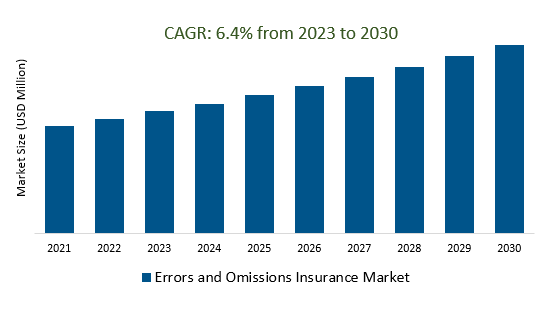
The global Errors and Omissions Insurance Market Size is estimated to register 6.4% growth over the forecast period from 2023 to 2030.
The market growth is driven predominantly by Businesses that recognize the importance of managing risks associated with errors, mistakes, and oversights in their professional activities, making E&O insurance a crucial component of risk management strategies. Leading companies are focusing on Cybersecurity Coverage, Emerging Industries, Remote Work Implications, Regulatory Changes, Integrated Coverage Solutions, Green Technology Sector, and others to boost market shares in the industry.
Market Overview
The Errors and Omissions (E&O) Insurance Market is a niche within professional liability insurance, providing coverage against errors and negligence in professional services. It safeguards businesses and professionals from legal costs and damages resulting from client claims. With applications in various industries, E&O insurance responds to rising litigation, regulatory complexities, and technology-driven risks, offering tailored solutions for effective risk management and reputation protection in today's intricate business landscape.
Market Dynamics
Market Trends- Companies are launching Emergence of New Industries to attract a consumer base
The emergence of new industries is a pivotal driver shaping the Errors and Omissions (E&O) Insurance Market. As innovative sectors like technology, renewable energy, and cannabis evolve, unique risks arise, necessitating specialized E&O coverage. This market adapts to the distinctive challenges these industries face, providing tailored insurance solutions that address errors, oversights, and liabilities specific to their operations. The E&O Insurance Market's responsiveness to new industry demands underscores its role in mitigating risks and supporting the growth of cutting-edge businesses by safeguarding against potential legal and financial consequences.
Market Driver- Globalization and Cross-Border Transactions demand for efficient Errors and Omissions Insurance Market
Globalization and cross-border transactions play a pivotal role in shaping the Errors and Omissions (E&O) Insurance Market. As businesses expand internationally, they encounter diverse legal frameworks, cultural nuances, and regulatory requirements, increasing the potential for errors and disputes. The E&O Insurance Market responds by offering coverage that addresses the complexities of global operations, providing businesses with protection against liabilities arising from errors and omissions in cross-border activities. This aspect highlights the market's adaptability to evolving business landscapes and its role in enabling seamless international growth by mitigating the risks associated with transnational operations.
Market Opportunity-Introduction of Financial Impact of Claims
The financial impact of claims is a pivotal concern driving the Errors and Omissions (E&O) Insurance Market. In today's litigious landscape, businesses and professionals are vulnerable to legal actions stemming from errors, negligence, or inadequate professional services. E&O insurance serves as a financial safeguard, covering the costs of legal defense, settlements, and damages resulting from such claims. By mitigating the potentially crippling financial consequences of litigation, the E&O Insurance Market provides businesses with essential protection, ensuring their sustainability and reputation while allowing them to focus on delivering quality services without the fear of substantial financial setbacks due to legal disputes.
Market Share Analysis- Medical Liability Insurance Errors and Omissions Insurance Market will register the fastest growth
The global Errors and Omissions Insurance Market is analyzed across Medical Liability Insurance, Lawyer Liability Insurance, and others. Of these, Medical Liability Insurance is poised to register the fastest growth. Medical Liability Insurance is tailored for healthcare professionals, covering claims arising from medical negligence and patient harm, while Errors and Omissions (E&O) Insurance is a broader professional liability coverage encompassing various industries, including medical services. E&O Insurance addresses errors, negligence, and failures in service or advice, extending beyond traditional medical malpractice scenarios, making it applicable to a wide range of professions and businesses beyond healthcare.
Market Share Analysis- IT held a significant market share in 2023
The global Errors and Omissions Insurance Market is analyzed across a wide range of application including IT, Accounting, Consulting, and others. Of these, IT held a significant market share in 2023. Information Technology (IT) is a driving force in the Errors and Omissions (E&O) Insurance Market, streamlining operations, enhancing risk assessment, and enabling coverage for emerging risks like cyber liability. IT's integration enables efficient underwriting, claims processing, and data analysis, ensuring tailored coverage solutions for diverse industries. As digital transformation accelerates, IT innovation remains pivotal in adapting to evolving business complexities and providing responsive E&O insurance offerings that address the demands of a technology-driven landscape.
Errors and Omissions Insurance Market Segmentation
By Type
• Medical Liability Insurance
• Lawyer Liability Insurance
• Construction Engineering Liability Insurance
• Others
By Application
• IT
• Accounting
• Consulting
• Marketing
• Property
• Others
By End-User
• Individual
• Corporate
By Region
• North America (United States, Canada, Mexico)
• Europe (Germany, France, United Kingdom, Spain, Italy, Others)
• Asia Pacific (China, India, Japan, South Korea, Australia, Others)
• Latin America (Brazil, Argentina, Others)
• Middle East and Africa (Saudi Arabia, UAE, Kuwait, Other Middle East, South Africa, Nigeria, Other Africa)
Errors and Omissions Insurance Market companies
• Munich Re
• Liberty Mutual Insurance
• Chubb Business Services India Private Limited
• MAPFRE
• Hiscox Limited
• Tokio Marine Holdings
• American International Group
• Allianz, Aviva Inc
• Aon plc
* List not exhaustive
Errors and Omissions Insurance Market Outlook 2023
1 Market Overview
1.1 Introduction to the Errors and Omissions Insurance Market
1.2 Scope of the Study
1.3 Research Objective
1.3.1 Key Market Scope and Segments
1.3.2 Players Covered
1.3.3 Years Considered
2 Executive Summary
2.1 2023 Errors and Omissions Insurance Industry- Market Statistics
3 Market Dynamics
3.1 Market Drivers
3.2 Market Challenges
3.3 Market Opportunities
3.4 Market Trends
4 Market Factor Analysis
4.1 Porter’s Five Forces
4.2 Market Entropy
4.2.1 Global Errors and Omissions Insurance Market Companies with Area Served
4.2.2 Products Offerings Global Errors and Omissions Insurance Market
5 COVID-19 Impact Analysis and Outlook Scenarios
5.1.1 Covid-19 Impact Analysis
5.1.2 Post-COVID-19 Scenario- Low Growth Case
5.1.3 Post-COVID-19 Scenario- Reference Growth Case
5.1.4 Post-COVID-19 Scenario- Low Growth Case
6 Global Errors and Omissions Insurance Market Trends
6.1 Global Errors and Omissions Insurance Revenue (USD Million) and CAGR (%) by Type (2018-2030)
6.2 Global Errors and Omissions Insurance Revenue (USD Million) and CAGR (%) by Applications (2018-2030)
6.3 Global Errors and Omissions Insurance Revenue (USD Million) and CAGR (%) by Regions (2018-2030)
7 Global Errors and Omissions Insurance Market Revenue (USD Million) by Type, and Applications (2018-2022)
7.1 Global Errors and Omissions Insurance Revenue (USD Million) by Type (2018-2022)
7.1.1 Global Errors and Omissions Insurance Revenue (USD Million), Market Share (%) by Type (2018-2022)
7.2 Global Errors and Omissions Insurance Revenue (USD Million) by Applications (2018-2022)
7.2.1 Global Errors and Omissions Insurance Revenue (USD Million), Market Share (%) by Applications (2018-2022)
8 Global Errors and Omissions Insurance Development Regional Status and Outlook
8.1 Global Errors and Omissions Insurance Revenue (USD Million) By Regions (2018-2022)
8.2 North America Errors and Omissions Insurance Revenue (USD Million) by Type, and Application (2018-2022)
8.2.1 North America Errors and Omissions Insurance Revenue (USD Million) by Country (2018-2022)
8.2.2 North America Errors and Omissions Insurance Revenue (USD Million) by Type (2018-2022)
8.2.3 North America Errors and Omissions Insurance Revenue (USD Million) by Applications (2018-2022)
8.3 Europe Errors and Omissions Insurance Revenue (USD Million), by Type, and Applications (USD Million) (2018-2022)
8.3.1 Europe Errors and Omissions Insurance Revenue (USD Million), by Country (2018-2022)
8.3.2 Europe Errors and Omissions Insurance Revenue (USD Million) by Type (2018-2022)
8.3.3 Europe Errors and Omissions Insurance Revenue (USD Million) by Applications (2018-2022)
8.4 Asia Pacific Errors and Omissions Insurance Revenue (USD Million), and Revenue (USD Million) by Type, and Applications (2018-2022)
8.4.1 Asia Pacific Errors and Omissions Insurance Revenue (USD Million) by Country (2018-2022)
8.4.2 Asia Pacific Errors and Omissions Insurance Revenue (USD Million) by Type (2018-2022)
8.4.3 Asia Pacific Errors and Omissions Insurance Revenue (USD Million) by Applications (2018-2022)
8.5 South America Errors and Omissions Insurance Revenue (USD Million), by Type, and Applications (2018-2022)
8.5.1 South America Errors and Omissions Insurance Revenue (USD Million), by Country (2018-2022)
8.5.2 South America Errors and Omissions Insurance Revenue (USD Million) by Type (2018-2022)
8.5.3 South America Errors and Omissions Insurance Revenue (USD Million) by Applications (2018-2022)
8.6 Middle East and Africa Errors and Omissions Insurance Revenue (USD Million), by Type, Technology, Application, Thickness (2018-2022)
8.6.1 Middle East and Africa Errors and Omissions Insurance Revenue (USD Million) by Country (2018-2022)
8.6.2 Middle East and Africa Errors and Omissions Insurance Revenue (USD Million) by Type (2018-2022)
8.6.3 Middle East and Africa Errors and Omissions Insurance Revenue (USD Million) by Applications (2018-2022)
9 Company Profiles
10 Global Errors and Omissions Insurance Market Revenue (USD Million), by Type, and Applications (2023-2030)
10.1 Global Errors and Omissions Insurance Revenue (USD Million) and Market Share (%) by Type (2023-2030)
10.1.1 Global Errors and Omissions Insurance Revenue (USD Million), and Market Share (%) by Type (2023-2030)
10.2 Global Errors and Omissions Insurance Revenue (USD Million) and Market Share (%) by Applications (2023-2030)
10.2.1 Global Errors and Omissions Insurance Revenue (USD Million), and Market Share (%) by Applications (2023-2030)
11 Global Errors and Omissions Insurance Development Regional Status and Outlook Forecast
11.1 Global Errors and Omissions Insurance Revenue (USD Million) By Regions (2023-2030)
11.2 North America Errors and Omissions Insurance Revenue (USD Million) by Type, and Applications (2023-2030)
11.2.1 North America Errors and Omissions Insurance Revenue (USD) Million by Country (2023-2030)
11.2.2 North America Errors and Omissions Insurance Revenue (USD Million), by Type (2023-2030)
11.2.3 North America Errors and Omissions Insurance Revenue (USD Million), Market Share (%) by Applications (2023-2030)
11.3 Europe Errors and Omissions Insurance Revenue (USD Million), by Type, and Applications (2023-2030)
11.3.1 Europe Errors and Omissions Insurance Revenue (USD Million), by Country (2023-2030)
11.3.2 Europe Errors and Omissions Insurance Revenue (USD Million), by Type (2023-2030)
11.3.3 Europe Errors and Omissions Insurance Revenue (USD Million), by Applications (2023-2030)
11.4 Asia Pacific Errors and Omissions Insurance Revenue (USD Million) by Type, and Applications (2023-2030)
11.4.1 Asia Pacific Errors and Omissions Insurance Revenue (USD Million), by Country (2023-2030)
11.4.2 Asia Pacific Errors and Omissions Insurance Revenue (USD Million), by Type (2023-2030)
11.4.3 Asia Pacific Errors and Omissions Insurance Revenue (USD Million), by Applications (2023-2030)
11.5 South America Errors and Omissions Insurance Revenue (USD Million), by Type, and Applications (2023-2030)
11.5.1 South America Errors and Omissions Insurance Revenue (USD Million), by Country (2023-2030)
11.5.2 South America Errors and Omissions Insurance Revenue (USD Million), by Type (2023-2030)
11.5.3 South America Errors and Omissions Insurance Revenue (USD Million), by Applications (2023-2030)
11.6 Middle East and Africa Errors and Omissions Insurance Revenue (USD Million), by Type, and Applications (2023-2030)
11.6.1 Middle East and Africa Errors and Omissions Insurance Revenue (USD Million), by Region (2023-2030)
11.6.2 Middle East and Africa Errors and Omissions Insurance Revenue (USD Million), by Type (2023-2030)
11.6.3 Middle East and Africa Errors and Omissions Insurance Revenue (USD Million), by Applications (2023-2030)
12 Methodology and Data Sources
12.1 Methodology/Research Approach
12.1.1 Research Programs/Design
12.1.2 Market Size Estimation
12.1.3 Market Breakdown and Data Triangulation
12.2 Data Sources
12.2.1 Secondary Sources
12.2.2 Primary Sources
12.3 Disclaimer
List of Tables
Table 1 Market Segmentation Analysis
Table 2 Global Errors and Omissions Insurance Market Companies with Areas Served
Table 3 Products Offerings Global Errors and Omissions Insurance Market
Table 4 Low Growth Scenario Forecasts
Table 5 Reference Case Growth Scenario
Table 6 High Growth Case Scenario
Table 7 Global Errors and Omissions Insurance Revenue (USD Million) And CAGR (%) By Type (2018-2030)
Table 8 Global Errors and Omissions Insurance Revenue (USD Million) And CAGR (%) By Applications (2018-2030)
Table 9 Global Errors and Omissions Insurance Revenue (USD Million) And CAGR (%) By Regions (2018-2030)
Table 10 Global Errors and Omissions Insurance Revenue (USD Million) By Type (2018-2022)
Table 11 Global Errors and Omissions Insurance Revenue Market Share (%) By Type (2018-2022)
Table 12 Global Errors and Omissions Insurance Revenue (USD Million) By Applications (2018-2022)
Table 13 Global Errors and Omissions Insurance Revenue Market Share (%) By Applications (2018-2022)
Table 14 Global Errors and Omissions Insurance Market Revenue (USD Million) By Regions (2018-2022)
Table 15 Global Errors and Omissions Insurance Market Share (%) By Regions (2018-2022)
Table 16 North America Errors and Omissions Insurance Revenue (USD Million) By Country (2018-2022)
Table 17 North America Errors and Omissions Insurance Revenue (USD Million) By Type (2018-2022)
Table 18 North America Errors and Omissions Insurance Revenue (USD Million) By Applications (2018-2022)
Table 19 Europe Errors and Omissions Insurance Revenue (USD Million) By Country (2018-2022)
Table 20 Europe Errors and Omissions Insurance Revenue (USD Million) By Type (2018-2022)
Table 21 Europe Errors and Omissions Insurance Revenue (USD Million) By Applications (2018-2022)
Table 22 Asia Pacific Errors and Omissions Insurance Revenue (USD Million) By Country (2018-2022)
Table 23 Asia Pacific Errors and Omissions Insurance Revenue (USD Million) By Type (2018-2022)
Table 24 Asia Pacific Errors and Omissions Insurance Revenue (USD Million) By Applications (2018-2022)
Table 25 South America Errors and Omissions Insurance Revenue (USD Million) By Country (2018-2022)
Table 26 South America Errors and Omissions Insurance Revenue (USD Million) By Type (2018-2022)
Table 27 South America Errors and Omissions Insurance Revenue (USD Million) By Applications (2018-2022)
Table 28 Middle East and Africa Errors and Omissions Insurance Revenue (USD Million) By Region (2018-2022)
Table 29 Middle East and Africa Errors and Omissions Insurance Revenue (USD Million) By Type (2018-2022)
Table 30 Middle East and Africa Errors and Omissions Insurance Revenue (USD Million) By Applications (2018-2022)
Table 31 Financial Analysis
Table 32 Global Errors and Omissions Insurance Revenue (USD Million) By Type (2023-2030)
Table 33 Global Errors and Omissions Insurance Revenue Market Share (%) By Type (2023-2030)
Table 34 Global Errors and Omissions Insurance Revenue (USD Million) By Applications (2023-2030)
Table 35 Global Errors and Omissions Insurance Revenue Market Share (%) By Applications (2023-2030)
Table 36 Global Errors and Omissions Insurance Market Revenue (USD Million), And Revenue (USD Million) By Regions (2023-2030)
Table 37 North America Errors and Omissions Insurance Revenue (USD)By Country (2023-2030)
Table 38 North America Errors and Omissions Insurance Revenue (USD Million) By Type (2023-2030)
Table 39 North America Errors and Omissions Insurance Revenue (USD Million) By Applications (2023-2030)
Table 40 Europe Errors and Omissions Insurance Revenue (USD Million) By Country (2023-2030)
Table 41 Europe Errors and Omissions Insurance Revenue (USD Million) By Type (2023-2030)
Table 42 Europe Errors and Omissions Insurance Revenue (USD Million) By Applications (2023-2030)
Table 43 Asia Pacific Errors and Omissions Insurance Revenue (USD Million) By Country (2023-2030)
Table 44 Asia Pacific Errors and Omissions Insurance Revenue (USD Million) By Type (2023-2030)
Table 45 Asia Pacific Errors and Omissions Insurance Revenue (USD Million) By Applications (2023-2030)
Table 46 South America Errors and Omissions Insurance Revenue (USD Million) By Country (2023-2030)
Table 47 South America Errors and Omissions Insurance Revenue (USD Million) By Type (2023-2030)
Table 48 South America Errors and Omissions Insurance Revenue (USD Million) By Applications (2023-2030)
Table 49 Middle East and Africa Errors and Omissions Insurance Revenue (USD Million) By Region (2023-2030)
Table 50 Middle East and Africa Errors and Omissions Insurance Revenue (USD Million) By Region (2023-2030)
Table 51 Middle East and Africa Errors and Omissions Insurance Revenue (USD Million) By Type (2023-2030)
Table 52 Middle East and Africa Errors and Omissions Insurance Revenue (USD Million) By Applications (2023-2030)
Table 53 Research Programs/Design for This Report
Table 54 Key Data Information from Secondary Sources
Table 55 Key Data Information from Primary Sources
List of Figures
Figure 1 Market Scope
Figure 2 Porter’s Five Forces
Figure 3 Global Errors and Omissions Insurance Revenue (USD Million) By Type (2018-2022)
Figure 4 Global Errors and Omissions Insurance Revenue Market Share (%) By Type (2022)
Figure 5 Global Errors and Omissions Insurance Revenue (USD Million) By Applications (2018-2022)
Figure 6 Global Errors and Omissions Insurance Revenue Market Share (%) By Applications (2022)
Figure 7 Global Errors and Omissions Insurance Market Revenue (USD Million) By Regions (2018-2022)
Figure 8 Global Errors and Omissions Insurance Market Share (%) By Regions (2022)
Figure 9 North America Errors and Omissions Insurance Revenue (USD Million) By Country (2018-2022)
Figure 10 North America Errors and Omissions Insurance Revenue (USD Million) By Type (2018-2022)
Figure 11 North America Errors and Omissions Insurance Revenue (USD Million) By Applications (2018-2022)
Figure 12 Europe Errors and Omissions Insurance Revenue (USD Million) By Country (2018-2022)
Figure 13 Europe Errors and Omissions Insurance Revenue (USD Million) By Type (2018-2022)
Figure 14 Europe Errors and Omissions Insurance Revenue (USD Million) By Applications (2018-2022)
Figure 15 Asia Pacific Errors and Omissions Insurance Revenue (USD Million) By Country (2018-2022)
Figure 16 Asia Pacific Errors and Omissions Insurance Revenue (USD Million) By Type (2018-2022)
Figure 17 Asia Pacific Errors and Omissions Insurance Revenue (USD Million) By Applications (2018-2022)
Figure 18 South America Errors and Omissions Insurance Revenue (USD Million) By Country (2018-2022)
Figure 19 South America Errors and Omissions Insurance Revenue (USD Million) By Type (2018-2022)
Figure 20 South America Errors and Omissions Insurance Revenue (USD Million) By Applications (2018-2022)
Figure 21 Middle East and Africa Errors and Omissions Insurance Revenue (USD Million) By Region (2018-2022)
Figure 22 Middle East and Africa Errors and Omissions Insurance Revenue (USD Million) By Type (2018-2022)
Figure 23 Middle East and Africa Errors and Omissions Insurance Revenue (USD Million) By Applications (2018-2022)
Figure 24 Global Errors and Omissions Insurance Revenue (USD Million) By Type (2023-2030)
Figure 25 Global Errors and Omissions Insurance Revenue Market Share (%) By Type (2030)
Figure 26 Global Errors and Omissions Insurance Revenue (USD Million) By Applications (2023-2030)
Figure 27 Global Errors and Omissions Insurance Revenue Market Share (%) By Applications (2030)
Figure 28 Global Errors and Omissions Insurance Market Revenue (USD Million) By Regions (2023-2030)
Figure 29 North America Errors and Omissions Insurance Revenue (USD Million) By Country (2023-2030)
Figure 30 North America Errors and Omissions Insurance Revenue (USD Million) By Type (2023-2030)
Figure 31 North America Errors and Omissions Insurance Revenue (USD Million) By Applications (2023-2030)
Figure 32 Europe Errors and Omissions Insurance Revenue (USD Million) By Country (2023-2030)
Figure 33 Europe Errors and Omissions Insurance Revenue (USD Million) By Type (2023-2030)
Figure 34 Europe Errors and Omissions Insurance Revenue (USD Million) By Applications (2023-2030)
Figure 35 Asia Pacific Errors and Omissions Insurance Revenue (USD Million) By Country (2023-2030)
Figure 36 Asia Pacific Errors and Omissions Insurance Revenue (USD Million) By Type (2023-2030)
Figure 37 Asia Pacific Errors and Omissions Insurance Revenue (USD Million) By Applications (2023-2030)
Figure 38 South America Errors and Omissions Insurance Revenue (USD Million) By Country (2023-2030)
Figure 39 South America Errors and Omissions Insurance Revenue (USD Million) By Type (2023-2030)
Figure 40 South America Errors and Omissions Insurance Revenue (USD Million) By Applications (2023-2030)
Figure 41 Middle East and Africa Errors and Omissions Insurance Revenue (USD Million) By Region (2023-2030)
Figure 42 Middle East and Africa Errors and Omissions Insurance Revenue (USD Million) By Region (2023-2030)
Figure 43 Middle East and Africa Errors and Omissions Insurance Revenue (USD Million) By Type (2023-2030)
Figure 44 Middle East and Africa Errors and Omissions Insurance Revenue (USD Million) By Applications (2023-2030)
Figure 45 Bottom-Up and Top-Down Approaches For This Report
Figure 46 Data Triangulation
