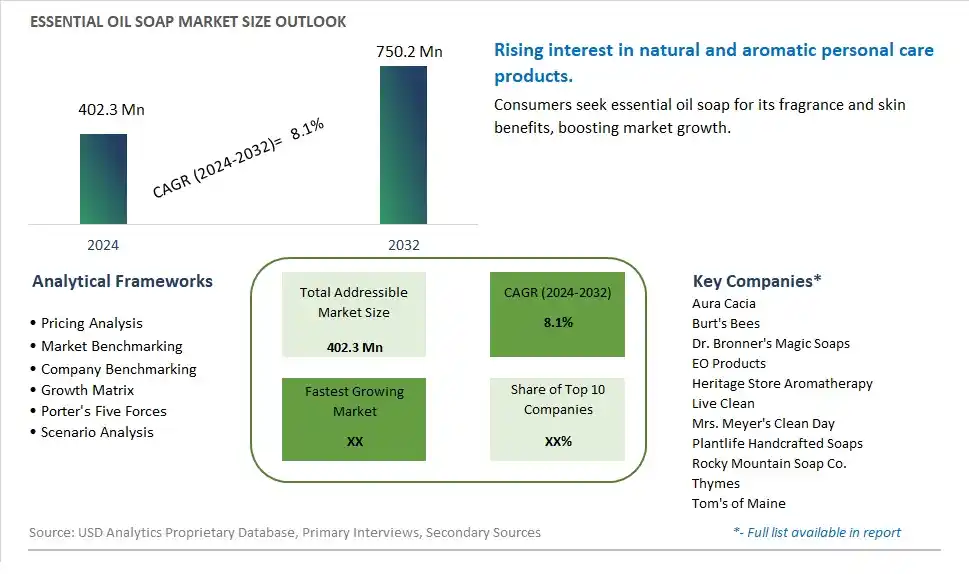
Global Essential Oil Soap Market Size is valued at $402.3 Million in 2024 and is forecast to register a growth rate (CAGR) of 8.1% to reach $750.2 Million by 2032.
The global Essential Oil Soap Market Comprehensive Study analyzes and forecasts the market size across 6 regions and 24 countries for diverse segments -By Soap Type (Liquid Soap, Moisturizing Soap, Antibacterial Soap, Natural Soap), By Price Range (Economy, Mid-range, Premium)
An Introduction to Essential Oil Soap Market
In 2024, the Essential Oil Soap market is experiencing significant growth, driven by the increasing demand for natural and therapeutic personal care products. Essential oil soaps, valued for their aromatic and skin-beneficial properties, are popular among health-conscious consumers and those seeking eco-friendly alternatives. The market benefits from advancements in soap manufacturing, the growing trend of natural and organic skincare, and the expansion of the wellness industry. Additionally, the rising awareness of the benefits of essential oils for skin health and mental well-being is contributing to market growth.
Essential Oil Soap Competitive Landscape
The market report analyses the leading companies in the industry including Aura Cacia, Burt's Bees, Dr. Bronner's Magic Soaps, EO Products, Heritage Store Aromatherapy, Live Clean, Mrs. Meyer's Clean Day, Plantlife Handcrafted Soaps, Rocky Mountain Soap Co., Thymes, Tom's of Maine, and Others.
Essential Oil Soap Market Dynamics
Essential Oil Soap Market Trend: Growing Demand for Natural and Sustainable Personal Care Products
The market for essential oil soap is experiencing a prominent trend towards the growing demand for natural and sustainable personal care products. Consumers are increasingly conscious of the ingredients in their skincare routine and prefer products that are free from harsh chemicals, synthetic fragrances, and artificial additives. Essential oil soap, formulated with natural oils and botanical extracts, aligns with this trend by offering gentle cleansing, nourishing properties, and aromatherapeutic benefits. This trend is driven by the desire for clean beauty, eco-friendly alternatives, and holistic wellness practices in personal care routines.
Essential Oil Soap Market Driver: Consumer Shift Towards Health-Conscious and Clean Beauty Choices
A major driver for the essential oil soap market is the consumer shift towards health-conscious and clean beauty choices. As consumers prioritize health, wellness, and sustainability in their lifestyle choices, there is an increased preference for skincare products that are safe, natural, and environmentally friendly. Essential oil soaps, infused with plant-based ingredients known for their skincare benefits and natural fragrances, appeal to health-conscious consumers seeking gentle and effective cleansing without compromising on skin health or environmental impact. This consumer demand for clean beauty options drives the sales and adoption of essential oil soaps in the personal care market.
Essential Oil Soap Market Opportunity: Expansion into Niche and Specialty Skincare Segments
The essential oil soap market presents a significant opportunity for expansion into niche and specialty skincare segments. Personal care brands and artisan soapmakers can leverage the popularity of essential oils and natural ingredients to create a diverse range of specialty soaps tailored to specific skin types, concerns, and preferences. This opportunity includes developing targeted formulations such as moisturizing soaps for dry skin, acne-fighting soaps for oily or acne-prone skin, soothing soaps for sensitive skin, and exfoliating soaps for enhanced skincare benefits. Additionally, exploring innovative packaging, unique scent combinations, and eco-friendly packaging solutions can enhance product differentiation, consumer appeal, and market penetration for essential oil soaps in the competitive skincare industry.
Essential Oil Soap Market Share Analysis: Moisturizing Soap segment generated the highest revenue share in the industry
The largest segment in the Essential Oil Soap Market is Moisturizing Soap. This type of soap is highly popular among consumers due to its ability to hydrate and nourish the skin while cleansing, making it an essential part of daily skincare routines. Moisturizing soaps are formulated with ingredients like essential oils, shea butter, glycerin, and other moisturizing agents that help retain the skin's natural moisture barrier, preventing dryness and promoting soft, supple skin. The demand for moisturizing soaps has surged in recent years, driven by increasing awareness about skincare and the growing preference for products that offer multiple benefits. Additionally, manufacturers are innovating with new formulations, fragrances, and packaging designs to attract consumers and enhance product appeal. As a result, the Moisturizing Soap segment holds a significant share in the Essential Oil Soap Market and is expected to maintain its dominance due to its efficacy and consumer preference for skin-friendly and nourishing soap options.
Essential Oil Soap Market Share Analysis: Premium Segment is the fastest growing segment over the forecast period to 2032
The fastest-growing segment in the Essential Oil Soap Market is the Premium Price Range. As consumers become more conscious of the quality and ingredients used in their skincare products, there's a noticeable shift towards premium and luxury offerings in the soap segment. Premium essential oil soaps are formulated with high-quality ingredients, including rare or exotic essential oils, organic compounds, and specialized moisturizers, offering enhanced benefits such as deep hydration, anti-aging properties, and therapeutic aromatherapy effects. These soaps often come in exquisite packaging, tailored fragrances, and unique formulations that cater to specific skin types and preferences, making them highly desirable among discerning consumers. The growing trend of self-care and indulgence in luxury skincare products further fuels the demand for premium essential oil soaps. Manufacturers are also focusing on eco-friendly and sustainable practices in the production of premium soaps to align with the evolving preferences of environmentally conscious consumers. As a result, the Premium Price Range segment is expected to experience rapid growth and significant market share expansion by 2032, driven by increasing consumer demand for high-quality, indulgent skincare experiences.
Essential Oil Soap Market Segmentation
By Soap Type
Liquid Soap
Moisturizing Soap
Antibacterial Soap
Natural Soap
By Price Range
Economy
Mid-range
Premium
Countries Analyzed
North America (US, Canada, Mexico)
Europe (Germany, UK, France, Spain, Italy, Russia, Rest of Europe)
Asia Pacific (China, India, Japan, South Korea, Australia, South East Asia, Rest of Asia)
South America (Brazil, Argentina, Rest of South America)
Middle East and Africa (Saudi Arabia, UAE, Rest of Middle East, South Africa, Egypt, Rest of Africa)
Essential Oil Soap Companies Profiled in the Study
Aura Cacia
Burt's Bees
Dr. Bronner's Magic Soaps
EO Products
Heritage Store Aromatherapy
Live Clean
Mrs. Meyer's Clean Day
Plantlife Handcrafted Soaps
Rocky Mountain Soap Co.
Thymes
Tom's of Maine
*- List Not Exhaustive
Chapter 1. TABLE OF CONTENTS
Chapter 2. Introduction to Essential Oil Soap Market
2.1. Market Overview
2.2. Key Statistics and Report Highlights
2.3. Scope of the Comprehensive Study
2.3.1. Market Definition
2.3.2 Countries and Regions Covered
2.3.3 Research Objective
2.3.4 Units, Currency, and Conversions
2.3.5 Industry Value Chain
2.4. Key Market Segments
2.5. Key Companies
2.6. Study Period
Chapter 3. Strategic Analysis Review
3.1. Essential Oil Soap Pricing Analysis and Forecast
3.2. Porter’s Five Forces
3.3. Market Ecosystem
3.4. SWOT Analysis
3.5. Regulatory Scenario
3.3. Effects of Inflation, Russia-Ukraine War, moderating economic growth, and other macroeconomic factors
Chapter 4. Competitive Landscape
4.1. Market Share Analysis
4.1.1. Global Essential Oil Soap Market Share by Company, 2023
4.1.2. Product Offerings of Leading Essential Oil Soap Companies
4.2. Market Entropy
4.2.1. New Product Launches in the Industry
4.2.2. Mergers, Acquisitions, Joint ventures, and Partnerships
4.3. Key Strategies and Best Practices
Chapter 5. Global Market Projections: Best, Reference, and Low Case Scenarios
5.1. Growth Analysis- Case Scenario Definitions
5.2. Low Growth Case Scenario Forecasts
5.3. Reference Growth Case Scenario Forecasts
5.4. High Growth Case Scenario Forecasts
Chapter 6. Market Dynamics
6.1. Essential Oil Soap Market Drivers
6.2. Essential Oil Soap Market Challenges
6.6. Essential Oil Soap Market Opportunities
6.4. Essential Oil Soap Market Trends
Chapter 7. Global Essential Oil Soap Market Outlook Trends
7.1. Global Essential Oil Soap Revenue (USD Million) and CAGR (%) by Type (2021-2032)
7.2. Global Essential Oil Soap Revenue (USD Million) and CAGR (%) by Application (2021-2032)
7.3. Global Essential Oil Soap Revenue (USD Million) and CAGR (%) by Product (2021-2032)
By Soap Type
Liquid Soap
Moisturizing Soap
Antibacterial Soap
Natural Soap
By Price Range
Economy
Mid-range
Premium
Chapter 8. Global Essential Oil Soap Regional Analysis and Outlook
8.1. Global Essential Oil Soap Revenue (USD Million) By Regions (2021- 2032)
8.2. North America Essential Oil Soap Revenue (USD Million) by Country (2021-2032)
8.2.1. United States Essential Oil Soap Regional Analysis and Outlook
8.2.2. Canada Essential Oil Soap Regional Analysis and Outlook
8.2.3. Mexico Essential Oil Soap Regional Analysis and Outlook
8.3. Europe Essential Oil Soap Revenue (USD Million), by Country (2021-2032)
8.3.1. Germany Essential Oil Soap Regional Analysis and Outlook
8.3.2. France Essential Oil Soap Regional Analysis and Outlook
8.3.3. United Kingdom Essential Oil Soap Regional Analysis and Outlook
8.3.4. Spain Essential Oil Soap Regional Analysis and Outlook
8.3.5. Italy Essential Oil Soap Regional Analysis and Outlook
8.3.6. Russia Essential Oil Soap Regional Analysis and Outlook
8.3.7. Rest of Europe Essential Oil Soap Regional Analysis and Outlook
8.4. Asia Pacific Essential Oil Soap Revenue (USD Million) by Country (2021-2032)
8.4.1. China Essential Oil Soap Regional Analysis and Outlook
8.4.2. Japan Essential Oil Soap Regional Analysis and Outlook
8.4.3. India Essential Oil Soap Regional Analysis and Outlook
8.4.4. South Korea Essential Oil Soap Regional Analysis and Outlook
8.4.5. Australia Essential Oil Soap Regional Analysis and Outlook
8.4.6. South East Asia Essential Oil Soap Regional Analysis and Outlook
8.4.7. Rest of Asia Pacific Essential Oil Soap Regional Analysis and Outlook
8.5. South America Essential Oil Soap Revenue (USD Million), by Country (2021-2032)
8.5.1. Brazil Essential Oil Soap Regional Analysis and Outlook
8.5.2. Argentina Essential Oil Soap Regional Analysis and Outlook
8.5.3. Rest of South America Essential Oil Soap Regional Analysis and Outlook
8.6. Middle East and Africa Essential Oil Soap Revenue (USD Million) by Country (2021-2032)
8.6.1. Middle East Essential Oil Soap Regional Analysis and Outlook
8.6.2. Africa Essential Oil Soap Regional Analysis and Outlook
Chapter 9. North America Essential Oil Soap Analysis and Outlook
9.1. North America Essential Oil Soap Revenue (USD Million) by Segments (2021-2032)
9.1.1. North America Essential Oil Soap Revenue (USD Million) by Type (2021-2032)
9.1.2. North America Essential Oil Soap Revenue (USD Million) by Application (2021-2032)
9.1.3. North America Essential Oil Soap Revenue (USD Million) by Product (2021-2032)
By Soap Type
Liquid Soap
Moisturizing Soap
Antibacterial Soap
Natural Soap
By Price Range
Economy
Mid-range
Premium
Chapter 10. Europe Essential Oil Soap Analysis and Outlook
10.1. Europe Essential Oil Soap Revenue (USD Million), by Segments (USD Million) (2021-2032)
10.1.1. Europe Essential Oil Soap Revenue (USD Million) by Type (2021-2032)
10.1.2. Europe Essential Oil Soap Revenue (USD Million) by Application (2021-2032)
10.1.3. Europe Essential Oil Soap Revenue (USD Million) by Product (2021-2032)
By Soap Type
Liquid Soap
Moisturizing Soap
Antibacterial Soap
Natural Soap
By Price Range
Economy
Mid-range
Premium
Chapter 11. Asia Pacific Essential Oil Soap Analysis and Outlook
11.1. Asia Pacific Essential Oil Soap Revenue (USD Million), and Revenue (USD Million) by Segments (2021-2032)
11.1.1. Asia Pacific Essential Oil Soap Revenue (USD Million) by Type (2021-2032)
11.1.2. Asia Pacific Essential Oil Soap Revenue (USD Million) by Application (2021-2032)
11.1.3. Asia Pacific Essential Oil Soap Revenue (USD Million) by Product (2021-2032)
By Soap Type
Liquid Soap
Moisturizing Soap
Antibacterial Soap
Natural Soap
By Price Range
Economy
Mid-range
Premium
Chapter 12. South America Essential Oil Soap Analysis and Outlook
12.1. South America Essential Oil Soap Revenue (USD Million), by Segments (2021-2032)
12.1.1. South America Essential Oil Soap Revenue (USD Million) by Type (2021-2032)
12.1.2. South America Essential Oil Soap Revenue (USD Million) by Application (2021-2032)
12.1.3. South America Essential Oil Soap Revenue (USD Million) by Product (2021-2032)
By Soap Type
Liquid Soap
Moisturizing Soap
Antibacterial Soap
Natural Soap
By Price Range
Economy
Mid-range
Premium
Chapter 13. Middle East and Africa Essential Oil Soap Analysis and Outlook
13.1. Middle East and Africa Essential Oil Soap Revenue (USD Million), by Segments (2021-2032)
13.1.1. Middle East and Africa Essential Oil Soap Revenue (USD Million) by Type (2021-2032)
13.1.2. Middle East and Africa Essential Oil Soap Revenue (USD Million) by Application (2021-2032)
13.1.3. Middle East and Africa Essential Oil Soap Revenue (USD Million) by Product (2021-2032)
By Soap Type
Liquid Soap
Moisturizing Soap
Antibacterial Soap
Natural Soap
By Price Range
Economy
Mid-range
Premium
Chapter 14. Essential Oil Soap Company Profiles
14.1 Business Overview
14.2 Product Profiles
14.3 SWOT Profiles
14.5 Recent Developments
14.6 Financial Profile
List of Companies
Aura Cacia
Burt's Bees
Dr. Bronner's Magic Soaps
EO Products
Heritage Store Aromatherapy
Live Clean
Mrs. Meyer's Clean Day
Plantlife Handcrafted Soaps
Rocky Mountain Soap Co.
Thymes
Tom's of Maine
15. Methodology and Data Sources
15.1 Customization Offerings
15.2 Subscription Services
15.3 Related Reports
15.4 Publisher Expertise
LIST OF TABLES
Table 1 Market Segmentation Analysis
Table 2 Global Essential Oil Soap Market Share of Leading Companies, 2023
Table 3 Product Offerings of Leading Companies
Table 4 Low Growth Scenario Forecasts
Table 5 Reference Case Growth Scenario
Table 6 High Growth Case Scenario
Table 7 Global Essential Oil Soap Revenue (USD Million) And CAGR (%) By Type (2021-2032)
Table 8 Global Essential Oil Soap Revenue (USD Million) And CAGR (%) By Application (2021-2032)
Table 9 Global Essential Oil Soap Revenue (USD Million) And CAGR (%) By Product (2021-2032)
Table 10 Global Essential Oil Soap Market Revenue (USD Million) By Regions (2021-2032)
Table 11 Global Essential Oil Soap Market Share (%) By Regions (2021-2032)
Table 12 North America Essential Oil Soap Revenue (USD Million) By Country (2021-2032)
Table 13 Europe Essential Oil Soap Revenue (USD Million) By Country (2021-2032)
Table 14 Asia Pacific Essential Oil Soap Revenue (USD Million) By Country (2021-2032)
Table 15 South America Essential Oil Soap Revenue (USD Million) By Country (2021-2032)
Table 16 Middle East and Africa Essential Oil Soap Revenue (USD Million) By Region (2021-2032)
Table 17 North America Essential Oil Soap Revenue (USD Million) By Type (2021-2032)
Table 18 North America Essential Oil Soap Revenue (USD Million) By Application (2021-2032)
Table 19 North America Essential Oil Soap Revenue (USD Million) By Product (2021-2032)
Table 20 Europe Essential Oil Soap Revenue (USD Million) By Type (2021-2032)
Table 21 Europe Essential Oil Soap Revenue (USD Million) By Application (2021-2032)
Table 22 Europe Essential Oil Soap Revenue (USD Million) By Product (2021-2032)
Table 23 Asia Pacific Essential Oil Soap Revenue (USD Million) By Type (2021-2032)
Table 24 Asia Pacific Essential Oil Soap Revenue (USD Million) By Application (2021-2032)
Table 25 Asia Pacific Essential Oil Soap Revenue (USD Million) By Product (2021-2032)
Table 26 South America Essential Oil Soap Revenue (USD Million) By Type (2021-2032)
Table 27 South America Essential Oil Soap Revenue (USD Million) By Application (2021-2032)
Table 28 South America Essential Oil Soap Revenue (USD Million) By Product (2021-2032)
Table 29 Middle East and Africa Essential Oil Soap Revenue (USD Million) By Type (2021-2032)
Table 30 Middle East and Africa Essential Oil Soap Revenue (USD Million) By Application (2021-2032)
Table 31 Middle East and Africa Essential Oil Soap Revenue (USD Million) By Product (2021-2032)
LIST OF FIGURES
Figure 1. Market Scope
Figure 2. Pricing Forecasts Per Unit, 2023- 2032
Figure 3. Porter’s Five Forces
Figure 4. Global Essential Oil Soap Market Revenue (USD Million) By Regions (2021-2032)
Figure 5. Global Essential Oil Soap Market Share (%) By Regions (2023)
Figure 6. North America Essential Oil Soap Revenue (USD Million) By Country (2021-2032)
Figure 7. United States Essential Oil Soap Revenue (USD Million) By Country (2021-2032)
Figure 8. Canada Essential Oil Soap Revenue (USD Million) By Country (2021-2032)
Figure 9. Mexico Essential Oil Soap Revenue (USD Million) By Country (2021-2032)
Figure 10. Europe Essential Oil Soap Revenue (USD Million) By Country (2021-2032)
Figure 11. Germany Essential Oil Soap Revenue (USD Million) By Country (2021-2032)
Figure 12. France Essential Oil Soap Revenue (USD Million) By Country (2021-2032)
Figure 13. United Kingdom Essential Oil Soap Revenue (USD Million) By Country (2021-2032)
Figure 14. Spain Essential Oil Soap Revenue (USD Million) By Country (2021-2032)
Figure 15. Italy Essential Oil Soap Revenue (USD Million) By Country (2021-2032)
Figure 16. Russia Essential Oil Soap Revenue (USD Million) By Country (2021-2032)
Figure 17. Rest of Europe Essential Oil Soap Revenue (USD Million) By Country (2021-2032)
Figure 11. Asia Pacific Essential Oil Soap Revenue (USD Million) By Country (2021-2032)
Figure 12. China Essential Oil Soap Revenue (USD Million) By Country (2021-2032)
Figure 13. Japan Essential Oil Soap Revenue (USD Million) By Country (2021-2032)
Figure 14. India Essential Oil Soap Revenue (USD Million) By Country (2021-2032)
Figure 15. South Korea Essential Oil Soap Revenue (USD Million) By Country (2021-2032)
Figure 16. Australia Essential Oil Soap Revenue (USD Million) By Country (2021-2032)
Figure 17. South East Asia Essential Oil Soap Revenue (USD Million) By Country (2021-2032)
Figure 18. South America Essential Oil Soap Revenue (USD Million) By Country (2021-2032)
Figure 19. Brazil Essential Oil Soap Revenue (USD Million) By Country (2021-2032)
Figure 20. Argentina Essential Oil Soap Revenue (USD Million) By Country (2021-2032)
Figure 21. Rest of Asia Pacific Essential Oil Soap Revenue (USD Million) By Country (2021-2032)
Figure 22. Middle East and Africa Essential Oil Soap Revenue (USD Million) By Region (2021-2032)
Figure 23. Saudi Arabia Essential Oil Soap Revenue (USD Million) By Region (2021-2032)
Figure 24. The UAE Essential Oil Soap Revenue (USD Million) By Region (2021-2032)
Figure 25. Rest of Middle East Essential Oil Soap Revenue (USD Million) By Region (2021-2032)
Figure 26. South Africa Essential Oil Soap Revenue (USD Million) By Region (2021-2032)
Figure 27. Africa Essential Oil Soap Revenue (USD Million) By Region (2021-2032)
Figure 28. North America Essential Oil Soap Revenue (USD Million) By Type (2021-2032)
Figure 29. North America Essential Oil Soap Revenue (USD Million) By Application (2021-2032)
Figure 30. North America Essential Oil Soap Revenue (USD Million) By Product (2021-2032)
Figure 31. Europe Essential Oil Soap Revenue (USD Million) By Type (2021-2032)
Figure 32. Europe Essential Oil Soap Revenue (USD Million) By Application (2021-2032)
Figure 33. Europe Essential Oil Soap Revenue (USD Million) By Product (2021-2032)
Figure 34. Asia Pacific Essential Oil Soap Revenue (USD Million) By Type (2021-2032)
Figure 35. Asia Pacific Essential Oil Soap Revenue (USD Million) By Application (2021-2032)
Figure 36. Asia Pacific Essential Oil Soap Revenue (USD Million) By Product (2021-2032)
Figure 37. South America Essential Oil Soap Revenue (USD Million) By Type (2021-2032)
Figure 38. South America Essential Oil Soap Revenue (USD Million) By Application (2021-2032)
Figure 39. South America Essential Oil Soap Revenue (USD Million) By Product (2021-2032)
Figure 40. Middle East and Africa Essential Oil Soap Revenue (USD Million) By Type (2021-2032)
Figure 41. Middle East and Africa Essential Oil Soap Revenue (USD Million) By Application (2021-2032)
Figure 42. Middle East and Africa Essential Oil Soap Revenue (USD Million) By Product (2021-2032)
By Soap Type
Liquid Soap
Moisturizing Soap
Antibacterial Soap
Natural Soap
By Price Range
Economy
Mid-range
Premium
Countries Analyzed
North America (US, Canada, Mexico)
Europe (Germany, UK, France, Spain, Italy, Russia, Rest of Europe)
Asia Pacific (China, India, Japan, South Korea, Australia, South East Asia, Rest of Asia)
South America (Brazil, Argentina, Rest of South America)
Middle East and Africa (Saudi Arabia, UAE, Rest of Middle East, South Africa, Egypt, Rest of Africa)
