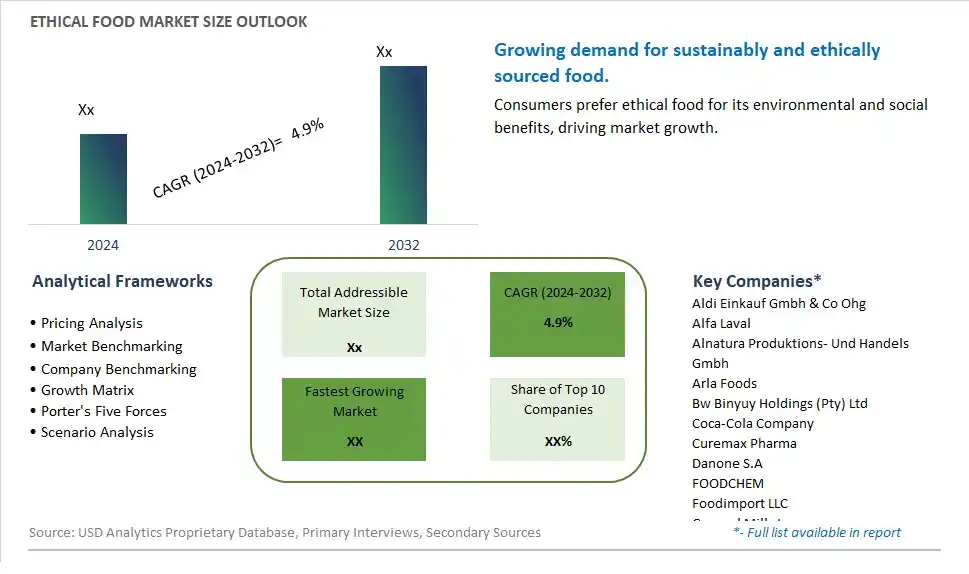
Global Ethical Food Market Size is valued at $XX Million in 2024 and is forecast to register a growth rate (CAGR) of 4.9% to reach $XX Million by 2032.
The global Ethical Food Market Comprehensive Study analyzes and forecasts the market size across 6 regions and 24 countries for diverse segments -By Type (Organic, Natural), By Process (Processed, Unprocessed), By Distribution Channel (Online, Offline)
An Introduction to Ethical Food Market
The Ethical Food market in 2024 is thriving, fueled by the rising consumer awareness of sustainability, animal welfare, and fair trade practices. Ethical foods, which prioritize environmentally friendly production, humane animal treatment, and fair labor practices, are gaining popularity among socially conscious consumers. The market benefits from the growing trend of responsible consumption, advancements in sustainable agriculture, and the expansion of certification and labeling programs. Additionally, the increasing focus on transparency and traceability in the food supply chain is driving market growth.
Ethical Food Competitive Landscape
The market report analyses the leading companies in the industry including Aldi Einkauf Gmbh & Co Ohg, Alfa Laval, Alnatura Produktions- Und Handels Gmbh, Arla Foods, Bw Binyuy Holdings (Pty) Ltd, Coca-Cola Company, Curemax Pharma, Danone S.A, FOODCHEM, Foodimport LLC, General Mills Inc, Grass LLC, Hipp Gmbh & Co Vertrieb KG, Individual Entrepreneur (Ie) Maslov D.V, Krungthep Trading Co. Ltd, Nestlé S.A., Nutra Healthcare, Nuttys LLC, Organic Valley, PepsiCo, Rewe Market Gmbh, Royal Forest Company, Shandong Yuxin Soybean Protein Co, Siberian Ecological Products LLC, Solitude Global Impex, STDM Food & Beverages Private Ltd, Sun Green Group, The Hain Celestial Group, The Kraft Heinz Company, Titan Biotech Ltd, United Natural Foods Inc, Vyas Bio Life Sciences Private Ltd, Wuxi Biologics, and Others.
Ethical Food Market Dynamics
Ethical Food Market Trend: Growing Consumer Focus on Ethical and Sustainable Food Choices
The market for ethical food is experiencing a prominent trend towards the growing consumer focus on ethical and sustainable food choices. With increasing awareness about environmental issues, animal welfare concerns, and social responsibility, consumers are seeking food products that align with their values and support ethical practices throughout the supply chain. Ethical food, including organic, fair-trade, cruelty-free, and locally sourced products, is gaining popularity as consumers prioritize transparency, ethical sourcing, and sustainability in their food purchasing decisions.
Ethical Food Market Driver: Rise in Conscious Consumerism and Demand for Transparency
A major driver for the ethical food market is the rise in conscious consumerism and the demand for transparency in food production. Modern consumers are more informed and empowered than ever before, actively seeking information about how their food is sourced, produced, and distributed. This drive for transparency extends to ethical considerations such as environmental impact, animal welfare, fair labor practices, and social justice in the food industry. Ethical food brands and initiatives that prioritize sustainability, ethical sourcing, and transparent supply chains resonate with consumers' values and preferences, driving the demand for ethical food products.
Ethical Food Market Opportunity: Innovation in Ethical Food Products and Messaging
The ethical food market presents a significant opportunity for innovation in product offerings and messaging. Food companies, retailers, and agricultural producers can capitalize on this opportunity by introducing new ethical food products, enhancing existing product lines, and communicating their ethical commitments effectively to consumers. This opportunity includes developing innovative plant-based alternatives, sustainable packaging solutions, regenerative agriculture practices, and partnerships with ethical certifications and standards organizations. Additionally, leveraging digital platforms, storytelling, and marketing campaigns focused on transparency, sustainability, and ethical values can strengthen brand trust, consumer loyalty, and market competitiveness in the evolving landscape of ethical food.
Ethical Food Market Share Analysis: Organic Segment segment generated the highest revenue share in the industry
The largest segment in the Ethical Food Market is the Organic Food segment. Organic food has gained substantial traction in recent years due to increasing awareness among consumers about health, environmental sustainability, and ethical farming practices. Organic foods are produced without synthetic pesticides, fertilizers, genetically modified organisms (GMOs), or growth hormones, making them highly appealing to health-conscious consumers. The organic segment includes a wide range of products, including fruits, vegetables, grains, dairy products, meat, poultry, and processed foods, all certified to meet stringent organic standards. Factors driving the growth of the organic food market include growing concerns about food safety, rising disposable incomes, preference for chemical-free and environmentally friendly products, and government initiatives promoting organic farming. Consumers perceive organic food as healthier, safer, and more environmentally sustainable, leading to increased demand and market growth. As a result, the Organic Food segment holds a dominant position in the Ethical Food Market and is expected to continue its growth trajectory in the coming years.
Ethical Food Market Share Analysis: Unprocessed Segment is the fastest growing segment over the forecast period to 2032
The fastest growing segment in the Ethical Food Market is the Unprocessed Food segment. Unprocessed foods refer to natural, whole foods that undergo minimal processing or refinement, retaining their nutritional integrity and original state as much as possible. This segment includes fresh fruits and vegetables, whole grains, nuts, seeds, legumes, and minimally processed meats and dairy products. The growing consumer preference for healthy and nutritious food options has propelled the demand for unprocessed foods. Consumers are increasingly aware of the health benefits associated with unprocessed foods, such as higher nutrient content, lower levels of additives and preservatives, and reduced exposure to artificial ingredients. Additionally, concerns about food safety, sustainability, and environmental impact have further boosted the demand for unprocessed foods sourced from ethical and sustainable farming practices. As a result, the Unprocessed Food segment is experiencing rapid growth and is expected to continue expanding significantly in the coming years, driven by evolving consumer preferences and a shift towards healthier eating habits.
Ethical Food Market Share Analysis: Offline Distribution Channel segment generated the highest revenue share in the industry
The largest segment in the Ethical Food Market is the Offline Distribution Channel. This segment encompasses traditional brick-and-mortar retail outlets such as supermarkets, grocery stores, farmers' markets, specialty food stores, and health food stores where consumers can physically purchase ethical food products. Despite the growing popularity of online shopping, offline channels remain dominant in the ethical food sector due to several key factors. Firstly, offline channels offer a tangible shopping experience that allows consumers to inspect products, interact with knowledgeable staff, and make informed decisions based on visual and tactile cues. Additionally, many consumers still prefer the convenience of immediate product availability and the ability to support local businesses by shopping in physical stores. Further, offline channels often emphasize community engagement, sustainability, and ethical sourcing practices, resonating with consumers seeking transparency and authenticity in their food choices. As a result, the Offline Distribution Channel continues to hold a significant share of the Ethical Food Market, supported by its established infrastructure, consumer trust, and holistic shopping experience.
Ethical Food Market Segmentation
By Type
Organic
Natural
By Process
Processed
Unprocessed
By Distribution Channel
Online
Offline
Countries Analyzed
North America (US, Canada, Mexico)
Europe (Germany, UK, France, Spain, Italy, Russia, Rest of Europe)
Asia Pacific (China, India, Japan, South Korea, Australia, South East Asia, Rest of Asia)
South America (Brazil, Argentina, Rest of South America)
Middle East and Africa (Saudi Arabia, UAE, Rest of Middle East, South Africa, Egypt, Rest of Africa)
Ethical Food Companies Profiled in the Study
Aldi Einkauf Gmbh & Co Ohg
Alfa Laval
Alnatura Produktions- Und Handels Gmbh
Arla Foods
Bw Binyuy Holdings (Pty) Ltd
Coca-Cola Company
Curemax Pharma
Danone S.A
FOODCHEM
Foodimport LLC
General Mills Inc
Grass LLC
Hipp Gmbh & Co Vertrieb KG
Individual Entrepreneur (Ie) Maslov D.V
Krungthep Trading Co. Ltd
Nestlé S.A.
Nutra Healthcare
Nuttys LLC
Organic Valley
PepsiCo
Rewe Market Gmbh
Royal Forest Company
Shandong Yuxin Soybean Protein Co
Siberian Ecological Products LLC
Solitude Global Impex
STDM Food & Beverages Private Ltd
Sun Green Group
The Hain Celestial Group
The Kraft Heinz Company
Titan Biotech Ltd
United Natural Foods Inc
Vyas Bio Life Sciences Private Ltd
Wuxi Biologics
*- List Not Exhaustive
Chapter 1. TABLE OF CONTENTS
Chapter 2. Introduction to Ethical Food Market
2.1. Market Overview
2.2. Key Statistics and Report Highlights
2.3. Scope of the Comprehensive Study
2.3.1. Market Definition
2.3.2 Countries and Regions Covered
2.3.3 Research Objective
2.3.4 Units, Currency, and Conversions
2.3.5 Industry Value Chain
2.4. Key Market Segments
2.5. Key Companies
2.6. Study Period
Chapter 3. Strategic Analysis Review
3.1. Ethical Food Pricing Analysis and Forecast
3.2. Porter’s Five Forces
3.3. Market Ecosystem
3.4. SWOT Analysis
3.5. Regulatory Scenario
3.3. Effects of Inflation, Russia-Ukraine War, moderating economic growth, and other macroeconomic factors
Chapter 4. Competitive Landscape
4.1. Market Share Analysis
4.1.1. Global Ethical Food Market Share by Company, 2023
4.1.2. Product Offerings of Leading Ethical Food Companies
4.2. Market Entropy
4.2.1. New Product Launches in the Industry
4.2.2. Mergers, Acquisitions, Joint ventures, and Partnerships
4.3. Key Strategies and Best Practices
Chapter 5. Global Market Projections: Best, Reference, and Low Case Scenarios
5.1. Growth Analysis- Case Scenario Definitions
5.2. Low Growth Case Scenario Forecasts
5.3. Reference Growth Case Scenario Forecasts
5.4. High Growth Case Scenario Forecasts
Chapter 6. Market Dynamics
6.1. Ethical Food Market Drivers
6.2. Ethical Food Market Challenges
6.6. Ethical Food Market Opportunities
6.4. Ethical Food Market Trends
Chapter 7. Global Ethical Food Market Outlook Trends
7.1. Global Ethical Food Revenue (USD Million) and CAGR (%) by Type (2021-2032)
7.2. Global Ethical Food Revenue (USD Million) and CAGR (%) by Application (2021-2032)
7.3. Global Ethical Food Revenue (USD Million) and CAGR (%) by Product (2021-2032)
By Type
Organic
Natural
By Process
Processed
Unprocessed
By Distribution Channel
Online
Offline
Chapter 8. Global Ethical Food Regional Analysis and Outlook
8.1. Global Ethical Food Revenue (USD Million) By Regions (2021- 2032)
8.2. North America Ethical Food Revenue (USD Million) by Country (2021-2032)
8.2.1. United States Ethical Food Regional Analysis and Outlook
8.2.2. Canada Ethical Food Regional Analysis and Outlook
8.2.3. Mexico Ethical Food Regional Analysis and Outlook
8.3. Europe Ethical Food Revenue (USD Million), by Country (2021-2032)
8.3.1. Germany Ethical Food Regional Analysis and Outlook
8.3.2. France Ethical Food Regional Analysis and Outlook
8.3.3. United Kingdom Ethical Food Regional Analysis and Outlook
8.3.4. Spain Ethical Food Regional Analysis and Outlook
8.3.5. Italy Ethical Food Regional Analysis and Outlook
8.3.6. Russia Ethical Food Regional Analysis and Outlook
8.3.7. Rest of Europe Ethical Food Regional Analysis and Outlook
8.4. Asia Pacific Ethical Food Revenue (USD Million) by Country (2021-2032)
8.4.1. China Ethical Food Regional Analysis and Outlook
8.4.2. Japan Ethical Food Regional Analysis and Outlook
8.4.3. India Ethical Food Regional Analysis and Outlook
8.4.4. South Korea Ethical Food Regional Analysis and Outlook
8.4.5. Australia Ethical Food Regional Analysis and Outlook
8.4.6. South East Asia Ethical Food Regional Analysis and Outlook
8.4.7. Rest of Asia Pacific Ethical Food Regional Analysis and Outlook
8.5. South America Ethical Food Revenue (USD Million), by Country (2021-2032)
8.5.1. Brazil Ethical Food Regional Analysis and Outlook
8.5.2. Argentina Ethical Food Regional Analysis and Outlook
8.5.3. Rest of South America Ethical Food Regional Analysis and Outlook
8.6. Middle East and Africa Ethical Food Revenue (USD Million) by Country (2021-2032)
8.6.1. Middle East Ethical Food Regional Analysis and Outlook
8.6.2. Africa Ethical Food Regional Analysis and Outlook
Chapter 9. North America Ethical Food Analysis and Outlook
9.1. North America Ethical Food Revenue (USD Million) by Segments (2021-2032)
9.1.1. North America Ethical Food Revenue (USD Million) by Type (2021-2032)
9.1.2. North America Ethical Food Revenue (USD Million) by Application (2021-2032)
9.1.3. North America Ethical Food Revenue (USD Million) by Product (2021-2032)
By Type
Organic
Natural
By Process
Processed
Unprocessed
By Distribution Channel
Online
Offline
Chapter 10. Europe Ethical Food Analysis and Outlook
10.1. Europe Ethical Food Revenue (USD Million), by Segments (USD Million) (2021-2032)
10.1.1. Europe Ethical Food Revenue (USD Million) by Type (2021-2032)
10.1.2. Europe Ethical Food Revenue (USD Million) by Application (2021-2032)
10.1.3. Europe Ethical Food Revenue (USD Million) by Product (2021-2032)
By Type
Organic
Natural
By Process
Processed
Unprocessed
By Distribution Channel
Online
Offline
Chapter 11. Asia Pacific Ethical Food Analysis and Outlook
11.1. Asia Pacific Ethical Food Revenue (USD Million), and Revenue (USD Million) by Segments (2021-2032)
11.1.1. Asia Pacific Ethical Food Revenue (USD Million) by Type (2021-2032)
11.1.2. Asia Pacific Ethical Food Revenue (USD Million) by Application (2021-2032)
11.1.3. Asia Pacific Ethical Food Revenue (USD Million) by Product (2021-2032)
By Type
Organic
Natural
By Process
Processed
Unprocessed
By Distribution Channel
Online
Offline
Chapter 12. South America Ethical Food Analysis and Outlook
12.1. South America Ethical Food Revenue (USD Million), by Segments (2021-2032)
12.1.1. South America Ethical Food Revenue (USD Million) by Type (2021-2032)
12.1.2. South America Ethical Food Revenue (USD Million) by Application (2021-2032)
12.1.3. South America Ethical Food Revenue (USD Million) by Product (2021-2032)
By Type
Organic
Natural
By Process
Processed
Unprocessed
By Distribution Channel
Online
Offline
Chapter 13. Middle East and Africa Ethical Food Analysis and Outlook
13.1. Middle East and Africa Ethical Food Revenue (USD Million), by Segments (2021-2032)
13.1.1. Middle East and Africa Ethical Food Revenue (USD Million) by Type (2021-2032)
13.1.2. Middle East and Africa Ethical Food Revenue (USD Million) by Application (2021-2032)
13.1.3. Middle East and Africa Ethical Food Revenue (USD Million) by Product (2021-2032)
By Type
Organic
Natural
By Process
Processed
Unprocessed
By Distribution Channel
Online
Offline
Chapter 14. Ethical Food Company Profiles
14.1 Business Overview
14.2 Product Profiles
14.3 SWOT Profiles
14.5 Recent Developments
14.6 Financial Profile
List of Companies
Aldi Einkauf Gmbh & Co Ohg
Alfa Laval
Alnatura Produktions- Und Handels Gmbh
Arla Foods
Bw Binyuy Holdings (Pty) Ltd
Coca-Cola Company
Curemax Pharma
Danone S.A
FOODCHEM
Foodimport LLC
General Mills Inc
Grass LLC
Hipp Gmbh & Co Vertrieb KG
Individual Entrepreneur (Ie) Maslov D.V
Krungthep Trading Co. Ltd
Nestlé S.A.
Nutra Healthcare
Nuttys LLC
Organic Valley
PepsiCo
Rewe Market Gmbh
Royal Forest Company
Shandong Yuxin Soybean Protein Co
Siberian Ecological Products LLC
Solitude Global Impex
STDM Food & Beverages Private Ltd
Sun Green Group
The Hain Celestial Group
The Kraft Heinz Company
Titan Biotech Ltd
United Natural Foods Inc
Vyas Bio Life Sciences Private Ltd
Wuxi Biologics
15. Methodology and Data Sources
15.1 Customization Offerings
15.2 Subscription Services
15.3 Related Reports
15.4 Publisher Expertise
LIST OF TABLES
Table 1 Market Segmentation Analysis
Table 2 Global Ethical Food Market Share of Leading Companies, 2023
Table 3 Product Offerings of Leading Companies
Table 4 Low Growth Scenario Forecasts
Table 5 Reference Case Growth Scenario
Table 6 High Growth Case Scenario
Table 7 Global Ethical Food Revenue (USD Million) And CAGR (%) By Type (2021-2032)
Table 8 Global Ethical Food Revenue (USD Million) And CAGR (%) By Application (2021-2032)
Table 9 Global Ethical Food Revenue (USD Million) And CAGR (%) By Product (2021-2032)
Table 10 Global Ethical Food Market Revenue (USD Million) By Regions (2021-2032)
Table 11 Global Ethical Food Market Share (%) By Regions (2021-2032)
Table 12 North America Ethical Food Revenue (USD Million) By Country (2021-2032)
Table 13 Europe Ethical Food Revenue (USD Million) By Country (2021-2032)
Table 14 Asia Pacific Ethical Food Revenue (USD Million) By Country (2021-2032)
Table 15 South America Ethical Food Revenue (USD Million) By Country (2021-2032)
Table 16 Middle East and Africa Ethical Food Revenue (USD Million) By Region (2021-2032)
Table 17 North America Ethical Food Revenue (USD Million) By Type (2021-2032)
Table 18 North America Ethical Food Revenue (USD Million) By Application (2021-2032)
Table 19 North America Ethical Food Revenue (USD Million) By Product (2021-2032)
Table 20 Europe Ethical Food Revenue (USD Million) By Type (2021-2032)
Table 21 Europe Ethical Food Revenue (USD Million) By Application (2021-2032)
Table 22 Europe Ethical Food Revenue (USD Million) By Product (2021-2032)
Table 23 Asia Pacific Ethical Food Revenue (USD Million) By Type (2021-2032)
Table 24 Asia Pacific Ethical Food Revenue (USD Million) By Application (2021-2032)
Table 25 Asia Pacific Ethical Food Revenue (USD Million) By Product (2021-2032)
Table 26 South America Ethical Food Revenue (USD Million) By Type (2021-2032)
Table 27 South America Ethical Food Revenue (USD Million) By Application (2021-2032)
Table 28 South America Ethical Food Revenue (USD Million) By Product (2021-2032)
Table 29 Middle East and Africa Ethical Food Revenue (USD Million) By Type (2021-2032)
Table 30 Middle East and Africa Ethical Food Revenue (USD Million) By Application (2021-2032)
Table 31 Middle East and Africa Ethical Food Revenue (USD Million) By Product (2021-2032)
LIST OF FIGURES
Figure 1. Market Scope
Figure 2. Pricing Forecasts Per Unit, 2023- 2032
Figure 3. Porter’s Five Forces
Figure 4. Global Ethical Food Market Revenue (USD Million) By Regions (2021-2032)
Figure 5. Global Ethical Food Market Share (%) By Regions (2023)
Figure 6. North America Ethical Food Revenue (USD Million) By Country (2021-2032)
Figure 7. United States Ethical Food Revenue (USD Million) By Country (2021-2032)
Figure 8. Canada Ethical Food Revenue (USD Million) By Country (2021-2032)
Figure 9. Mexico Ethical Food Revenue (USD Million) By Country (2021-2032)
Figure 10. Europe Ethical Food Revenue (USD Million) By Country (2021-2032)
Figure 11. Germany Ethical Food Revenue (USD Million) By Country (2021-2032)
Figure 12. France Ethical Food Revenue (USD Million) By Country (2021-2032)
Figure 13. United Kingdom Ethical Food Revenue (USD Million) By Country (2021-2032)
Figure 14. Spain Ethical Food Revenue (USD Million) By Country (2021-2032)
Figure 15. Italy Ethical Food Revenue (USD Million) By Country (2021-2032)
Figure 16. Russia Ethical Food Revenue (USD Million) By Country (2021-2032)
Figure 17. Rest of Europe Ethical Food Revenue (USD Million) By Country (2021-2032)
Figure 11. Asia Pacific Ethical Food Revenue (USD Million) By Country (2021-2032)
Figure 12. China Ethical Food Revenue (USD Million) By Country (2021-2032)
Figure 13. Japan Ethical Food Revenue (USD Million) By Country (2021-2032)
Figure 14. India Ethical Food Revenue (USD Million) By Country (2021-2032)
Figure 15. South Korea Ethical Food Revenue (USD Million) By Country (2021-2032)
Figure 16. Australia Ethical Food Revenue (USD Million) By Country (2021-2032)
Figure 17. South East Asia Ethical Food Revenue (USD Million) By Country (2021-2032)
Figure 18. South America Ethical Food Revenue (USD Million) By Country (2021-2032)
Figure 19. Brazil Ethical Food Revenue (USD Million) By Country (2021-2032)
Figure 20. Argentina Ethical Food Revenue (USD Million) By Country (2021-2032)
Figure 21. Rest of Asia Pacific Ethical Food Revenue (USD Million) By Country (2021-2032)
Figure 22. Middle East and Africa Ethical Food Revenue (USD Million) By Region (2021-2032)
Figure 23. Saudi Arabia Ethical Food Revenue (USD Million) By Region (2021-2032)
Figure 24. The UAE Ethical Food Revenue (USD Million) By Region (2021-2032)
Figure 25. Rest of Middle East Ethical Food Revenue (USD Million) By Region (2021-2032)
Figure 26. South Africa Ethical Food Revenue (USD Million) By Region (2021-2032)
Figure 27. Africa Ethical Food Revenue (USD Million) By Region (2021-2032)
Figure 28. North America Ethical Food Revenue (USD Million) By Type (2021-2032)
Figure 29. North America Ethical Food Revenue (USD Million) By Application (2021-2032)
Figure 30. North America Ethical Food Revenue (USD Million) By Product (2021-2032)
Figure 31. Europe Ethical Food Revenue (USD Million) By Type (2021-2032)
Figure 32. Europe Ethical Food Revenue (USD Million) By Application (2021-2032)
Figure 33. Europe Ethical Food Revenue (USD Million) By Product (2021-2032)
Figure 34. Asia Pacific Ethical Food Revenue (USD Million) By Type (2021-2032)
Figure 35. Asia Pacific Ethical Food Revenue (USD Million) By Application (2021-2032)
Figure 36. Asia Pacific Ethical Food Revenue (USD Million) By Product (2021-2032)
Figure 37. South America Ethical Food Revenue (USD Million) By Type (2021-2032)
Figure 38. South America Ethical Food Revenue (USD Million) By Application (2021-2032)
Figure 39. South America Ethical Food Revenue (USD Million) By Product (2021-2032)
Figure 40. Middle East and Africa Ethical Food Revenue (USD Million) By Type (2021-2032)
Figure 41. Middle East and Africa Ethical Food Revenue (USD Million) By Application (2021-2032)
Figure 42. Middle East and Africa Ethical Food Revenue (USD Million) By Product (2021-2032)
By Type
Organic
Natural
By Process
Processed
Unprocessed
By Distribution Channel
Online
Offline
Countries Analyzed
North America (US, Canada, Mexico)
Europe (Germany, UK, France, Spain, Italy, Russia, Rest of Europe)
Asia Pacific (China, India, Japan, South Korea, Australia, South East Asia, Rest of Asia)
South America (Brazil, Argentina, Rest of South America)
Middle East and Africa (Saudi Arabia, UAE, Rest of Middle East, South Africa, Egypt, Rest of Africa)
