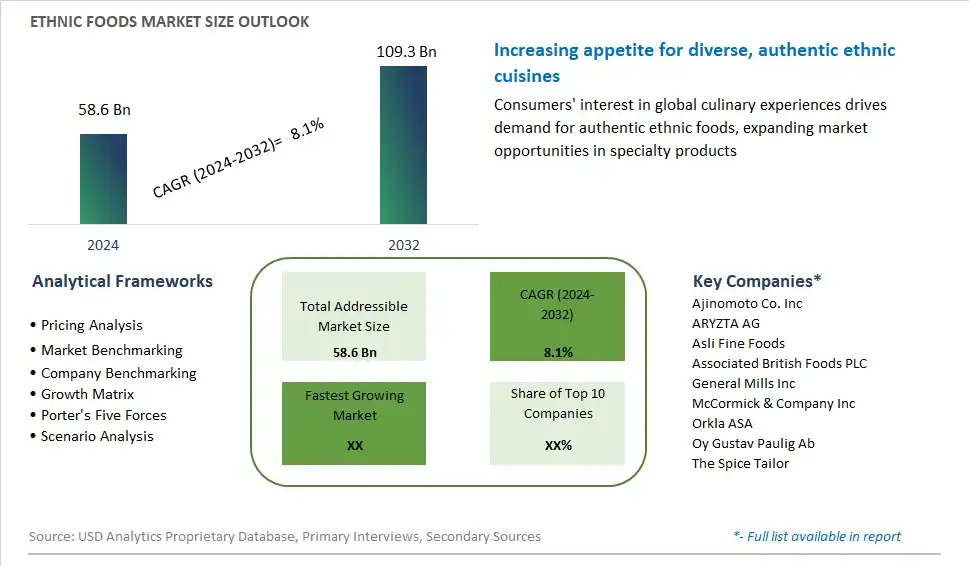
Global Ethnic Foods Market Size is valued at $58.6 Billion in 2024 and is forecast to register a growth rate (CAGR) of 8.1% to reach $109.3 Billion by 2032.
The global Ethnic Foods Market Comprehensive Study analyzes and forecasts the market size across 6 regions and 24 countries for diverse segments -By Type (Chinese, Japanese, Mexican, Italian, Others), By Distribution Channel (Hypermarkets/Supermarkets, Convenience Stores, Grocery Stores, Online, Others)
An Introduction to Ethnic Foods Market
In 2024, the ethnic foods market is expanding rapidly as consumers increasingly seek diverse and authentic culinary experiences. Ethnic foods encompass a wide range of cuisines, including Asian, Latin American, Middle Eastern, and African, each offering unique flavors and ingredients. The market is driven by globalization, cultural exchange, and the adventurous palates of modern consumers. Innovations in packaging and preservation techniques are making ethnic foods more accessible and convenient, allowing for longer shelf life and ease of preparation. Additionally, the rise of fusion cuisine and the incorporation of ethnic flavors into mainstream dishes are broadening the market appeal. Health-conscious consumers are also drawn to ethnic foods that highlight traditional cooking methods and use of fresh, natural ingredients. As a result, the ethnic foods market is experiencing robust growth, driven by the desire for culinary diversity and authenticity.
Ethnic Foods Competitive Landscape
The market report analyses the leading companies in the industry including Ajinomoto Co. Inc, ARYZTA AG, Asli Fine Foods, Associated British Foods PLC, General Mills Inc, McCormick & Company Inc, Orkla ASA, Oy Gustav Paulig Ab, The Spice Tailor, and Others.
Ethnic Foods Market Dynamics
Ethnic Foods Market Trend: Increasing Diversity and Adventurous Palates
One of the most prominent trends in the ethnic foods market is the increasing diversity and adventurous palates of consumers. As globalization continues to connect people from different cultures and regions, there is a growing interest in exploring and experiencing cuisines from around the world. Consumers are becoming more open to trying new flavors, spices, and cooking techniques inspired by various ethnic traditions. This trend is driven by factors such as multiculturalism, travel experiences, and the influence of social media, which expose individuals to a wide array of exotic and flavorful dishes. Ethnic foods offer consumers the opportunity to embark on culinary journeys without leaving their homes, allowing them to discover and enjoy authentic flavors and dishes from different cultures. As a result, the ethnic foods market is experiencing growth as consumers seek to expand their culinary horizons and indulge in diverse and exciting dining experiences.
Market Driver: Changing Demographics and Cultural Integration
The primary driver of the ethnic foods market is the changing demographics and cultural integration in society. With increasing globalization, urbanization, and migration, communities around the world are becoming more culturally diverse, leading to greater demand for ethnic foods that cater to the tastes and preferences of different ethnic groups and immigrant populations. As people from diverse backgrounds settle in new countries or regions, they often seek familiar foods that remind them of their homeland or cultural heritage. Moreover, mainstream consumers are also embracing ethnic foods as they become more curious and receptive to culinary diversity. This driver is fueled by the desire for authenticity, variety, and nostalgia, prompting retailers, restaurants, and food manufacturers to offer a wide range of ethnic food options to meet the needs of diverse populations. By understanding and responding to the cultural and culinary preferences of their target markets, businesses can capitalize on this driver and tap into the growing demand for ethnic foods.
Market Opportunity: Innovation in Fusion Cuisine and Ready-to-Eat Meals
A significant opportunity for the ethnic foods market lies in innovation in fusion cuisine and ready-to-eat meals. As consumers seek unique flavor combinations and convenient dining solutions, there is room for creativity and experimentation in blending culinary traditions from different ethnicities. Fusion cuisine, which combines elements of two or more culinary traditions, offers an exciting opportunity to create innovative dishes that appeal to diverse palates. Manufacturers and chefs can explore fusion concepts that marry flavors, ingredients, and cooking techniques from various ethnic cuisines, resulting in exciting and unexpected taste experiences. Additionally, there is an opportunity to develop ready-to-eat ethnic meals that provide convenience and authenticity for busy consumers seeking quick and flavorful dining options. By introducing innovative fusion dishes and convenient ready-to-eat meals, businesses can cater to the evolving tastes and lifestyles of consumers, differentiate themselves in the market, and drive growth in the ethnic foods segment.
Ethnic Foods Market Share Analysis: Italian held the dominant market share in 2024
Within the Ethnic Foods Market, the Italian segment is the largest, commanding a significant share of the industry. This dominance can be attributed to several factors, including widespread popularity, culinary diversity, and cultural influence. Italian cuisine is renowned worldwide for its rich flavors, fresh ingredients, and traditional recipes passed down through generations. Pasta, pizza, risotto, and antipasti are just a few examples of iconic Italian dishes that have become staples in households and restaurants globally. Additionally, Italian cuisine appeals to a wide range of palates, with options ranging from hearty comfort foods to elegant gourmet dishes. The enduring popularity of Italian cuisine is further fueled by the proliferation of Italian restaurants, pizzerias, and specialty food stores in various countries, catering to the growing demand for authentic and high-quality Italian fare. As consumers continue to embrace diverse culinary experiences and seek out global flavors, the Italian segment is expected to maintain its stronghold in the Ethnic Foods Market, driving market growth and shaping culinary trends worldwide.
Ethnic Foods Market Share Analysis: Online Distribution Channel market is poised to register the fastest growth rae over the forecast period to 2032
Among the distribution channels in the Ethnic Foods Market, the online segment stands out as the fastest-growing, experiencing significant expansion in recent years. The robust growth outlook is driven by the increasing adoption of e-commerce platforms, driven by convenience, accessibility, and the growing trend of online grocery shopping. Online platforms offer consumers a diverse selection of ethnic foods from around the world, allowing them to explore and purchase products that may not be readily available in their local area. Further, the COVID-19 pandemic has accelerated the shift towards online shopping, as consumers prioritize safety and convenience. Additionally, online retailers often offer competitive prices, discounts, and subscription options, enhancing the value proposition for consumers. As the online distribution channel continues to evolve and innovate, offering a seamless shopping experience and a wide range of ethnic food options, it is expected to sustain its rapid growth trajectory, reshaping the way consumers access and purchase ethnic foods.
Ethnic Foods Market Segmentation
By Type
Chinese
Japanese
Mexican
Italian
Others
By Distribution Channel
Hypermarkets/Supermarkets
Convenience Stores
Grocery Stores
Online
Others
Countries Analyzed
North America (US, Canada, Mexico)
Europe (Germany, UK, France, Spain, Italy, Russia, Rest of Europe)
Asia Pacific (China, India, Japan, South Korea, Australia, South East Asia, Rest of Asia)
South America (Brazil, Argentina, Rest of South America)
Middle East and Africa (Saudi Arabia, UAE, Rest of Middle East, South Africa, Egypt, Rest of Africa)
Ethnic Foods Companies Profiled in the Study
Ajinomoto Co. Inc
ARYZTA AG
Asli Fine Foods
Associated British Foods PLC
General Mills Inc
McCormick & Company Inc
Orkla ASA
Oy Gustav Paulig Ab
The Spice Tailor
*- List Not Exhaustive
Chapter 1. TABLE OF CONTENTS
Chapter 2. Introduction to Ethnic Foods Market
2.1. Market Overview
2.2. Key Statistics and Report Highlights
2.3. Scope of the Comprehensive Study
2.3.1. Market Definition
2.3.2 Countries and Regions Covered
2.3.3 Research Objective
2.3.4 Units, Currency, and Conversions
2.3.5 Industry Value Chain
2.4. Key Market Segments
2.5. Key Companies
2.6. Study Period
Chapter 3. Strategic Analysis Review
3.1. Ethnic Foods Pricing Analysis and Forecast
3.2. Porter’s Five Forces
3.3. Market Ecosystem
3.4. SWOT Analysis
3.5. Regulatory Scenario
3.3. Effects of Inflation, Russia-Ukraine War, moderating economic growth, and other macroeconomic factors
Chapter 4. Competitive Landscape
4.1. Market Share Analysis
4.1.1. Global Ethnic Foods Market Share by Company, 2023
4.1.2. Product Offerings of Leading Ethnic Foods Companies
4.2. Market Entropy
4.2.1. New Product Launches in the Industry
4.2.2. Mergers, Acquisitions, Joint ventures, and Partnerships
4.3. Key Strategies and Best Practices
Chapter 5. Global Market Projections: Best, Reference, and Low Case Scenarios
5.1. Growth Analysis- Case Scenario Definitions
5.2. Low Growth Case Scenario Forecasts
5.3. Reference Growth Case Scenario Forecasts
5.4. High Growth Case Scenario Forecasts
Chapter 6. Market Dynamics
6.1. Ethnic Foods Market Drivers
6.2. Ethnic Foods Market Challenges
6.6. Ethnic Foods Market Opportunities
6.4. Ethnic Foods Market Trends
Chapter 7. Global Ethnic Foods Market Outlook Trends
7.1. Global Ethnic Foods Revenue (USD Million) and CAGR (%) by Type (2021-2032)
7.2. Global Ethnic Foods Revenue (USD Million) and CAGR (%) by Application (2021-2032)
7.3. Global Ethnic Foods Revenue (USD Million) and CAGR (%) by Product (2021-2032)
By Type
Chinese
Japanese
Mexican
Italian
Others
By Distribution Channel
Hypermarkets/Supermarkets
Convenience Stores
Grocery Stores
Online
Others
Chapter 8. Global Ethnic Foods Regional Analysis and Outlook
8.1. Global Ethnic Foods Revenue (USD Million) By Regions (2021- 2032)
8.2. North America Ethnic Foods Revenue (USD Million) by Country (2021-2032)
8.2.1. United States Ethnic Foods Regional Analysis and Outlook
8.2.2. Canada Ethnic Foods Regional Analysis and Outlook
8.2.3. Mexico Ethnic Foods Regional Analysis and Outlook
8.3. Europe Ethnic Foods Revenue (USD Million), by Country (2021-2032)
8.3.1. Germany Ethnic Foods Regional Analysis and Outlook
8.3.2. France Ethnic Foods Regional Analysis and Outlook
8.3.3. United Kingdom Ethnic Foods Regional Analysis and Outlook
8.3.4. Spain Ethnic Foods Regional Analysis and Outlook
8.3.5. Italy Ethnic Foods Regional Analysis and Outlook
8.3.6. Russia Ethnic Foods Regional Analysis and Outlook
8.3.7. Rest of Europe Ethnic Foods Regional Analysis and Outlook
8.4. Asia Pacific Ethnic Foods Revenue (USD Million) by Country (2021-2032)
8.4.1. China Ethnic Foods Regional Analysis and Outlook
8.4.2. Japan Ethnic Foods Regional Analysis and Outlook
8.4.3. India Ethnic Foods Regional Analysis and Outlook
8.4.4. South Korea Ethnic Foods Regional Analysis and Outlook
8.4.5. Australia Ethnic Foods Regional Analysis and Outlook
8.4.6. South East Asia Ethnic Foods Regional Analysis and Outlook
8.4.7. Rest of Asia Pacific Ethnic Foods Regional Analysis and Outlook
8.5. South America Ethnic Foods Revenue (USD Million), by Country (2021-2032)
8.5.1. Brazil Ethnic Foods Regional Analysis and Outlook
8.5.2. Argentina Ethnic Foods Regional Analysis and Outlook
8.5.3. Rest of South America Ethnic Foods Regional Analysis and Outlook
8.6. Middle East and Africa Ethnic Foods Revenue (USD Million) by Country (2021-2032)
8.6.1. Middle East Ethnic Foods Regional Analysis and Outlook
8.6.2. Africa Ethnic Foods Regional Analysis and Outlook
Chapter 9. North America Ethnic Foods Analysis and Outlook
9.1. North America Ethnic Foods Revenue (USD Million) by Segments (2021-2032)
9.1.1. North America Ethnic Foods Revenue (USD Million) by Type (2021-2032)
9.1.2. North America Ethnic Foods Revenue (USD Million) by Application (2021-2032)
9.1.3. North America Ethnic Foods Revenue (USD Million) by Product (2021-2032)
By Type
Chinese
Japanese
Mexican
Italian
Others
By Distribution Channel
Hypermarkets/Supermarkets
Convenience Stores
Grocery Stores
Online
Others
Chapter 10. Europe Ethnic Foods Analysis and Outlook
10.1. Europe Ethnic Foods Revenue (USD Million), by Segments (USD Million) (2021-2032)
10.1.1. Europe Ethnic Foods Revenue (USD Million) by Type (2021-2032)
10.1.2. Europe Ethnic Foods Revenue (USD Million) by Application (2021-2032)
10.1.3. Europe Ethnic Foods Revenue (USD Million) by Product (2021-2032)
By Type
Chinese
Japanese
Mexican
Italian
Others
By Distribution Channel
Hypermarkets/Supermarkets
Convenience Stores
Grocery Stores
Online
Others
Chapter 11. Asia Pacific Ethnic Foods Analysis and Outlook
11.1. Asia Pacific Ethnic Foods Revenue (USD Million), and Revenue (USD Million) by Segments (2021-2032)
11.1.1. Asia Pacific Ethnic Foods Revenue (USD Million) by Type (2021-2032)
11.1.2. Asia Pacific Ethnic Foods Revenue (USD Million) by Application (2021-2032)
11.1.3. Asia Pacific Ethnic Foods Revenue (USD Million) by Product (2021-2032)
By Type
Chinese
Japanese
Mexican
Italian
Others
By Distribution Channel
Hypermarkets/Supermarkets
Convenience Stores
Grocery Stores
Online
Others
Chapter 12. South America Ethnic Foods Analysis and Outlook
12.1. South America Ethnic Foods Revenue (USD Million), by Segments (2021-2032)
12.1.1. South America Ethnic Foods Revenue (USD Million) by Type (2021-2032)
12.1.2. South America Ethnic Foods Revenue (USD Million) by Application (2021-2032)
12.1.3. South America Ethnic Foods Revenue (USD Million) by Product (2021-2032)
By Type
Chinese
Japanese
Mexican
Italian
Others
By Distribution Channel
Hypermarkets/Supermarkets
Convenience Stores
Grocery Stores
Online
Others
Chapter 13. Middle East and Africa Ethnic Foods Analysis and Outlook
13.1. Middle East and Africa Ethnic Foods Revenue (USD Million), by Segments (2021-2032)
13.1.1. Middle East and Africa Ethnic Foods Revenue (USD Million) by Type (2021-2032)
13.1.2. Middle East and Africa Ethnic Foods Revenue (USD Million) by Application (2021-2032)
13.1.3. Middle East and Africa Ethnic Foods Revenue (USD Million) by Product (2021-2032)
By Type
Chinese
Japanese
Mexican
Italian
Others
By Distribution Channel
Hypermarkets/Supermarkets
Convenience Stores
Grocery Stores
Online
Others
Chapter 14. Ethnic Foods Company Profiles
14.1 Business Overview
14.2 Product Profiles
14.3 SWOT Profiles
14.5 Recent Developments
14.6 Financial Profile
List of Companies
Ajinomoto Co. Inc
ARYZTA AG
Asli Fine Foods
Associated British Foods PLC
General Mills Inc
McCormick & Company Inc
Orkla ASA
Oy Gustav Paulig Ab
The Spice Tailor
15. Methodology and Data Sources
15.1 Customization Offerings
15.2 Subscription Services
15.3 Related Reports
15.4 Publisher Expertise
LIST OF TABLES
Table 1 Market Segmentation Analysis
Table 2 Global Ethnic Foods Market Share of Leading Companies, 2023
Table 3 Product Offerings of Leading Companies
Table 4 Low Growth Scenario Forecasts
Table 5 Reference Case Growth Scenario
Table 6 High Growth Case Scenario
Table 7 Global Ethnic Foods Revenue (USD Million) And CAGR (%) By Type (2021-2032)
Table 8 Global Ethnic Foods Revenue (USD Million) And CAGR (%) By Application (2021-2032)
Table 9 Global Ethnic Foods Revenue (USD Million) And CAGR (%) By Product (2021-2032)
Table 10 Global Ethnic Foods Market Revenue (USD Million) By Regions (2021-2032)
Table 11 Global Ethnic Foods Market Share (%) By Regions (2021-2032)
Table 12 North America Ethnic Foods Revenue (USD Million) By Country (2021-2032)
Table 13 Europe Ethnic Foods Revenue (USD Million) By Country (2021-2032)
Table 14 Asia Pacific Ethnic Foods Revenue (USD Million) By Country (2021-2032)
Table 15 South America Ethnic Foods Revenue (USD Million) By Country (2021-2032)
Table 16 Middle East and Africa Ethnic Foods Revenue (USD Million) By Region (2021-2032)
Table 17 North America Ethnic Foods Revenue (USD Million) By Type (2021-2032)
Table 18 North America Ethnic Foods Revenue (USD Million) By Application (2021-2032)
Table 19 North America Ethnic Foods Revenue (USD Million) By Product (2021-2032)
Table 20 Europe Ethnic Foods Revenue (USD Million) By Type (2021-2032)
Table 21 Europe Ethnic Foods Revenue (USD Million) By Application (2021-2032)
Table 22 Europe Ethnic Foods Revenue (USD Million) By Product (2021-2032)
Table 23 Asia Pacific Ethnic Foods Revenue (USD Million) By Type (2021-2032)
Table 24 Asia Pacific Ethnic Foods Revenue (USD Million) By Application (2021-2032)
Table 25 Asia Pacific Ethnic Foods Revenue (USD Million) By Product (2021-2032)
Table 26 South America Ethnic Foods Revenue (USD Million) By Type (2021-2032)
Table 27 South America Ethnic Foods Revenue (USD Million) By Application (2021-2032)
Table 28 South America Ethnic Foods Revenue (USD Million) By Product (2021-2032)
Table 29 Middle East and Africa Ethnic Foods Revenue (USD Million) By Type (2021-2032)
Table 30 Middle East and Africa Ethnic Foods Revenue (USD Million) By Application (2021-2032)
Table 31 Middle East and Africa Ethnic Foods Revenue (USD Million) By Product (2021-2032)
LIST OF FIGURES
Figure 1. Market Scope
Figure 2. Pricing Forecasts Per Unit, 2023- 2032
Figure 3. Porter’s Five Forces
Figure 4. Global Ethnic Foods Market Revenue (USD Million) By Regions (2021-2032)
Figure 5. Global Ethnic Foods Market Share (%) By Regions (2023)
Figure 6. North America Ethnic Foods Revenue (USD Million) By Country (2021-2032)
Figure 7. United States Ethnic Foods Revenue (USD Million) By Country (2021-2032)
Figure 8. Canada Ethnic Foods Revenue (USD Million) By Country (2021-2032)
Figure 9. Mexico Ethnic Foods Revenue (USD Million) By Country (2021-2032)
Figure 10. Europe Ethnic Foods Revenue (USD Million) By Country (2021-2032)
Figure 11. Germany Ethnic Foods Revenue (USD Million) By Country (2021-2032)
Figure 12. France Ethnic Foods Revenue (USD Million) By Country (2021-2032)
Figure 13. United Kingdom Ethnic Foods Revenue (USD Million) By Country (2021-2032)
Figure 14. Spain Ethnic Foods Revenue (USD Million) By Country (2021-2032)
Figure 15. Italy Ethnic Foods Revenue (USD Million) By Country (2021-2032)
Figure 16. Russia Ethnic Foods Revenue (USD Million) By Country (2021-2032)
Figure 17. Rest of Europe Ethnic Foods Revenue (USD Million) By Country (2021-2032)
Figure 11. Asia Pacific Ethnic Foods Revenue (USD Million) By Country (2021-2032)
Figure 12. China Ethnic Foods Revenue (USD Million) By Country (2021-2032)
Figure 13. Japan Ethnic Foods Revenue (USD Million) By Country (2021-2032)
Figure 14. India Ethnic Foods Revenue (USD Million) By Country (2021-2032)
Figure 15. South Korea Ethnic Foods Revenue (USD Million) By Country (2021-2032)
Figure 16. Australia Ethnic Foods Revenue (USD Million) By Country (2021-2032)
Figure 17. South East Asia Ethnic Foods Revenue (USD Million) By Country (2021-2032)
Figure 18. South America Ethnic Foods Revenue (USD Million) By Country (2021-2032)
Figure 19. Brazil Ethnic Foods Revenue (USD Million) By Country (2021-2032)
Figure 20. Argentina Ethnic Foods Revenue (USD Million) By Country (2021-2032)
Figure 21. Rest of Asia Pacific Ethnic Foods Revenue (USD Million) By Country (2021-2032)
Figure 22. Middle East and Africa Ethnic Foods Revenue (USD Million) By Region (2021-2032)
Figure 23. Saudi Arabia Ethnic Foods Revenue (USD Million) By Region (2021-2032)
Figure 24. The UAE Ethnic Foods Revenue (USD Million) By Region (2021-2032)
Figure 25. Rest of Middle East Ethnic Foods Revenue (USD Million) By Region (2021-2032)
Figure 26. South Africa Ethnic Foods Revenue (USD Million) By Region (2021-2032)
Figure 27. Africa Ethnic Foods Revenue (USD Million) By Region (2021-2032)
Figure 28. North America Ethnic Foods Revenue (USD Million) By Type (2021-2032)
Figure 29. North America Ethnic Foods Revenue (USD Million) By Application (2021-2032)
Figure 30. North America Ethnic Foods Revenue (USD Million) By Product (2021-2032)
Figure 31. Europe Ethnic Foods Revenue (USD Million) By Type (2021-2032)
Figure 32. Europe Ethnic Foods Revenue (USD Million) By Application (2021-2032)
Figure 33. Europe Ethnic Foods Revenue (USD Million) By Product (2021-2032)
Figure 34. Asia Pacific Ethnic Foods Revenue (USD Million) By Type (2021-2032)
Figure 35. Asia Pacific Ethnic Foods Revenue (USD Million) By Application (2021-2032)
Figure 36. Asia Pacific Ethnic Foods Revenue (USD Million) By Product (2021-2032)
Figure 37. South America Ethnic Foods Revenue (USD Million) By Type (2021-2032)
Figure 38. South America Ethnic Foods Revenue (USD Million) By Application (2021-2032)
Figure 39. South America Ethnic Foods Revenue (USD Million) By Product (2021-2032)
Figure 40. Middle East and Africa Ethnic Foods Revenue (USD Million) By Type (2021-2032)
Figure 41. Middle East and Africa Ethnic Foods Revenue (USD Million) By Application (2021-2032)
Figure 42. Middle East and Africa Ethnic Foods Revenue (USD Million) By Product (2021-2032)
By Type
Chinese
Japanese
Mexican
Italian
Others
By Distribution Channel
Hypermarkets/Supermarkets
Convenience Stores
Grocery Stores
Online
Others
Countries Analyzed
North America (US, Canada, Mexico)
Europe (Germany, UK, France, Spain, Italy, Russia, Rest of Europe)
Asia Pacific (China, India, Japan, South Korea, Australia, South East Asia, Rest of Asia)
South America (Brazil, Argentina, Rest of South America)
Middle East and Africa (Saudi Arabia, UAE, Rest of Middle East, South Africa, Egypt, Rest of Africa)
