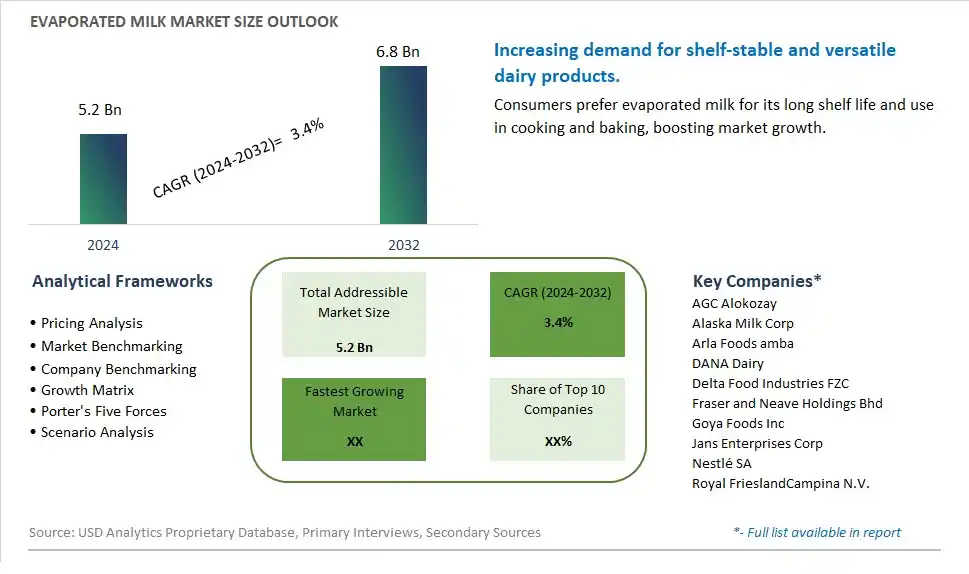
Global Evaporated Milk Market Size is valued at $5.2 Billion in 2024 and is forecast to register a growth rate (CAGR) of 3.4% to reach $6.8 Billion by 2032.
The global Evaporated Milk Market Comprehensive Study analyzes and forecasts the market size across 6 regions and 24 countries for diverse segments -By Type (Skimmed, Whole), By Distribution Channel (Online, Offline)
An Introduction to Evaporated Milk Market
The evaporated milk market in 2024 is seeing steady growth, driven by its versatility and long shelf life, making it a staple in many households and foodservice establishments. Evaporated milk, a shelf-stable dairy product, is used in a wide range of culinary applications, from baking and cooking to coffee and tea. The market is benefiting from the increasing demand for convenient and nutritious food options. Innovations in packaging, such as eco-friendly and easy-to-open cans, are enhancing consumer appeal. Additionally, the availability of fortified and flavored versions of evaporated milk is catering to diverse dietary preferences and expanding the market reach.
Evaporated Milk Competitive Landscape
The market report analyses the leading companies in the industry including AGC Alokozay, Alaska Milk Corp, Arla Foods amba, DANA Dairy, Delta Food Industries FZC, Fraser and Neave Holdings Bhd, Goya Foods Inc, Jans Enterprises Corp, Nestlé SA, Royal FrieslandCampina N.V., and Others.
Evaporated Milk Market Dynamics
Evaporated Milk Market Trend: Shift Towards Healthier and Plant-Based Alternatives
The most prominent market trend in the evaporated milk industry is the shift towards healthier and plant-based alternatives. With increasing awareness of dietary choices and health concerns, consumers are seeking dairy-free and lactose-free options. Plant-based evaporated milk made from ingredients like soy, almond, coconut, or oat milk is gaining popularity due to its perceived health benefits and suitability for vegan and lactose-intolerant individuals. This trend reflects changing consumer preferences towards more sustainable, ethical, and health-conscious food products.
Market Driver: Growing Demand for Convenience and Versatility in Cooking
The primary market driver for evaporated milk is the growing demand for convenience and versatility in cooking. Evaporated milk serves as a convenient ingredient in a wide range of recipes, including soups, sauces, desserts, and beverages, due to its creamy texture and long shelf life. As consumers continue to lead busy lifestyles and seek easy-to-prepare meal solutions, evaporated milk offers a convenient option for enhancing the flavor and texture of various dishes. Its ability to add richness and creaminess to both savory and sweet recipes makes it a staple pantry item for home cooks and foodservice establishments alike.
Market Opportunity: Expansion of Specialty and Flavored Varieties
An opportunity for the evaporated milk market lies in the expansion of specialty and flavored varieties to cater to diverse consumer preferences and culinary trends. Manufacturers can capitalize on consumer demand for unique and indulgent flavors by offering a wider range of options, such as vanilla, chocolate, caramel, and pumpkin spice. Additionally, there is an opportunity to innovate with organic, low-sugar, or fortified formulations to meet the needs of health-conscious consumers. By introducing new flavors and formulations that appeal to different taste preferences and dietary requirements, companies can differentiate their products and capture a larger share of the market. This approach allows for greater product diversification and innovation to meet evolving consumer demands in the evaporated milk segment.
Evaporated Milk Market Share Analysis: Whole Evaporated Milk held the dominant market share in 2024
Within the Evaporated Milk Market, the whole evaporated milk segment is the largest, commanding a significant share of the industry. This dominance can be attributed to several factors, including consumer preferences, versatility, and nutritional value. Whole evaporated milk is made by removing about 60% of the water content from fresh milk, resulting in a rich and creamy product with a higher fat content compared to skimmed evaporated milk. Its creamy texture and rich flavor make it a versatile ingredient in a variety of culinary applications, including baking, cooking, and beverage preparation. Further, whole evaporated milk is valued for its nutritional benefits, as it provides essential nutrients such as calcium, protein, and vitamins A and D. Its long shelf life and convenient packaging also contribute to its popularity among consumers seeking convenient and nutritious dairy products. As consumer demand for wholesome and flavorful ingredients continues to grow, the whole evaporated milk segment is expected to maintain its stronghold in the Evaporated Milk Market, driving market growth and innovation.
Evaporated Milk Market Share Analysis: Online Distribution Channel market is poised to register the fastest growth rae over the forecast period to 2032
Among the distribution channels in the Evaporated Milk Market, the online segment stands out as the fastest-growing, experiencing significant expansion in recent years. The robust growth outlook is driven by the increasing adoption of e-commerce platforms, driven by convenience, accessibility, and changing consumer shopping habits. Online channels offer consumers a convenient way to purchase evaporated milk from the comfort of their homes, with the added benefits of doorstep delivery and a wide selection of brands and packaging options. Further, the COVID-19 pandemic has accelerated the shift towards online shopping, as consumers prioritize safety and minimize physical contact. Additionally, online retailers often offer competitive prices, discounts, and subscription options, further enhancing the appeal of purchasing evaporated milk online. As the online distribution channel continues to evolve and innovate, offering a seamless shopping experience and a wide range of evaporated milk products, it is expected to sustain its rapid growth trajectory, reshaping the way consumers access and purchase dairy products.
Evaporated Milk Market Segmentation
By Type
Skimmed
Whole
By Distribution Channel
Online
Offline
Countries Analyzed
North America (US, Canada, Mexico)
Europe (Germany, UK, France, Spain, Italy, Russia, Rest of Europe)
Asia Pacific (China, India, Japan, South Korea, Australia, South East Asia, Rest of Asia)
South America (Brazil, Argentina, Rest of South America)
Middle East and Africa (Saudi Arabia, UAE, Rest of Middle East, South Africa, Egypt, Rest of Africa)
Evaporated Milk Companies Profiled in the Study
AGC Alokozay
Alaska Milk Corp
Arla Foods amba
DANA Dairy
Delta Food Industries FZC
Fraser and Neave Holdings Bhd
Goya Foods Inc
Jans Enterprises Corp
Nestlé SA
Royal FrieslandCampina N.V.
*- List Not Exhaustive
Chapter 1. TABLE OF CONTENTS
Chapter 2. Introduction to Evaporated Milk Market
2.1. Market Overview
2.2. Key Statistics and Report Highlights
2.3. Scope of the Comprehensive Study
2.3.1. Market Definition
2.3.2 Countries and Regions Covered
2.3.3 Research Objective
2.3.4 Units, Currency, and Conversions
2.3.5 Industry Value Chain
2.4. Key Market Segments
2.5. Key Companies
2.6. Study Period
Chapter 3. Strategic Analysis Review
3.1. Evaporated Milk Pricing Analysis and Forecast
3.2. Porter’s Five Forces
3.3. Market Ecosystem
3.4. SWOT Analysis
3.5. Regulatory Scenario
3.3. Effects of Inflation, Russia-Ukraine War, moderating economic growth, and other macroeconomic factors
Chapter 4. Competitive Landscape
4.1. Market Share Analysis
4.1.1. Global Evaporated Milk Market Share by Company, 2023
4.1.2. Product Offerings of Leading Evaporated Milk Companies
4.2. Market Entropy
4.2.1. New Product Launches in the Industry
4.2.2. Mergers, Acquisitions, Joint ventures, and Partnerships
4.3. Key Strategies and Best Practices
Chapter 5. Global Market Projections: Best, Reference, and Low Case Scenarios
5.1. Growth Analysis- Case Scenario Definitions
5.2. Low Growth Case Scenario Forecasts
5.3. Reference Growth Case Scenario Forecasts
5.4. High Growth Case Scenario Forecasts
Chapter 6. Market Dynamics
6.1. Evaporated Milk Market Drivers
6.2. Evaporated Milk Market Challenges
6.6. Evaporated Milk Market Opportunities
6.4. Evaporated Milk Market Trends
Chapter 7. Global Evaporated Milk Market Outlook Trends
7.1. Global Evaporated Milk Revenue (USD Million) and CAGR (%) by Type (2021-2032)
7.2. Global Evaporated Milk Revenue (USD Million) and CAGR (%) by Application (2021-2032)
7.3. Global Evaporated Milk Revenue (USD Million) and CAGR (%) by Product (2021-2032)
By Type
Skimmed
Whole
By Distribution Channel
Online
Offline
Chapter 8. Global Evaporated Milk Regional Analysis and Outlook
8.1. Global Evaporated Milk Revenue (USD Million) By Regions (2021- 2032)
8.2. North America Evaporated Milk Revenue (USD Million) by Country (2021-2032)
8.2.1. United States Evaporated Milk Regional Analysis and Outlook
8.2.2. Canada Evaporated Milk Regional Analysis and Outlook
8.2.3. Mexico Evaporated Milk Regional Analysis and Outlook
8.3. Europe Evaporated Milk Revenue (USD Million), by Country (2021-2032)
8.3.1. Germany Evaporated Milk Regional Analysis and Outlook
8.3.2. France Evaporated Milk Regional Analysis and Outlook
8.3.3. United Kingdom Evaporated Milk Regional Analysis and Outlook
8.3.4. Spain Evaporated Milk Regional Analysis and Outlook
8.3.5. Italy Evaporated Milk Regional Analysis and Outlook
8.3.6. Russia Evaporated Milk Regional Analysis and Outlook
8.3.7. Rest of Europe Evaporated Milk Regional Analysis and Outlook
8.4. Asia Pacific Evaporated Milk Revenue (USD Million) by Country (2021-2032)
8.4.1. China Evaporated Milk Regional Analysis and Outlook
8.4.2. Japan Evaporated Milk Regional Analysis and Outlook
8.4.3. India Evaporated Milk Regional Analysis and Outlook
8.4.4. South Korea Evaporated Milk Regional Analysis and Outlook
8.4.5. Australia Evaporated Milk Regional Analysis and Outlook
8.4.6. South East Asia Evaporated Milk Regional Analysis and Outlook
8.4.7. Rest of Asia Pacific Evaporated Milk Regional Analysis and Outlook
8.5. South America Evaporated Milk Revenue (USD Million), by Country (2021-2032)
8.5.1. Brazil Evaporated Milk Regional Analysis and Outlook
8.5.2. Argentina Evaporated Milk Regional Analysis and Outlook
8.5.3. Rest of South America Evaporated Milk Regional Analysis and Outlook
8.6. Middle East and Africa Evaporated Milk Revenue (USD Million) by Country (2021-2032)
8.6.1. Middle East Evaporated Milk Regional Analysis and Outlook
8.6.2. Africa Evaporated Milk Regional Analysis and Outlook
Chapter 9. North America Evaporated Milk Analysis and Outlook
9.1. North America Evaporated Milk Revenue (USD Million) by Segments (2021-2032)
9.1.1. North America Evaporated Milk Revenue (USD Million) by Type (2021-2032)
9.1.2. North America Evaporated Milk Revenue (USD Million) by Application (2021-2032)
9.1.3. North America Evaporated Milk Revenue (USD Million) by Product (2021-2032)
By Type
Skimmed
Whole
By Distribution Channel
Online
Offline
Chapter 10. Europe Evaporated Milk Analysis and Outlook
10.1. Europe Evaporated Milk Revenue (USD Million), by Segments (USD Million) (2021-2032)
10.1.1. Europe Evaporated Milk Revenue (USD Million) by Type (2021-2032)
10.1.2. Europe Evaporated Milk Revenue (USD Million) by Application (2021-2032)
10.1.3. Europe Evaporated Milk Revenue (USD Million) by Product (2021-2032)
By Type
Skimmed
Whole
By Distribution Channel
Online
Offline
Chapter 11. Asia Pacific Evaporated Milk Analysis and Outlook
11.1. Asia Pacific Evaporated Milk Revenue (USD Million), and Revenue (USD Million) by Segments (2021-2032)
11.1.1. Asia Pacific Evaporated Milk Revenue (USD Million) by Type (2021-2032)
11.1.2. Asia Pacific Evaporated Milk Revenue (USD Million) by Application (2021-2032)
11.1.3. Asia Pacific Evaporated Milk Revenue (USD Million) by Product (2021-2032)
By Type
Skimmed
Whole
By Distribution Channel
Online
Offline
Chapter 12. South America Evaporated Milk Analysis and Outlook
12.1. South America Evaporated Milk Revenue (USD Million), by Segments (2021-2032)
12.1.1. South America Evaporated Milk Revenue (USD Million) by Type (2021-2032)
12.1.2. South America Evaporated Milk Revenue (USD Million) by Application (2021-2032)
12.1.3. South America Evaporated Milk Revenue (USD Million) by Product (2021-2032)
By Type
Skimmed
Whole
By Distribution Channel
Online
Offline
Chapter 13. Middle East and Africa Evaporated Milk Analysis and Outlook
13.1. Middle East and Africa Evaporated Milk Revenue (USD Million), by Segments (2021-2032)
13.1.1. Middle East and Africa Evaporated Milk Revenue (USD Million) by Type (2021-2032)
13.1.2. Middle East and Africa Evaporated Milk Revenue (USD Million) by Application (2021-2032)
13.1.3. Middle East and Africa Evaporated Milk Revenue (USD Million) by Product (2021-2032)
By Type
Skimmed
Whole
By Distribution Channel
Online
Offline
Chapter 14. Evaporated Milk Company Profiles
14.1 Business Overview
14.2 Product Profiles
14.3 SWOT Profiles
14.5 Recent Developments
14.6 Financial Profile
List of Companies
AGC Alokozay
Alaska Milk Corp
Arla Foods amba
DANA Dairy
Delta Food Industries FZC
Fraser and Neave Holdings Bhd
Goya Foods Inc
Jans Enterprises Corp
Nestlé SA
Royal FrieslandCampina N.V.
15. Methodology and Data Sources
15.1 Customization Offerings
15.2 Subscription Services
15.3 Related Reports
15.4 Publisher Expertise
LIST OF TABLES
Table 1 Market Segmentation Analysis
Table 2 Global Evaporated Milk Market Share of Leading Companies, 2023
Table 3 Product Offerings of Leading Companies
Table 4 Low Growth Scenario Forecasts
Table 5 Reference Case Growth Scenario
Table 6 High Growth Case Scenario
Table 7 Global Evaporated Milk Revenue (USD Million) And CAGR (%) By Type (2021-2032)
Table 8 Global Evaporated Milk Revenue (USD Million) And CAGR (%) By Application (2021-2032)
Table 9 Global Evaporated Milk Revenue (USD Million) And CAGR (%) By Product (2021-2032)
Table 10 Global Evaporated Milk Market Revenue (USD Million) By Regions (2021-2032)
Table 11 Global Evaporated Milk Market Share (%) By Regions (2021-2032)
Table 12 North America Evaporated Milk Revenue (USD Million) By Country (2021-2032)
Table 13 Europe Evaporated Milk Revenue (USD Million) By Country (2021-2032)
Table 14 Asia Pacific Evaporated Milk Revenue (USD Million) By Country (2021-2032)
Table 15 South America Evaporated Milk Revenue (USD Million) By Country (2021-2032)
Table 16 Middle East and Africa Evaporated Milk Revenue (USD Million) By Region (2021-2032)
Table 17 North America Evaporated Milk Revenue (USD Million) By Type (2021-2032)
Table 18 North America Evaporated Milk Revenue (USD Million) By Application (2021-2032)
Table 19 North America Evaporated Milk Revenue (USD Million) By Product (2021-2032)
Table 20 Europe Evaporated Milk Revenue (USD Million) By Type (2021-2032)
Table 21 Europe Evaporated Milk Revenue (USD Million) By Application (2021-2032)
Table 22 Europe Evaporated Milk Revenue (USD Million) By Product (2021-2032)
Table 23 Asia Pacific Evaporated Milk Revenue (USD Million) By Type (2021-2032)
Table 24 Asia Pacific Evaporated Milk Revenue (USD Million) By Application (2021-2032)
Table 25 Asia Pacific Evaporated Milk Revenue (USD Million) By Product (2021-2032)
Table 26 South America Evaporated Milk Revenue (USD Million) By Type (2021-2032)
Table 27 South America Evaporated Milk Revenue (USD Million) By Application (2021-2032)
Table 28 South America Evaporated Milk Revenue (USD Million) By Product (2021-2032)
Table 29 Middle East and Africa Evaporated Milk Revenue (USD Million) By Type (2021-2032)
Table 30 Middle East and Africa Evaporated Milk Revenue (USD Million) By Application (2021-2032)
Table 31 Middle East and Africa Evaporated Milk Revenue (USD Million) By Product (2021-2032)
LIST OF FIGURES
Figure 1. Market Scope
Figure 2. Pricing Forecasts Per Unit, 2023- 2032
Figure 3. Porter’s Five Forces
Figure 4. Global Evaporated Milk Market Revenue (USD Million) By Regions (2021-2032)
Figure 5. Global Evaporated Milk Market Share (%) By Regions (2023)
Figure 6. North America Evaporated Milk Revenue (USD Million) By Country (2021-2032)
Figure 7. United States Evaporated Milk Revenue (USD Million) By Country (2021-2032)
Figure 8. Canada Evaporated Milk Revenue (USD Million) By Country (2021-2032)
Figure 9. Mexico Evaporated Milk Revenue (USD Million) By Country (2021-2032)
Figure 10. Europe Evaporated Milk Revenue (USD Million) By Country (2021-2032)
Figure 11. Germany Evaporated Milk Revenue (USD Million) By Country (2021-2032)
Figure 12. France Evaporated Milk Revenue (USD Million) By Country (2021-2032)
Figure 13. United Kingdom Evaporated Milk Revenue (USD Million) By Country (2021-2032)
Figure 14. Spain Evaporated Milk Revenue (USD Million) By Country (2021-2032)
Figure 15. Italy Evaporated Milk Revenue (USD Million) By Country (2021-2032)
Figure 16. Russia Evaporated Milk Revenue (USD Million) By Country (2021-2032)
Figure 17. Rest of Europe Evaporated Milk Revenue (USD Million) By Country (2021-2032)
Figure 11. Asia Pacific Evaporated Milk Revenue (USD Million) By Country (2021-2032)
Figure 12. China Evaporated Milk Revenue (USD Million) By Country (2021-2032)
Figure 13. Japan Evaporated Milk Revenue (USD Million) By Country (2021-2032)
Figure 14. India Evaporated Milk Revenue (USD Million) By Country (2021-2032)
Figure 15. South Korea Evaporated Milk Revenue (USD Million) By Country (2021-2032)
Figure 16. Australia Evaporated Milk Revenue (USD Million) By Country (2021-2032)
Figure 17. South East Asia Evaporated Milk Revenue (USD Million) By Country (2021-2032)
Figure 18. South America Evaporated Milk Revenue (USD Million) By Country (2021-2032)
Figure 19. Brazil Evaporated Milk Revenue (USD Million) By Country (2021-2032)
Figure 20. Argentina Evaporated Milk Revenue (USD Million) By Country (2021-2032)
Figure 21. Rest of Asia Pacific Evaporated Milk Revenue (USD Million) By Country (2021-2032)
Figure 22. Middle East and Africa Evaporated Milk Revenue (USD Million) By Region (2021-2032)
Figure 23. Saudi Arabia Evaporated Milk Revenue (USD Million) By Region (2021-2032)
Figure 24. The UAE Evaporated Milk Revenue (USD Million) By Region (2021-2032)
Figure 25. Rest of Middle East Evaporated Milk Revenue (USD Million) By Region (2021-2032)
Figure 26. South Africa Evaporated Milk Revenue (USD Million) By Region (2021-2032)
Figure 27. Africa Evaporated Milk Revenue (USD Million) By Region (2021-2032)
Figure 28. North America Evaporated Milk Revenue (USD Million) By Type (2021-2032)
Figure 29. North America Evaporated Milk Revenue (USD Million) By Application (2021-2032)
Figure 30. North America Evaporated Milk Revenue (USD Million) By Product (2021-2032)
Figure 31. Europe Evaporated Milk Revenue (USD Million) By Type (2021-2032)
Figure 32. Europe Evaporated Milk Revenue (USD Million) By Application (2021-2032)
Figure 33. Europe Evaporated Milk Revenue (USD Million) By Product (2021-2032)
Figure 34. Asia Pacific Evaporated Milk Revenue (USD Million) By Type (2021-2032)
Figure 35. Asia Pacific Evaporated Milk Revenue (USD Million) By Application (2021-2032)
Figure 36. Asia Pacific Evaporated Milk Revenue (USD Million) By Product (2021-2032)
Figure 37. South America Evaporated Milk Revenue (USD Million) By Type (2021-2032)
Figure 38. South America Evaporated Milk Revenue (USD Million) By Application (2021-2032)
Figure 39. South America Evaporated Milk Revenue (USD Million) By Product (2021-2032)
Figure 40. Middle East and Africa Evaporated Milk Revenue (USD Million) By Type (2021-2032)
Figure 41. Middle East and Africa Evaporated Milk Revenue (USD Million) By Application (2021-2032)
Figure 42. Middle East and Africa Evaporated Milk Revenue (USD Million) By Product (2021-2032)
By Type
Skimmed
Whole
By Distribution Channel
Online
Offline
Countries Analyzed
North America (US, Canada, Mexico)
Europe (Germany, UK, France, Spain, Italy, Russia, Rest of Europe)
Asia Pacific (China, India, Japan, South Korea, Australia, South East Asia, Rest of Asia)
South America (Brazil, Argentina, Rest of South America)
Middle East and Africa (Saudi Arabia, UAE, Rest of Middle East, South Africa, Egypt, Rest of Africa)
