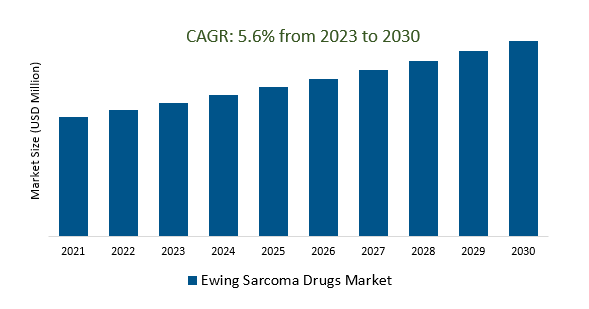
The Global Ewing Sarcoma Drugs Market Size is estimated to register 5.6% growth over the forecast period from 2023 to 2030.
The market growth is driven by an increasing trend of using combination therapies, which involves multiple drugs with different mechanisms of action, is gaining traction. This approach may improve treatment outcomes and reduce the risk of resistance. Leading Companies focusing on Precision Medicine, Targeted Therapies, Immunotherapy Advancements, Clinical Trials and Drug Development, Global Collaboration, Emerging Markets, Innovative Drug Delivery Methods, and others to boost market shares in the industry.
Market Overview
The Ewing Sarcoma Drugs Market is a niche within oncology pharmaceuticals, focusing on the treatment of the rare and aggressive Ewing sarcoma. Historically limited in treatment options, the market has seen progress with clinical trials exploring immunotherapies and targeted therapies. The status of an orphan disease provides regulatory incentives for drug development, and global collaborations, patient advocacy, and pediatric oncology focus contribute to research efforts. The future potential of this market lies in the ongoing pursuit of more effective and less toxic therapies, expanding clinical trial activity, and increasing awareness, offering hope for improved outcomes in the treatment of Ewing sarcoma.
Market Dynamics
Market Trends- Targeted therapies offer a number of benefits for Ewing sarcoma patients, including improved survival rates, reduced side effects, and a better quality of life
The Ewing Sarcoma Drugs Market has witnessed significant advancements with the introduction of targeted therapies, representing a promising shift in the treatment landscape for this rare and aggressive cancer. These therapies are designed to specifically target the genetic mutations and pathways responsible for Ewing sarcoma, offering several key advantages for patients. Notably, they have demonstrated the potential to improve survival rates, which is particularly crucial for a disease known for its aggressiveness.
Market Driver- Patient advocacy and support groups are playing an increasingly important role in the demand for Ewing sarcoma drugs
Patient advocacy and support groups have assumed a pivotal role in shaping the dynamics of the Ewing Sarcoma Drugs Market. Their activities encompass raising awareness about the disease, offering vital emotional and practical support to patients and their families, and actively participating in fundraising efforts to bolster research and drug development. Their influence extends beyond support to policy advocacy, pushing for increased research funding and regulatory incentives for Ewing sarcoma drug development. This growing patient-driven demand for improved treatments has spurred both pharmaceutical companies and researchers to invest more resources and focus on Ewing sarcoma, thereby fostering innovation and expansion in the market.
Market Opportunity- The introduction of orphan drug designations is helping to accelerate the development of new and more effective treatments for Ewing sarcoma
orphan drug designations have emerged as a catalyst for expediting the development of innovative treatments in the Ewing Sarcoma Drugs Market. By granting pharmaceutical companies special incentives, such as extended market exclusivity and reduced regulatory fees, regulatory agencies have facilitated a more streamlined and attractive pathway for drug development for rare diseases like Ewing sarcoma. This, in turn, has encouraged increased investment in research and development efforts, resulting in a growing pipeline of potential therapies.
Market Share Analysis- Bone Tumor the Ewing Sarcoma Drugs Market will register the fastest growth
The Global Ewing Sarcoma Drugs Market is analyzed across Bone Tumor, Extra Osseous Ewing Sarcoma, Askin Tumor, Primitive Neuroectodermal Tumor, and others. Bone Tumor is poised to register the fastest growth. The Ewing Sarcoma Drugs Market is a specialized sector within oncology pharmaceuticals, dedicated to developing treatments for Ewing sarcoma, a rare and aggressive bone tumor prevalent in young individuals. Recent advances in precision medicine, immunotherapy, and targeted therapies are expanding the treatment landscape. The market is marked by clinical trials, patient advocacy, and international collaboration, with orphan drug designations facilitating drug development. Future prospects hinge on ongoing research for innovative treatments that aim to enhance outcomes for Ewing sarcoma patients.
Market Share Analysis- MRI Scan held a significant market share in 2023
The Global Ewing Sarcoma Drugs Market is analyzed across various Diagnostic Tests including CT scans, MRI Scans, Biopsy of Bone Marrow, Blood Tests, and others. Of these, MRI scans held a significant market share in 2023. MRI scans are integral in the Ewing Sarcoma Drugs Market, as they are pivotal in the diagnosis, staging, and treatment monitoring of Ewing sarcoma. These scans provide detailed images that assist in tumor localization, size assessment, and evaluation of nearby structures. In clinical trials, MRI scans play a crucial role in assessing the effectiveness of new drugs and treatments for Ewing sarcoma. Their significance in disease management and research highlights their role in contributing to the development and evaluation of therapies for this rare cancer.
Ewing Sarcoma Drugs Market Segmentation
By Type
- Bone Tumor
- Extra Osseous Ewing Sarcoma
- Askin Tumor
- Primitive Neuroectodermal Tumor
By Diagnostic Test
- CT Scan
- MRI Scan
- Biopsy of the Bone Marrow
- Blood Tests
By Treatment
- Chemotherapy
- Surgery
- Radiotherapy
By End-User
- Hospitals
- Cancer Treating Centers
- Specialty Clinics
- Others
By Region
- North America (United States, Canada, Mexico)
- Europe (Germany, France, United Kingdom, Spain, Italy, Others)
- Asia Pacific (China, India, Japan, South Korea, Australia, Others)
- Latin America (Brazil, Argentina, Others)
- Middle East and Africa (Saudi Arabia, UAE, Kuwait, Other Middle East, South Africa, Nigeria, Other Africa)
Ewing Sarcoma Drugs Market Companies
- Johnson and Johnson Inc
- Novartis AG
- F. Hoffmann-La Roche Ltd
- Abbott Laboratories
- Bristol-Myers Squibb Company
- Pfizer Inc
- Bayer AG
- AstraZeneca
- GlaxoSmithKline plc
- Merck & Co Inc
*List not exhaustive
Ewing Sarcoma Drugs Market Outlook 2023
1 Market Overview
1.1 Introduction to the Ewing Sarcoma Drugs Market
1.2 Scope of the Study
1.3 Research Objective
1.3.1 Key Market Scope and Segments
1.3.2 Players Covered
1.3.3 Years Considered
2 Executive Summary
2.1 2023 Ewing Sarcoma Drugs Industry- Market Statistics
3 Market Dynamics
3.1 Market Drivers
3.2 Market Challenges
3.3 Market Opportunities
3.4 Market Trends
4 Market Factor Analysis
4.1 Porter’s Five Forces
4.2 Market Entropy
4.2.1 Global Ewing Sarcoma Drugs Market Companies with Area Served
4.2.2 Products Offerings Global Ewing Sarcoma Drugs Market
5 COVID-19 Impact Analysis and Outlook Scenarios
5.1.1 Covid-19 Impact Analysis
5.1.2 post-COVID-19 Scenario- Low Growth Case
5.1.3 post-COVID-19 Scenario- Reference Growth Case
5.1.4 post-COVID-19 Scenario- Low Growth Case
6 Global Ewing Sarcoma Drugs Market Trends
6.1 Global Ewing Sarcoma Drugs Revenue (USD Million) and CAGR (%) by Type (2018-2030)
6.2 Global Ewing Sarcoma Drugs Revenue (USD Million) and CAGR (%) by Applications (2018-2030)
6.3 Global Ewing Sarcoma Drugs Revenue (USD Million) and CAGR (%) by regions (2018-2030)
7 Global Ewing Sarcoma Drugs Market Revenue (USD Million) by Type, and Applications (2018-2022)
7.1 Global Ewing Sarcoma Drugs Revenue (USD Million) by Type (2018-2022)
7.1.1 Global Ewing Sarcoma Drugs Revenue (USD Million), Market Share (%) by Type (2018-2022)
7.2 Global Ewing Sarcoma Drugs Revenue (USD Million) by Applications (2018-2022)
7.2.1 Global Ewing Sarcoma Drugs Revenue (USD Million), Market Share (%) by Applications (2018-2022)
8 Global Ewing Sarcoma Drugs Development Regional Status and Outlook
8.1 Global Ewing Sarcoma Drugs Revenue (USD Million) By Regions (2018-2022)
8.2 North America Ewing Sarcoma Drugs Revenue (USD Million) by Type, and Application (2018-2022)
8.2.1 North America Ewing Sarcoma Drugs Revenue (USD Million) by Country (2018-2022)
8.2.2 North America Ewing Sarcoma Drugs Revenue (USD Million) by Type (2018-2022)
8.2.3 North America Ewing Sarcoma Drugs Revenue (USD Million) by Applications (2018-2022)
8.3 Europe Ewing Sarcoma Drugs Revenue (USD Million), by Type, and Applications (USD Million) (2018-2022)
8.3.1 Europe Ewing Sarcoma Drugs Revenue (USD Million), by Country (2018-2022)
8.3.2 Europe Ewing Sarcoma Drugs Revenue (USD Million) by Type (2018-2022)
8.3.3 Europe Ewing Sarcoma Drugs Revenue (USD Million) by Applications (2018-2022)
8.4 Asia Pacific Ewing Sarcoma Drugs Revenue (USD Million), and Revenue (USD Million) by Type, and Applications (2018-2022)
8.4.1 Asia Pacific Ewing Sarcoma Drugs Revenue (USD Million) by Country (2018-2022)
8.4.2 Asia Pacific Ewing Sarcoma Drugs Revenue (USD Million) by Type (2018-2022)
8.4.3 Asia Pacific Ewing Sarcoma Drugs Revenue (USD Million) by Applications (2018-2022)
8.5 South America Ewing Sarcoma Drugs Revenue (USD Million), by Type, and Applications (2018-2022)
8.5.1 South America Ewing Sarcoma Drugs Revenue (USD Million), by Country (2018-2022)
8.5.2 South America Ewing Sarcoma Drugs Revenue (USD Million) by Type (2018-2022)
8.5.3 South America Ewing Sarcoma Drugs Revenue (USD Million) by Applications (2018-2022)
8.6 Middle East and Africa Ewing Sarcoma Drugs Revenue (USD Million), by Type, Technology, Application, Thickness (2018-2022)
8.6.1 Middle East and Africa Ewing Sarcoma Drugs Revenue (USD Million) by Country (2018-2022)
8.6.2 Middle East and Africa Ewing Sarcoma Drugs Revenue (USD Million) by Type (2018-2022)
8.6.3 Middle East and Africa Ewing Sarcoma Drugs Revenue (USD Million) by Applications (2018-2022)
9 Company Profiles
10 Global Ewing Sarcoma Drugs Market Revenue (USD Million), by Type, and Applications (2023-2030)
10.1 Global Ewing Sarcoma Drugs Revenue (USD Million) and Market Share (%) by Type (2023-2030)
10.1.1 Global Ewing Sarcoma Drugs Revenue (USD Million), and Market Share (%) by Type (2023-2030)
10.2 Global Ewing Sarcoma Drugs Revenue (USD Million) and Market Share (%) by Applications (2023-2030)
10.2.1 Global Ewing Sarcoma Drugs Revenue (USD Million), and Market Share (%) by Applications (2023-2030)
11 Global Ewing Sarcoma Drugs Development Regional Status and Outlook Forecast
11.1 Global Ewing Sarcoma Drugs Revenue (USD Million) By Regions (2023-2030)
11.2 North America Ewing Sarcoma Drugs Revenue (USD Million) by Type, and Applications (2023-2030)
11.2.1 North America Ewing Sarcoma Drugs Revenue (USD) Million by Country (2023-2030)
11.2.2 North America Ewing Sarcoma Drugs Revenue (USD Million), by Type (2023-2030)
11.2.3 North America Ewing Sarcoma Drugs Revenue (USD Million), Market Share (%) by Applications (2023-2030)
11.3 Europe Ewing Sarcoma Drugs Revenue (USD Million), by Type, and Applications (2023-2030)
11.3.1 Europe Ewing Sarcoma Drugs Revenue (USD Million), by Country (2023-2030)
11.3.2 Europe Ewing Sarcoma Drugs Revenue (USD Million), by Type (2023-2030)
11.3.3 Europe Ewing Sarcoma Drugs Revenue (USD Million), by Applications (2023-2030)
11.4 Asia Pacific Ewing Sarcoma Drugs Revenue (USD Million) by Type, and Applications (2023-2030)
11.4.1 Asia Pacific Ewing Sarcoma Drugs Revenue (USD Million), by Country (2023-2030)
11.4.2 Asia Pacific Ewing Sarcoma Drugs Revenue (USD Million), by Type (2023-2030)
11.4.3 Asia Pacific Ewing Sarcoma Drugs Revenue (USD Million), by Applications (2023-2030)
11.5 South America Ewing Sarcoma Drugs Revenue (USD Million), by Type, and Applications (2023-2030)
11.5.1 South America Ewing Sarcoma Drugs Revenue (USD Million), by Country (2023-2030)
11.5.2 South America Ewing Sarcoma Drugs Revenue (USD Million), by Type (2023-2030)
11.5.3 South America Ewing Sarcoma Drugs Revenue (USD Million), by Applications (2023-2030)
11.6 Middle East and Africa Ewing Sarcoma Drugs Revenue (USD Million), by Type, and Applications (2023-2030)
11.6.1 Middle East and Africa Ewing Sarcoma Drugs Revenue (USD Million), by region (2023-2030)
11.6.2 Middle East and Africa Ewing Sarcoma Drugs Revenue (USD Million), by Type (2023-2030)
11.6.3 Middle East and Africa Ewing Sarcoma Drugs Revenue (USD Million), by Applications (2023-2030)
12 Methodology and Data Sources
12.1 Methodology/Research Approach
12.1.1 Research Programs/Design
12.1.2 Market Size Estimation
12.1.3 Market Breakdown and Data Triangulation
12.2 Data Sources
12.2.1 Secondary Sources
12.2.2 Primary Sources
12.3 Disclaimer
List of Tables
Table 1 Market Segmentation Analysis
Table 2 Global Ewing Sarcoma Drugs Market Companies with Areas Served
Table 3 Products Offerings Global Ewing Sarcoma Drugs Market
Table 4 Low Growth Scenario Forecasts
Table 5 Reference Case Growth Scenario
Table 6 High Growth Case Scenario
Table 7 Global Ewing Sarcoma Drugs Revenue (USD Million) And CAGR (%) By Type (2018-2030)
Table 8 Global Ewing Sarcoma Drugs Revenue (USD Million) And CAGR (%) By Applications (2018-2030)
Table 9 Global Ewing Sarcoma Drugs Revenue (USD Million) And CAGR (%) By Regions (2018-2030)
Table 10 Global Ewing Sarcoma Drugs Revenue (USD Million) By Type (2018-2022)
Table 11 Global Ewing Sarcoma Drugs Revenue Market Share (%) By Type (2018-2022)
Table 12 Global Ewing Sarcoma Drugs Revenue (USD Million) By Applications (2018-2022)
Table 13 Global Ewing Sarcoma Drugs Revenue Market Share (%) By Applications (2018-2022)
Table 14 Global Ewing Sarcoma Drugs Market Revenue (USD Million) By Regions (2018-2022)
Table 15 Global Ewing Sarcoma Drugs Market Share (%) By Regions (2018-2022)
Table 16 North America Ewing Sarcoma Drugs Revenue (USD Million) By Country (2018-2022)
Table 17 North America Ewing Sarcoma Drugs Revenue (USD Million) By Type (2018-2022)
Table 18 North America Ewing Sarcoma Drugs Revenue (USD Million) By Applications (2018-2022)
Table 19 Europe Ewing Sarcoma Drugs Revenue (USD Million) By Country (2018-2022)
Table 20 Europe Ewing Sarcoma Drugs Revenue (USD Million) By Type (2018-2022)
Table 21 Europe Ewing Sarcoma Drugs Revenue (USD Million) By Applications (2018-2022)
Table 22 Asia Pacific Ewing Sarcoma Drugs Revenue (USD Million) By Country (2018-2022)
Table 23 Asia Pacific Ewing Sarcoma Drugs Revenue (USD Million) By Type (2018-2022)
Table 24 Asia Pacific Ewing Sarcoma Drugs Revenue (USD Million) By Applications (2018-2022)
Table 25 South America Ewing Sarcoma Drugs Revenue (USD Million) By Country (2018-2022)
Table 26 South America Ewing Sarcoma Drugs Revenue (USD Million) By Type (2018-2022)
Table 27 South America Ewing Sarcoma Drugs Revenue (USD Million) By Applications (2018-2022)
Table 28 Middle East and Africa Ewing Sarcoma Drugs Revenue (USD Million) By Region (2018-2022)
Table 29 Middle East and Africa Ewing Sarcoma Drugs Revenue (USD Million) By Type (2018-2022)
Table 30 Middle East and Africa Ewing Sarcoma Drugs Revenue (USD Million) By Applications (2018-2022)
Table 31 Financial Analysis
Table 32 Global Ewing Sarcoma Drugs Revenue (USD Million) By Type (2023-2030)
Table 33 Global Ewing Sarcoma Drugs Revenue Market Share (%) By Type (2023-2030)
Table 34 Global Ewing Sarcoma Drugs Revenue (USD Million) By Applications (2023-2030)
Table 35 Global Ewing Sarcoma Drugs Revenue Market Share (%) By Applications (2023-2030)
Table 36 Global Ewing Sarcoma Drugs Market Revenue (USD Million), And Revenue (USD Million) By Regions (2023-2030)
Table 37 North America Ewing Sarcoma Drugs Revenue (USD)By Country (2023-2030)
Table 38 North America Ewing Sarcoma Drugs Revenue (USD Million) By Type (2023-2030)
Table 39 North America Ewing Sarcoma Drugs Revenue (USD Million) By Applications (2023-2030)
Table 40 Europe Ewing Sarcoma Drugs Revenue (USD Million) By Country (2023-2030)
Table 41 Europe Ewing Sarcoma Drugs Revenue (USD Million) By Type (2023-2030)
Table 42 Europe Ewing Sarcoma Drugs Revenue (USD Million) By Applications (2023-2030)
Table 43 Asia Pacific Ewing Sarcoma Drugs Revenue (USD Million) By Country (2023-2030)
Table 44 Asia Pacific Ewing Sarcoma Drugs Revenue (USD Million) By Type (2023-2030)
Table 45 Asia Pacific Ewing Sarcoma Drugs Revenue (USD Million) By Applications (2023-2030)
Table 46 South America Ewing Sarcoma Drugs Revenue (USD Million) By Country (2023-2030)
Table 47 South America Ewing Sarcoma Drugs Revenue (USD Million) By Type (2023-2030)
Table 48 South America Ewing Sarcoma Drugs Revenue (USD Million) By Applications (2023-2030)
Table 49 Middle East and Africa Ewing Sarcoma Drugs Revenue (USD Million) By Region (2023-2030)
Table 50 Middle East and Africa Ewing Sarcoma Drugs Revenue (USD Million) By Region (2023-2030)
Table 51 Middle East and Africa Ewing Sarcoma Drugs Revenue (USD Million) By Type (2023-2030)
Table 52 Middle East and Africa Ewing Sarcoma Drugs Revenue (USD Million) By Applications (2023-2030)
Table 53 Research Programs/Design for This Report
Table 54 Key Data Information from Secondary Sources
Table 55 Key Data Information from Primary Sources
List of Figures
Figure 1 Market Scope
Figure 2 Porter’s Five Forces
Figure 3 Global Ewing Sarcoma Drugs Revenue (USD Million) By Type (2018-2022)
Figure 4 Global Ewing Sarcoma Drugs Revenue Market Share (%) By Type (2022)
Figure 5 Global Ewing Sarcoma Drugs Revenue (USD Million) By Applications (2018-2022)
Figure 6 Global Ewing Sarcoma Drugs Revenue Market Share (%) By Applications (2022)
Figure 7 Global Ewing Sarcoma Drugs Market Revenue (USD Million) By Regions (2018-2022)
Figure 8 Global Ewing Sarcoma Drugs Market Share (%) By Regions (2022)
Figure 9 North America Ewing Sarcoma Drugs Revenue (USD Million) By Country (2018-2022)
Figure 10 North America Ewing Sarcoma Drugs Revenue (USD Million) By Type (2018-2022)
Figure 11 North America Ewing Sarcoma Drugs Revenue (USD Million) By Applications (2018-2022)
Figure 12 Europe Ewing Sarcoma Drugs Revenue (USD Million) By Country (2018-2022)
Figure 13 Europe Ewing Sarcoma Drugs Revenue (USD Million) By Type (2018-2022)
Figure 14 Europe Ewing Sarcoma Drugs Revenue (USD Million) By Applications (2018-2022)
Figure 15 Asia Pacific Ewing Sarcoma Drugs Revenue (USD Million) By Country (2018-2022)
Figure 16 Asia Pacific Ewing Sarcoma Drugs Revenue (USD Million) By Type (2018-2022)
Figure 17 Asia Pacific Ewing Sarcoma Drugs Revenue (USD Million) By Applications (2018-2022)
Figure 18 South America Ewing Sarcoma Drugs Revenue (USD Million) By Country (2018-2022)
Figure 19 South America Ewing Sarcoma Drugs Revenue (USD Million) By Type (2018-2022)
Figure 20 South America Ewing Sarcoma Drugs Revenue (USD Million) By Applications (2018-2022)
Figure 21 Middle East and Africa Ewing Sarcoma Drugs Revenue (USD Million) By Region (2018-2022)
Figure 22 Middle East and Africa Ewing Sarcoma Drugs Revenue (USD Million) By Type (2018-2022)
Figure 23 Middle East and Africa Ewing Sarcoma Drugs Revenue (USD Million) By Applications (2018-2022)
Figure 24 Global Ewing Sarcoma Drugs Revenue (USD Million) By Type (2023-2030)
Figure 25 Global Ewing Sarcoma Drugs Revenue Market Share (%) By Type (2030)
Figure 26 Global Ewing Sarcoma Drugs Revenue (USD Million) By Applications (2023-2030)
Figure 27 Global Ewing Sarcoma Drugs Revenue Market Share (%) By Applications (2030)
Figure 28 Global Ewing Sarcoma Drugs Market Revenue (USD Million) By Regions (2023-2030)
Figure 29 North America Ewing Sarcoma Drugs Revenue (USD Million) By Country (2023-2030)
Figure 30 North America Ewing Sarcoma Drugs Revenue (USD Million) By Type (2023-2030)
Figure 31 North America Ewing Sarcoma Drugs Revenue (USD Million) By Applications (2023-2030)
Figure 32 Europe Ewing Sarcoma Drugs Revenue (USD Million) By Country (2023-2030)
Figure 33 Europe Ewing Sarcoma Drugs Revenue (USD Million) By Type (2023-2030)
Figure 34 Europe Ewing Sarcoma Drugs Revenue (USD Million) By Applications (2023-2030)
Figure 35 Asia Pacific Ewing Sarcoma Drugs Revenue (USD Million) By Country (2023-2030)
Figure 36 Asia Pacific Ewing Sarcoma Drugs Revenue (USD Million) By Type (2023-2030)
Figure 37 Asia Pacific Ewing Sarcoma Drugs Revenue (USD Million) By Applications (2023-2030)
Figure 38 South America Ewing Sarcoma Drugs Revenue (USD Million) By Country (2023-2030)
Figure 39 South America Ewing Sarcoma Drugs Revenue (USD Million) By Type (2023-2030)
Figure 40 South America Ewing Sarcoma Drugs Revenue (USD Million) By Applications (2023-2030)
Figure 41 Middle East and Africa Ewing Sarcoma Drugs Revenue (USD Million) By Region (2023-2030)
Figure 42 Middle East and Africa Ewing Sarcoma Drugs Revenue (USD Million) By Region (2023-2030)
Figure 43 Middle East and Africa Ewing Sarcoma Drugs Revenue (USD Million) By Type (2023-2030)
Figure 44 Middle East and Africa Ewing Sarcoma Drugs Revenue (USD Million) By Applications (2023-2030)
Figure 45 Bottom-Up and Top-Down Approaches for This Report
Figure 46 Data Triangulation
