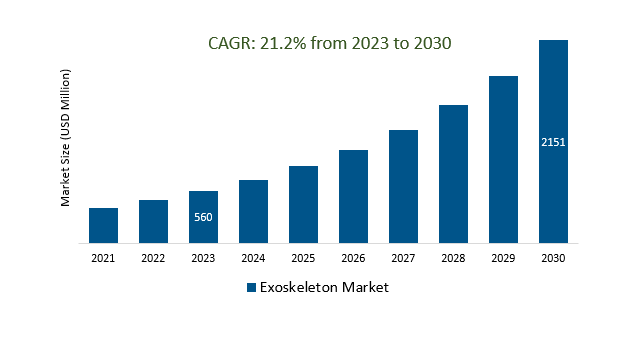
The Global Exoskeleton Market Size is estimated to be US 560 Million in 2023 and is poised to register 21.2% growth over the forecast period from 2023 to 2030 to reach US $ 2151 Million in 2030.
The market growth is driven by the increasing demand for exoskeletons in rehabilitation and healthcare settings due to the increasing prevalence of disabilities and the desire to improve the quality of life for individuals with mobility impairments. Leading companies that are focused on expanding Applications, Aging Population, Rehabilitation and Healthcare, Workplace Ergonomics, R&D and Innovation, and others to boost market shares in the industry.
Market Overview
The global exoskeleton market has been steadily growing, driven by applications in healthcare, industry, and defense. Key players in the market include Ekso Bionics, Lockheed Martin, and Hyundai, while ongoing technological advancements, increased adoption in healthcare for rehabilitation, and the need for workplace safety and productivity improvements are prominent trends. Exoskeletons have diverse applications, ranging from assisting patients with mobility impairments to enhancing military personnel's strength and mobility. As the market evolves, customization, miniaturization, and consumer adoption are emerging as key drivers, with regulatory support facilitating growth.
Market Dynamics
Market Trends - Helping Workers Lift Heavy Objects and Reduce Fatigue
Exoskeletons play a vital role in helping workers lift heavy objects and reduce fatigue in various industries. These wearable devices are designed to augment human strength and endurance, making physically demanding tasks more manageable and less strenuous for individuals. In industrial settings, exoskeletons are increasingly being adopted to enhance workplace safety and productivity by reducing the risk of musculoskeletal injuries associated with heavy lifting and repetitive movements. These devices provide support to the wearer's muscles and joints, particularly in the back and legs, thereby reducing the physical strain during tasks that involve lifting, carrying, or repetitive motions.
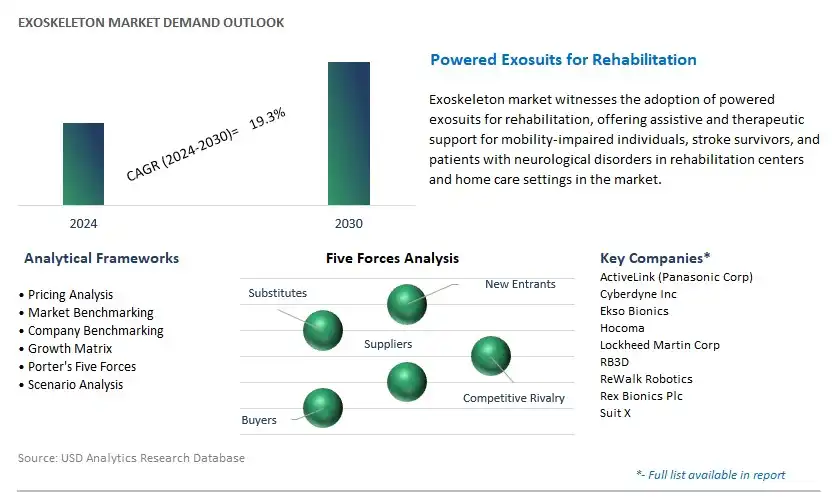
Market Driver- Rehabilitation and Healthcare Demand Exoskeleton Market
The exoskeleton market experiences significant demand from the rehabilitation and healthcare sectors. Exoskeleton technology is increasingly used in healthcare settings to aid patients with mobility impairments, including those with spinal cord injuries, strokes, or other conditions. These devices assist in physical therapy and rehabilitation, helping patients regain mobility and improve their quality of life. The aging population further drives the demand for exoskeletons in-home care and long-term care facilities. This growing adoption of exoskeletons in healthcare showcases their potential to positively impact patient recovery and independence, making them a crucial asset in the healthcare and rehabilitation industry.
Market Opportunity-Introduction of Military Investments
Military investments are a crucial driver in the exoskeleton market, with various military organizations worldwide investing in this technology to enhance soldiers' capabilities in combat and logistics operations. Exoskeletons provide soldiers with increased strength, endurance, and mobility, reducing fatigue and allowing for the easier carrying of heavy loads and improved performance in challenging terrains. These investments stimulate innovation and development in the exoskeleton field, benefiting not only the military but also other sectors, and thus remain a significant driver of market growth.
Market Share Analysis- Mobile Exoskeleton Market will register the fastest growth
The Global Exoskeleton Market is analyzed across Mobile, Stationary, and others. Mobile is poised to register the fastest growth. Mobile applications are increasingly integrated into the exoskeleton market, enhancing user control, monitoring, and customization. Mobile apps enable users to adjust settings and track performance metrics, improving usability. Mobile connectivity also facilitates remote monitoring and support, particularly valuable in healthcare and remote work scenarios. The integration of mobile technology is expected to expand applications and enhance the overall user experience in the exoskeleton market.
Market Share Analysis- Powered held a significant market share in 2023
The Global Exoskeleton Market is analyzed across various Technologies including Powered, Non-powered, and others. Of these, powered held a significant market share in 2023. In the exoskeleton market, "powered" refers to exoskeletons equipped with electric motors or other power sources that actively assist the wearer's movements. These devices augment strength, reduce fatigue, and enhance mobility, finding applications in healthcare, industry, and defense. Powered exoskeletons incorporate sensors and control systems to detect user movements and provide tailored assistance, representing a significant segment within the exoskeleton market.
Exoskeleton Market Segmentation
By Mobility
By Technology
By Extremity
- Upper Body
- Lower Body
- Full Body
By Technology
- Powered Extremities
- Non-Powered Extremities
By End-user
- Healthcare
- Military
- Industry
By Region
- North America (United States, Canada, Mexico)
- Europe (Germany, France, United Kingdom, Spain, Italy, Others)
- Asia Pacific (China, India, Japan, South Korea, Australia, Others)
- Latin America (Brazil, Argentina, Others)
- Middle East and Africa (Saudi Arabia, UAE, Kuwait, Other Middle East, South Africa, Nigeria, Other Africa)
Exoskeleton Market Companies
- Lockheed Martin Corporation
- Rex Bionics PLC
- Ekso Bionics
- Re Walk Robotics Ltd
- Hocoma
- Cyber dyne Inc
- RRB3D
- suitX
- Ottobock
- DIH Medical
- Sacros Technology and Robotics Corporation
*List not exhaustive
Exoskeleton Market Outlook 2023
1 Market Overview
1.1 Introduction to the Exoskeleton Market
1.2 Scope of the Study
1.3 Research Objective
1.3.1 Key Market Scope and Segments
1.3.2 Players Covered
1.3.3 Years Considered
2 Executive Summary
2.1 2023 Exoskeleton Industry- Market Statistics
3 Market Dynamics
3.1 Market Drivers
3.2 Market Challenges
3.3 Market Opportunities
3.4 Market Trends
4 Market Factor Analysis
4.1 Porter’s Five Forces
4.2 Market Entropy
4.2.1 Global Exoskeleton Market Companies with Area Served
4.2.2 Products Offerings Global Exoskeleton Market
5 COVID-19 Impact Analysis and Outlook Scenarios
5.1.1 Covid-19 Impact Analysis
5.1.2 Post-COVID-19 Scenario- Low Growth Case
5.1.3 Post-COVID-19 Scenario- Reference Growth Case
5.1.4 Post-COVID-19 Scenario- Low Growth Case
6 Global Exoskeleton Market Trends
6.1 Global Exoskeleton Revenue (USD Million) and CAGR (%) by Type (2018-2030)
6.2 Global Exoskeleton Revenue (USD Million) and CAGR (%) by Applications (2018-2030)
6.3 Global Exoskeleton Revenue (USD Million) and CAGR (%) by Regions (2018-2030)
7 Global Exoskeleton Market Revenue (USD Million) by Type, and Applications (2018-2022)
7.1 Global Exoskeleton Revenue (USD Million) by Type (2018-2022)
7.1.1 Global Exoskeleton Revenue (USD Million), Market Share (%) by Type (2018-2022)
7.2 Global Exoskeleton Revenue (USD Million) by Applications (2018-2022)
7.2.1 Global Exoskeleton Revenue (USD Million), Market Share (%) by Applications (2018-2022)
8 Global Exoskeleton Development Regional Status and Outlook
8.1 Global Exoskeleton Revenue (USD Million) By Regions (2018-2022)
8.2 North America Exoskeleton Revenue (USD Million) by Type, and Application (2018-2022)
8.2.1 North America Exoskeleton Revenue (USD Million) by Country (2018-2022)
8.2.2 North America Exoskeleton Revenue (USD Million) by Type (2018-2022)
8.2.3 North America Exoskeleton Revenue (USD Million) by Applications (2018-2022)
8.3 Europe Exoskeleton Revenue (USD Million), by Type, and Applications (USD Million) (2018-2022)
8.3.1 Europe Exoskeleton Revenue (USD Million), by Country (2018-2022)
8.3.2 Europe Exoskeleton Revenue (USD Million) by Type (2018-2022)
8.3.3 Europe Exoskeleton Revenue (USD Million) by Applications (2018-2022)
8.4 Asia Pacific Exoskeleton Revenue (USD Million), and Revenue (USD Million) by Type, and Applications (2018-2022)
8.4.1 Asia Pacific Exoskeleton Revenue (USD Million) by Country (2018-2022)
8.4.2 Asia Pacific Exoskeleton Revenue (USD Million) by Type (2018-2022)
8.4.3 Asia Pacific Exoskeleton Revenue (USD Million) by Applications (2018-2022)
8.5 South America Exoskeleton Revenue (USD Million), by Type, and Applications (2018-2022)
8.5.1 South America Exoskeleton Revenue (USD Million), by Country (2018-2022)
8.5.2 South America Exoskeleton Revenue (USD Million) by Type (2018-2022)
8.5.3 South America Exoskeleton Revenue (USD Million) by Applications (2018-2022)
8.6 Middle East and Africa Exoskeleton Revenue (USD Million), by Type, Technology, Application, Thickness (2018-2022)
8.6.1 Middle East and Africa Exoskeleton Revenue (USD Million) by Country (2018-2022)
8.6.2 Middle East and Africa Exoskeleton Revenue (USD Million) by Type (2018-2022)
8.6.3 Middle East and Africa Exoskeleton Revenue (USD Million) by Applications (2018-2022)
9 Company Profiles
10 Global Exoskeleton Market Revenue (USD Million), by Type, and Applications (2023-2030)
10.1 Global Exoskeleton Revenue (USD Million) and Market Share (%) by Type (2023-2030)
10.1.1 Global Exoskeleton Revenue (USD Million), and Market Share (%) by Type (2023-2030)
10.2 Global Exoskeleton Revenue (USD Million) and Market Share (%) by Applications (2023-2030)
10.2.1 Global Exoskeleton Revenue (USD Million), and Market Share (%) by Applications (2023-2030)
11 Global Exoskeleton Development Regional Status and Outlook Forecast
11.1 Global Exoskeleton Revenue (USD Million) By Regions (2023-2030)
11.2 North America Exoskeleton Revenue (USD Million) by Type, and Applications (2023-2030)
11.2.1 North America Exoskeleton Revenue (USD) Million by Country (2023-2030)
11.2.2 North America Exoskeleton Revenue (USD Million), by Type (2023-2030)
11.2.3 North America Exoskeleton Revenue (USD Million), Market Share (%) by Applications (2023-2030)
11.3 Europe Exoskeleton Revenue (USD Million), by Type, and Applications (2023-2030)
11.3.1 Europe Exoskeleton Revenue (USD Million), by Country (2023-2030)
11.3.2 Europe Exoskeleton Revenue (USD Million), by Type (2023-2030)
11.3.3 Europe Exoskeleton Revenue (USD Million), by Applications (2023-2030)
11.4 Asia Pacific Exoskeleton Revenue (USD Million) by Type, and Applications (2023-2030)
11.4.1 Asia Pacific Exoskeleton Revenue (USD Million), by Country (2023-2030)
11.4.2 Asia Pacific Exoskeleton Revenue (USD Million), by Type (2023-2030)
11.4.3 Asia Pacific Exoskeleton Revenue (USD Million), by Applications (2023-2030)
11.5 South America Exoskeleton Revenue (USD Million), by Type, and Applications (2023-2030)
11.5.1 South America Exoskeleton Revenue (USD Million), by Country (2023-2030)
11.5.2 South America Exoskeleton Revenue (USD Million), by Type (2023-2030)
11.5.3 South America Exoskeleton Revenue (USD Million), by Applications (2023-2030)
11.6 Middle East and Africa Exoskeleton Revenue (USD Million), by Type, and Applications (2023-2030)
11.6.1 Middle East and Africa Exoskeleton Revenue (USD Million), by Region (2023-2030)
11.6.2 Middle East and Africa Exoskeleton Revenue (USD Million), by Type (2023-2030)
11.6.3 Middle East and Africa Exoskeleton Revenue (USD Million), by Applications (2023-2030)
12 Methodology and Data Sources
12.1 Methodology/Research Approach
12.1.1 Research Programs/Design
12.1.2 Market Size Estimation
12.1.3 Market Breakdown and Data Triangulation
12.2 Data Sources
12.2.1 Secondary Sources
12.2.2 Primary Sources
12.3 Disclaimer
List of Tables
Table 1 Market Segmentation Analysis
Table 2 Global Exoskeleton Market Companies with Areas Served
Table 3 Products Offerings Global Exoskeleton Market
Table 4 Low Growth Scenario Forecasts
Table 5 Reference Case Growth Scenario
Table 6 High Growth Case Scenario
Table 7 Global Exoskeleton Revenue (USD Million) And CAGR (%) By Type (2018-2030)
Table 8 Global Exoskeleton Revenue (USD Million) And CAGR (%) By Applications (2018-2030)
Table 9 Global Exoskeleton Revenue (USD Million) And CAGR (%) By Regions (2018-2030)
Table 10 Global Exoskeleton Revenue (USD Million) By Type (2018-2022)
Table 11 Global Exoskeleton Revenue Market Share (%) By Type (2018-2022)
Table 12 Global Exoskeleton Revenue (USD Million) By Applications (2018-2022)
Table 13 Global Exoskeleton Revenue Market Share (%) By Applications (2018-2022)
Table 14 Global Exoskeleton Market Revenue (USD Million) By Regions (2018-2022)
Table 15 Global Exoskeleton Market Share (%) By Regions (2018-2022)
Table 16 North America Exoskeleton Revenue (USD Million) By Country (2018-2022)
Table 17 North America Exoskeleton Revenue (USD Million) By Type (2018-2022)
Table 18 North America Exoskeleton Revenue (USD Million) By Applications (2018-2022)
Table 19 Europe Exoskeleton Revenue (USD Million) By Country (2018-2022)
Table 20 Europe Exoskeleton Revenue (USD Million) By Type (2018-2022)
Table 21 Europe Exoskeleton Revenue (USD Million) By Applications (2018-2022)
Table 22 Asia Pacific Exoskeleton Revenue (USD Million) By Country (2018-2022)
Table 23 Asia Pacific Exoskeleton Revenue (USD Million) By Type (2018-2022)
Table 24 Asia Pacific Exoskeleton Revenue (USD Million) By Applications (2018-2022)
Table 25 South America Exoskeleton Revenue (USD Million) By Country (2018-2022)
Table 26 South America Exoskeleton Revenue (USD Million) By Type (2018-2022)
Table 27 South America Exoskeleton Revenue (USD Million) By Applications (2018-2022)
Table 28 Middle East and Africa Exoskeleton Revenue (USD Million) By Region (2018-2022)
Table 29 Middle East and Africa Exoskeleton Revenue (USD Million) By Type (2018-2022)
Table 30 Middle East and Africa Exoskeleton Revenue (USD Million) By Applications (2018-2022)
Table 31 Financial Analysis
Table 32 Global Exoskeleton Revenue (USD Million) By Type (2023-2030)
Table 33 Global Exoskeleton Revenue Market Share (%) By Type (2023-2030)
Table 34 Global Exoskeleton Revenue (USD Million) By Applications (2023-2030)
Table 35 Global Exoskeleton Revenue Market Share (%) By Applications (2023-2030)
Table 36 Global Exoskeleton Market Revenue (USD Million), And Revenue (USD Million) By Regions (2023-2030)
Table 37 North America Exoskeleton Revenue (USD)By Country (2023-2030)
Table 38 North America Exoskeleton Revenue (USD Million) By Type (2023-2030)
Table 39 North America Exoskeleton Revenue (USD Million) By Applications (2023-2030)
Table 40 Europe Exoskeleton Revenue (USD Million) By Country (2023-2030)
Table 41 Europe Exoskeleton Revenue (USD Million) By Type (2023-2030)
Table 42 Europe Exoskeleton Revenue (USD Million) By Applications (2023-2030)
Table 43 Asia Pacific Exoskeleton Revenue (USD Million) By Country (2023-2030)
Table 44 Asia Pacific Exoskeleton Revenue (USD Million) By Type (2023-2030)
Table 45 Asia Pacific Exoskeleton Revenue (USD Million) By Applications (2023-2030)
Table 46 South America Exoskeleton Revenue (USD Million) By Country (2023-2030)
Table 47 South America Exoskeleton Revenue (USD Million) By Type (2023-2030)
Table 48 South America Exoskeleton Revenue (USD Million) By Applications (2023-2030)
Table 49 Middle East and Africa Exoskeleton Revenue (USD Million) By Region (2023-2030)
Table 50 Middle East and Africa Exoskeleton Revenue (USD Million) By Region (2023-2030)
Table 51 Middle East and Africa Exoskeleton Revenue (USD Million) By Type (2023-2030)
Table 52 Middle East and Africa Exoskeleton Revenue (USD Million) By Applications (2023-2030)
Table 53 Research Programs/Design for This Report
Table 54 Key Data Information from Secondary Sources
Table 55 Key Data Information from Primary Sources
List of Figures
Figure 1 Market Scope
Figure 2 Porter’s Five Forces
Figure 3 Global Exoskeleton Revenue (USD Million) By Type (2018-2022)
Figure 4 Global Exoskeleton Revenue Market Share (%) By Type (2022)
Figure 5 Global Exoskeleton Revenue (USD Million) By Applications (2018-2022)
Figure 6 Global Exoskeleton Revenue Market Share (%) By Applications (2022)
Figure 7 Global Exoskeleton Market Revenue (USD Million) By Regions (2018-2022)
Figure 8 Global Exoskeleton Market Share (%) By Regions (2022)
Figure 9 North America Exoskeleton Revenue (USD Million) By Country (2018-2022)
Figure 10 North America Exoskeleton Revenue (USD Million) By Type (2018-2022)
Figure 11 North America Exoskeleton Revenue (USD Million) By Applications (2018-2022)
Figure 12 Europe Exoskeleton Revenue (USD Million) By Country (2018-2022)
Figure 13 Europe Exoskeleton Revenue (USD Million) By Type (2018-2022)
Figure 14 Europe Exoskeleton Revenue (USD Million) By Applications (2018-2022)
Figure 15 Asia Pacific Exoskeleton Revenue (USD Million) By Country (2018-2022)
Figure 16 Asia Pacific Exoskeleton Revenue (USD Million) By Type (2018-2022)
Figure 17 Asia Pacific Exoskeleton Revenue (USD Million) By Applications (2018-2022)
Figure 18 South America Exoskeleton Revenue (USD Million) By Country (2018-2022)
Figure 19 South America Exoskeleton Revenue (USD Million) By Type (2018-2022)
Figure 20 South America Exoskeleton Revenue (USD Million) By Applications (2018-2022)
Figure 21 Middle East and Africa Exoskeleton Revenue (USD Million) By Region (2018-2022)
Figure 22 Middle East and Africa Exoskeleton Revenue (USD Million) By Type (2018-2022)
Figure 23 Middle East and Africa Exoskeleton Revenue (USD Million) By Applications (2018-2022)
Figure 24 Global Exoskeleton Revenue (USD Million) By Type (2023-2030)
Figure 25 Global Exoskeleton Revenue Market Share (%) By Type (2030)
Figure 26 Global Exoskeleton Revenue (USD Million) By Applications (2023-2030)
Figure 27 Global Exoskeleton Revenue Market Share (%) By Applications (2030)
Figure 28 Global Exoskeleton Market Revenue (USD Million) By Regions (2023-2030)
Figure 29 North America Exoskeleton Revenue (USD Million) By Country (2023-2030)
Figure 30 North America Exoskeleton Revenue (USD Million) By Type (2023-2030)
Figure 31 North America Exoskeleton Revenue (USD Million) By Applications (2023-2030)
Figure 32 Europe Exoskeleton Revenue (USD Million) By Country (2023-2030)
Figure 33 Europe Exoskeleton Revenue (USD Million) By Type (2023-2030)
Figure 34 Europe Exoskeleton Revenue (USD Million) By Applications (2023-2030)
Figure 35 Asia Pacific Exoskeleton Revenue (USD Million) By Country (2023-2030)
Figure 36 Asia Pacific Exoskeleton Revenue (USD Million) By Type (2023-2030)
Figure 37 Asia Pacific Exoskeleton Revenue (USD Million) By Applications (2023-2030)
Figure 38 South America Exoskeleton Revenue (USD Million) By Country (2023-2030)
Figure 39 South America Exoskeleton Revenue (USD Million) By Type (2023-2030)
Figure 40 South America Exoskeleton Revenue (USD Million) By Applications (2023-2030)
Figure 41 Middle East and Africa Exoskeleton Revenue (USD Million) By Region (2023-2030)
Figure 42 Middle East and Africa Exoskeleton Revenue (USD Million) By Region (2023-2030)
Figure 43 Middle East and Africa Exoskeleton Revenue (USD Million) By Type (2023-2030)
Figure 44 Middle East and Africa Exoskeleton Revenue (USD Million) By Applications (2023-2030)
Figure 45 Bottom-Up and Top-Down Approaches For This Report
Figure 46 Data Triangulation
