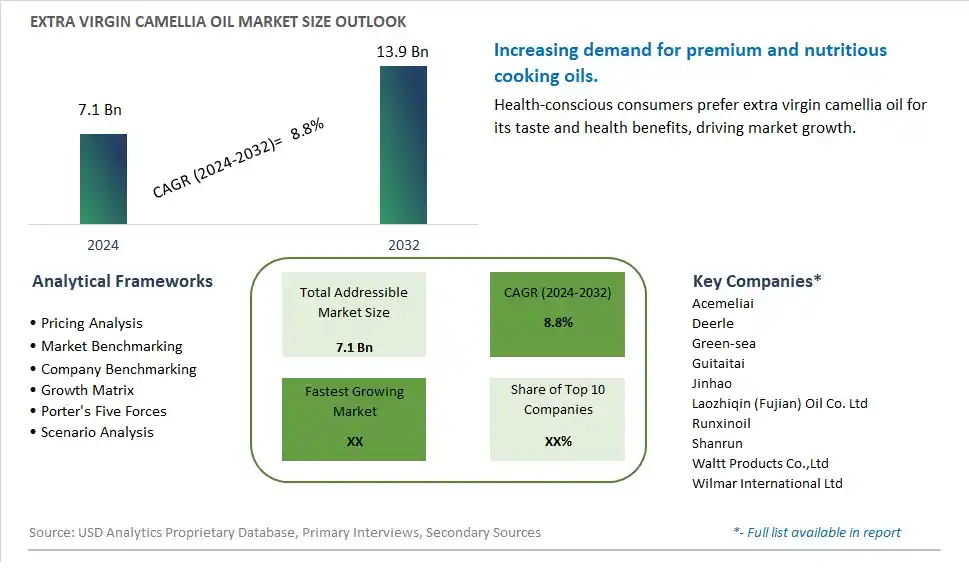
Global Extra Virgin Camellia Oil Market Size is valued at $7.1 Billion in 2024 and is forecast to register a growth rate (CAGR) of 8.8% to reach $13.9 Billion by 2032.
The global Extra Virgin Camellia Oil Market Comprehensive Study analyzes and forecasts the market size across 6 regions and 24 countries for diverse segments -By Type (Expelling, Lixiviation Process), By Application (Food, Cosmetics, Others)
An Introduction to Extra Virgin Camellia Oil Market
The Extra Virgin Camellia Oil market in 2024 is witnessing robust growth, driven by the increasing demand for premium and health-beneficial cooking oils. Extra virgin camellia oil, known for its delicate flavor and high antioxidant content, is popular in culinary and cosmetic applications. The market benefits from advancements in oil extraction technologies, the growing trend of healthy eating, and the expansion of the specialty oils sector. Additionally, the rising awareness of the nutritional and skincare benefits of camellia oil is contributing to market growth.
Extra Virgin Camellia Oil Competitive Landscape
The market report analyses the leading companies in the industry including Acemeliai, Deerle, Green-sea, Guitaitai, Jinhao, Laozhiqin (Fujian) Oil Co. Ltd, Runxinoil, Shanrun, Waltt Products Co.,Ltd, Wilmar International Ltd, and Others.
Extra Virgin Camellia Oil Market Dynamics
Extra Virgin Camellia Oil Market Trend: Growing Demand for Healthy and Specialty Cooking Oils
The market for extra virgin camellia oil is experiencing a prominent trend towards the growing demand for healthy and specialty cooking oils. Consumers are increasingly prioritizing health-conscious choices in their diets, seeking alternatives to traditional cooking oils that offer unique nutritional benefits. Extra virgin camellia oil, known for its high levels of monounsaturated fats, antioxidants, and low saturated fat content, aligns with this trend as a premium and healthier option for culinary applications. This trend is driven by consumer awareness of the health benefits associated with specific oils and the desire for flavorful and versatile cooking ingredients.
Extra Virgin Camellia Oil Market Driver: Health and Wellness Concerns Driving Ingredient Choices
A major driver for the extra virgin camellia oil market is the increasing focus on health and wellness concerns driving ingredient choices. As consumers become more educated about the impact of dietary fats on health, there is a shift towards selecting oils that offer nutritional advantages without compromising on taste or culinary performance. Extra virgin camellia oil, with its heart-healthy properties and ability to withstand high cooking temperatures, appeals to health-conscious consumers looking for alternatives to traditional oils like olive or vegetable oil. This consumer-driven demand for healthier cooking oils and ingredients fuels the growth of the extra virgin camellia oil market.
Extra Virgin Camellia Oil Market Opportunity: Positioning as a Premium and Versatile Culinary Oil
The extra virgin camellia oil market presents a significant opportunity for positioning as a premium and versatile culinary oil. Producers and marketers of camellia oil can capitalize on its unique nutritional profile, including high levels of oleic acid, antioxidants, and vitamin E, by highlighting its health benefits and culinary versatility. This opportunity includes promoting extra virgin camellia oil as a suitable option for various cooking methods, such as sautéing, frying, baking, and salad dressings, due to its neutral flavor and high smoke point. Additionally, targeting health-conscious consumers, gourmet chefs, and food enthusiasts through educational campaigns, recipe demonstrations, and product innovation can further enhance the market presence and appeal of extra virgin camellia oil in the healthy cooking oil segment. By positioning camellia oil as a premium, healthy, and versatile ingredient, companies can tap into the growing demand for specialty oils and cater to evolving consumer preferences in the culinary market.
Extra Virgin Camellia Oil Market Share Analysis: Expelling Type segment generated the highest revenue share in the industry
The largest segment in the Extra Virgin Camellia Oil Market is the Expelling Type. This segment represents oils that are extracted through mechanical pressing or expelling of camellia seeds, ensuring minimal processing and retaining the natural qualities of the oil. The expelling process involves crushing the seeds to extract the oil, without the use of heat or chemicals, preserving the oil's nutritional value, flavor, and aroma. Consumers increasingly prefer expelling type oils due to their perceived higher quality, purity, and health benefits. Expelling type oils are rich in antioxidants, vitamins, and essential fatty acids, making them popular choices for culinary uses, skincare products, and dietary supplements. The demand for expelling type extra virgin camellia oil is expected to continue growing rapidly, driven by the rising preference for natural and healthy products across various industries.
Extra Virgin Camellia Oil Market Share Analysis: Cosmetics is the fastest growing segment over the forecast period to 2032
The fastest-growing segment in the Extra Virgin Camellia Oil Market is the Cosmetics application. Extra virgin camellia oil has gained significant traction in the cosmetics industry due to its numerous skincare benefits. Rich in antioxidants, vitamins, and essential fatty acids, camellia oil is known for its moisturizing, anti-aging, and soothing properties. It is easily absorbed by the skin, leaving it soft, supple, and hydrated without feeling greasy. The oil's ability to promote collagen production and improve skin elasticity makes it a popular ingredient in anti-aging creams, serums, and lotions. Additionally, camellia oil is used in hair care products for its nourishing and conditioning effects on hair, promoting shine, and reducing frizz. With the growing demand for natural and organic ingredients in cosmetics, the market for extra virgin camellia oil in the cosmetics segment is expected to experience rapid growth through 2032.
Extra Virgin Camellia Oil Market Segmentation
By Type
Expelling
Lixiviation Process
By Application
Food
Cosmetics
Others
Countries Analyzed
North America (US, Canada, Mexico)
Europe (Germany, UK, France, Spain, Italy, Russia, Rest of Europe)
Asia Pacific (China, India, Japan, South Korea, Australia, South East Asia, Rest of Asia)
South America (Brazil, Argentina, Rest of South America)
Middle East and Africa (Saudi Arabia, UAE, Rest of Middle East, South Africa, Egypt, Rest of Africa)
Extra Virgin Camellia Oil Companies Profiled in the Study
Acemeliai
Deerle
Green-sea
Guitaitai
Jinhao
Laozhiqin (Fujian) Oil Co. Ltd
Runxinoil
Shanrun
Waltt Products Co.,Ltd
Wilmar International Ltd
*- List Not Exhaustive
Chapter 1. TABLE OF CONTENTS
Chapter 2. Introduction to Extra Virgin Camellia Oil Market
2.1. Market Overview
2.2. Key Statistics and Report Highlights
2.3. Scope of the Comprehensive Study
2.3.1. Market Definition
2.3.2 Countries and Regions Covered
2.3.3 Research Objective
2.3.4 Units, Currency, and Conversions
2.3.5 Industry Value Chain
2.4. Key Market Segments
2.5. Key Companies
2.6. Study Period
Chapter 3. Strategic Analysis Review
3.1. Extra Virgin Camellia Oil Pricing Analysis and Forecast
3.2. Porter’s Five Forces
3.3. Market Ecosystem
3.4. SWOT Analysis
3.5. Regulatory Scenario
3.3. Effects of Inflation, Russia-Ukraine War, moderating economic growth, and other macroeconomic factors
Chapter 4. Competitive Landscape
4.1. Market Share Analysis
4.1.1. Global Extra Virgin Camellia Oil Market Share by Company, 2023
4.1.2. Product Offerings of Leading Extra Virgin Camellia Oil Companies
4.2. Market Entropy
4.2.1. New Product Launches in the Industry
4.2.2. Mergers, Acquisitions, Joint ventures, and Partnerships
4.3. Key Strategies and Best Practices
Chapter 5. Global Market Projections: Best, Reference, and Low Case Scenarios
5.1. Growth Analysis- Case Scenario Definitions
5.2. Low Growth Case Scenario Forecasts
5.3. Reference Growth Case Scenario Forecasts
5.4. High Growth Case Scenario Forecasts
Chapter 6. Market Dynamics
6.1. Extra Virgin Camellia Oil Market Drivers
6.2. Extra Virgin Camellia Oil Market Challenges
6.6. Extra Virgin Camellia Oil Market Opportunities
6.4. Extra Virgin Camellia Oil Market Trends
Chapter 7. Global Extra Virgin Camellia Oil Market Outlook Trends
7.1. Global Extra Virgin Camellia Oil Revenue (USD Million) and CAGR (%) by Type (2021-2032)
7.2. Global Extra Virgin Camellia Oil Revenue (USD Million) and CAGR (%) by Application (2021-2032)
7.3. Global Extra Virgin Camellia Oil Revenue (USD Million) and CAGR (%) by Product (2021-2032)
By Type
Expelling
Lixiviation Process
By Application
Food
Cosmetics
Others
Chapter 8. Global Extra Virgin Camellia Oil Regional Analysis and Outlook
8.1. Global Extra Virgin Camellia Oil Revenue (USD Million) By Regions (2021- 2032)
8.2. North America Extra Virgin Camellia Oil Revenue (USD Million) by Country (2021-2032)
8.2.1. United States Extra Virgin Camellia Oil Regional Analysis and Outlook
8.2.2. Canada Extra Virgin Camellia Oil Regional Analysis and Outlook
8.2.3. Mexico Extra Virgin Camellia Oil Regional Analysis and Outlook
8.3. Europe Extra Virgin Camellia Oil Revenue (USD Million), by Country (2021-2032)
8.3.1. Germany Extra Virgin Camellia Oil Regional Analysis and Outlook
8.3.2. France Extra Virgin Camellia Oil Regional Analysis and Outlook
8.3.3. United Kingdom Extra Virgin Camellia Oil Regional Analysis and Outlook
8.3.4. Spain Extra Virgin Camellia Oil Regional Analysis and Outlook
8.3.5. Italy Extra Virgin Camellia Oil Regional Analysis and Outlook
8.3.6. Russia Extra Virgin Camellia Oil Regional Analysis and Outlook
8.3.7. Rest of Europe Extra Virgin Camellia Oil Regional Analysis and Outlook
8.4. Asia Pacific Extra Virgin Camellia Oil Revenue (USD Million) by Country (2021-2032)
8.4.1. China Extra Virgin Camellia Oil Regional Analysis and Outlook
8.4.2. Japan Extra Virgin Camellia Oil Regional Analysis and Outlook
8.4.3. India Extra Virgin Camellia Oil Regional Analysis and Outlook
8.4.4. South Korea Extra Virgin Camellia Oil Regional Analysis and Outlook
8.4.5. Australia Extra Virgin Camellia Oil Regional Analysis and Outlook
8.4.6. South East Asia Extra Virgin Camellia Oil Regional Analysis and Outlook
8.4.7. Rest of Asia Pacific Extra Virgin Camellia Oil Regional Analysis and Outlook
8.5. South America Extra Virgin Camellia Oil Revenue (USD Million), by Country (2021-2032)
8.5.1. Brazil Extra Virgin Camellia Oil Regional Analysis and Outlook
8.5.2. Argentina Extra Virgin Camellia Oil Regional Analysis and Outlook
8.5.3. Rest of South America Extra Virgin Camellia Oil Regional Analysis and Outlook
8.6. Middle East and Africa Extra Virgin Camellia Oil Revenue (USD Million) by Country (2021-2032)
8.6.1. Middle East Extra Virgin Camellia Oil Regional Analysis and Outlook
8.6.2. Africa Extra Virgin Camellia Oil Regional Analysis and Outlook
Chapter 9. North America Extra Virgin Camellia Oil Analysis and Outlook
9.1. North America Extra Virgin Camellia Oil Revenue (USD Million) by Segments (2021-2032)
9.1.1. North America Extra Virgin Camellia Oil Revenue (USD Million) by Type (2021-2032)
9.1.2. North America Extra Virgin Camellia Oil Revenue (USD Million) by Application (2021-2032)
9.1.3. North America Extra Virgin Camellia Oil Revenue (USD Million) by Product (2021-2032)
By Type
Expelling
Lixiviation Process
By Application
Food
Cosmetics
Others
Chapter 10. Europe Extra Virgin Camellia Oil Analysis and Outlook
10.1. Europe Extra Virgin Camellia Oil Revenue (USD Million), by Segments (USD Million) (2021-2032)
10.1.1. Europe Extra Virgin Camellia Oil Revenue (USD Million) by Type (2021-2032)
10.1.2. Europe Extra Virgin Camellia Oil Revenue (USD Million) by Application (2021-2032)
10.1.3. Europe Extra Virgin Camellia Oil Revenue (USD Million) by Product (2021-2032)
By Type
Expelling
Lixiviation Process
By Application
Food
Cosmetics
Others
Chapter 11. Asia Pacific Extra Virgin Camellia Oil Analysis and Outlook
11.1. Asia Pacific Extra Virgin Camellia Oil Revenue (USD Million), and Revenue (USD Million) by Segments (2021-2032)
11.1.1. Asia Pacific Extra Virgin Camellia Oil Revenue (USD Million) by Type (2021-2032)
11.1.2. Asia Pacific Extra Virgin Camellia Oil Revenue (USD Million) by Application (2021-2032)
11.1.3. Asia Pacific Extra Virgin Camellia Oil Revenue (USD Million) by Product (2021-2032)
By Type
Expelling
Lixiviation Process
By Application
Food
Cosmetics
Others
Chapter 12. South America Extra Virgin Camellia Oil Analysis and Outlook
12.1. South America Extra Virgin Camellia Oil Revenue (USD Million), by Segments (2021-2032)
12.1.1. South America Extra Virgin Camellia Oil Revenue (USD Million) by Type (2021-2032)
12.1.2. South America Extra Virgin Camellia Oil Revenue (USD Million) by Application (2021-2032)
12.1.3. South America Extra Virgin Camellia Oil Revenue (USD Million) by Product (2021-2032)
By Type
Expelling
Lixiviation Process
By Application
Food
Cosmetics
Others
Chapter 13. Middle East and Africa Extra Virgin Camellia Oil Analysis and Outlook
13.1. Middle East and Africa Extra Virgin Camellia Oil Revenue (USD Million), by Segments (2021-2032)
13.1.1. Middle East and Africa Extra Virgin Camellia Oil Revenue (USD Million) by Type (2021-2032)
13.1.2. Middle East and Africa Extra Virgin Camellia Oil Revenue (USD Million) by Application (2021-2032)
13.1.3. Middle East and Africa Extra Virgin Camellia Oil Revenue (USD Million) by Product (2021-2032)
By Type
Expelling
Lixiviation Process
By Application
Food
Cosmetics
Others
Chapter 14. Extra Virgin Camellia Oil Company Profiles
14.1 Business Overview
14.2 Product Profiles
14.3 SWOT Profiles
14.5 Recent Developments
14.6 Financial Profile
List of Companies
Acemeliai
Deerle
Green-sea
Guitaitai
Jinhao
Laozhiqin (Fujian) Oil Co. Ltd
Runxinoil
Shanrun
Waltt Products Co.,Ltd
Wilmar International Ltd
15. Methodology and Data Sources
15.1 Customization Offerings
15.2 Subscription Services
15.3 Related Reports
15.4 Publisher Expertise
LIST OF TABLES
Table 1 Market Segmentation Analysis
Table 2 Global Extra Virgin Camellia Oil Market Share of Leading Companies, 2023
Table 3 Product Offerings of Leading Companies
Table 4 Low Growth Scenario Forecasts
Table 5 Reference Case Growth Scenario
Table 6 High Growth Case Scenario
Table 7 Global Extra Virgin Camellia Oil Revenue (USD Million) And CAGR (%) By Type (2021-2032)
Table 8 Global Extra Virgin Camellia Oil Revenue (USD Million) And CAGR (%) By Application (2021-2032)
Table 9 Global Extra Virgin Camellia Oil Revenue (USD Million) And CAGR (%) By Product (2021-2032)
Table 10 Global Extra Virgin Camellia Oil Market Revenue (USD Million) By Regions (2021-2032)
Table 11 Global Extra Virgin Camellia Oil Market Share (%) By Regions (2021-2032)
Table 12 North America Extra Virgin Camellia Oil Revenue (USD Million) By Country (2021-2032)
Table 13 Europe Extra Virgin Camellia Oil Revenue (USD Million) By Country (2021-2032)
Table 14 Asia Pacific Extra Virgin Camellia Oil Revenue (USD Million) By Country (2021-2032)
Table 15 South America Extra Virgin Camellia Oil Revenue (USD Million) By Country (2021-2032)
Table 16 Middle East and Africa Extra Virgin Camellia Oil Revenue (USD Million) By Region (2021-2032)
Table 17 North America Extra Virgin Camellia Oil Revenue (USD Million) By Type (2021-2032)
Table 18 North America Extra Virgin Camellia Oil Revenue (USD Million) By Application (2021-2032)
Table 19 North America Extra Virgin Camellia Oil Revenue (USD Million) By Product (2021-2032)
Table 20 Europe Extra Virgin Camellia Oil Revenue (USD Million) By Type (2021-2032)
Table 21 Europe Extra Virgin Camellia Oil Revenue (USD Million) By Application (2021-2032)
Table 22 Europe Extra Virgin Camellia Oil Revenue (USD Million) By Product (2021-2032)
Table 23 Asia Pacific Extra Virgin Camellia Oil Revenue (USD Million) By Type (2021-2032)
Table 24 Asia Pacific Extra Virgin Camellia Oil Revenue (USD Million) By Application (2021-2032)
Table 25 Asia Pacific Extra Virgin Camellia Oil Revenue (USD Million) By Product (2021-2032)
Table 26 South America Extra Virgin Camellia Oil Revenue (USD Million) By Type (2021-2032)
Table 27 South America Extra Virgin Camellia Oil Revenue (USD Million) By Application (2021-2032)
Table 28 South America Extra Virgin Camellia Oil Revenue (USD Million) By Product (2021-2032)
Table 29 Middle East and Africa Extra Virgin Camellia Oil Revenue (USD Million) By Type (2021-2032)
Table 30 Middle East and Africa Extra Virgin Camellia Oil Revenue (USD Million) By Application (2021-2032)
Table 31 Middle East and Africa Extra Virgin Camellia Oil Revenue (USD Million) By Product (2021-2032)
LIST OF FIGURES
Figure 1. Market Scope
Figure 2. Pricing Forecasts Per Unit, 2023- 2032
Figure 3. Porter’s Five Forces
Figure 4. Global Extra Virgin Camellia Oil Market Revenue (USD Million) By Regions (2021-2032)
Figure 5. Global Extra Virgin Camellia Oil Market Share (%) By Regions (2023)
Figure 6. North America Extra Virgin Camellia Oil Revenue (USD Million) By Country (2021-2032)
Figure 7. United States Extra Virgin Camellia Oil Revenue (USD Million) By Country (2021-2032)
Figure 8. Canada Extra Virgin Camellia Oil Revenue (USD Million) By Country (2021-2032)
Figure 9. Mexico Extra Virgin Camellia Oil Revenue (USD Million) By Country (2021-2032)
Figure 10. Europe Extra Virgin Camellia Oil Revenue (USD Million) By Country (2021-2032)
Figure 11. Germany Extra Virgin Camellia Oil Revenue (USD Million) By Country (2021-2032)
Figure 12. France Extra Virgin Camellia Oil Revenue (USD Million) By Country (2021-2032)
Figure 13. United Kingdom Extra Virgin Camellia Oil Revenue (USD Million) By Country (2021-2032)
Figure 14. Spain Extra Virgin Camellia Oil Revenue (USD Million) By Country (2021-2032)
Figure 15. Italy Extra Virgin Camellia Oil Revenue (USD Million) By Country (2021-2032)
Figure 16. Russia Extra Virgin Camellia Oil Revenue (USD Million) By Country (2021-2032)
Figure 17. Rest of Europe Extra Virgin Camellia Oil Revenue (USD Million) By Country (2021-2032)
Figure 11. Asia Pacific Extra Virgin Camellia Oil Revenue (USD Million) By Country (2021-2032)
Figure 12. China Extra Virgin Camellia Oil Revenue (USD Million) By Country (2021-2032)
Figure 13. Japan Extra Virgin Camellia Oil Revenue (USD Million) By Country (2021-2032)
Figure 14. India Extra Virgin Camellia Oil Revenue (USD Million) By Country (2021-2032)
Figure 15. South Korea Extra Virgin Camellia Oil Revenue (USD Million) By Country (2021-2032)
Figure 16. Australia Extra Virgin Camellia Oil Revenue (USD Million) By Country (2021-2032)
Figure 17. South East Asia Extra Virgin Camellia Oil Revenue (USD Million) By Country (2021-2032)
Figure 18. South America Extra Virgin Camellia Oil Revenue (USD Million) By Country (2021-2032)
Figure 19. Brazil Extra Virgin Camellia Oil Revenue (USD Million) By Country (2021-2032)
Figure 20. Argentina Extra Virgin Camellia Oil Revenue (USD Million) By Country (2021-2032)
Figure 21. Rest of Asia Pacific Extra Virgin Camellia Oil Revenue (USD Million) By Country (2021-2032)
Figure 22. Middle East and Africa Extra Virgin Camellia Oil Revenue (USD Million) By Region (2021-2032)
Figure 23. Saudi Arabia Extra Virgin Camellia Oil Revenue (USD Million) By Region (2021-2032)
Figure 24. The UAE Extra Virgin Camellia Oil Revenue (USD Million) By Region (2021-2032)
Figure 25. Rest of Middle East Extra Virgin Camellia Oil Revenue (USD Million) By Region (2021-2032)
Figure 26. South Africa Extra Virgin Camellia Oil Revenue (USD Million) By Region (2021-2032)
Figure 27. Africa Extra Virgin Camellia Oil Revenue (USD Million) By Region (2021-2032)
Figure 28. North America Extra Virgin Camellia Oil Revenue (USD Million) By Type (2021-2032)
Figure 29. North America Extra Virgin Camellia Oil Revenue (USD Million) By Application (2021-2032)
Figure 30. North America Extra Virgin Camellia Oil Revenue (USD Million) By Product (2021-2032)
Figure 31. Europe Extra Virgin Camellia Oil Revenue (USD Million) By Type (2021-2032)
Figure 32. Europe Extra Virgin Camellia Oil Revenue (USD Million) By Application (2021-2032)
Figure 33. Europe Extra Virgin Camellia Oil Revenue (USD Million) By Product (2021-2032)
Figure 34. Asia Pacific Extra Virgin Camellia Oil Revenue (USD Million) By Type (2021-2032)
Figure 35. Asia Pacific Extra Virgin Camellia Oil Revenue (USD Million) By Application (2021-2032)
Figure 36. Asia Pacific Extra Virgin Camellia Oil Revenue (USD Million) By Product (2021-2032)
Figure 37. South America Extra Virgin Camellia Oil Revenue (USD Million) By Type (2021-2032)
Figure 38. South America Extra Virgin Camellia Oil Revenue (USD Million) By Application (2021-2032)
Figure 39. South America Extra Virgin Camellia Oil Revenue (USD Million) By Product (2021-2032)
Figure 40. Middle East and Africa Extra Virgin Camellia Oil Revenue (USD Million) By Type (2021-2032)
Figure 41. Middle East and Africa Extra Virgin Camellia Oil Revenue (USD Million) By Application (2021-2032)
Figure 42. Middle East and Africa Extra Virgin Camellia Oil Revenue (USD Million) By Product (2021-2032)
By Type
Expelling
Lixiviation Process
By Application
Food
Cosmetics
Others
Countries Analyzed
North America (US, Canada, Mexico)
Europe (Germany, UK, France, Spain, Italy, Russia, Rest of Europe)
Asia Pacific (China, India, Japan, South Korea, Australia, South East Asia, Rest of Asia)
South America (Brazil, Argentina, Rest of South America)
Middle East and Africa (Saudi Arabia, UAE, Rest of Middle East, South Africa, Egypt, Rest of Africa)
