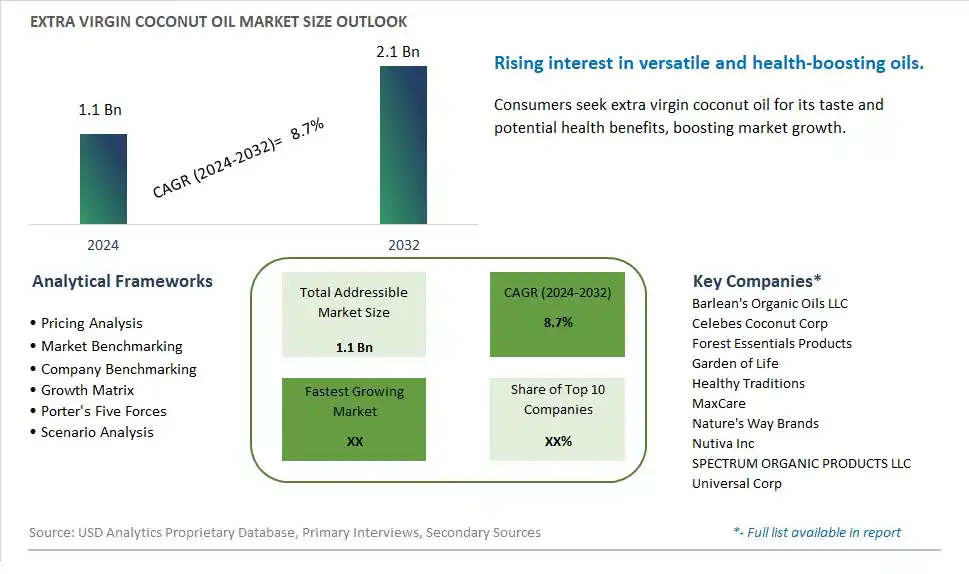
Global Extra Virgin Coconut Oil Market Size is valued at $1.1 Billion in 2024 and is forecast to register a growth rate (CAGR) of 8.7% to reach $2.1 Billion by 2032.
The global Extra Virgin Coconut Oil Market Comprehensive Study analyzes and forecasts the market size across 6 regions and 24 countries for diverse segments -By End-User (B2B, B2C), By Type (Organic, Conventional), By Packaging (Metal Cans, Plastic Bottles, Pouches)
An Introduction to Extra Virgin Coconut Oil Market
In 2024, the Extra Virgin Coconut Oil market is thriving, fueled by the rising demand for natural and versatile cooking and personal care products. Extra virgin coconut oil, valued for its mild flavor, high lauric acid content, and numerous health benefits, is popular among health-conscious consumers. The market benefits from advancements in oil extraction and processing technologies, the growing trend of natural and organic products, and the expansion of the wellness and beauty sectors. Additionally, the increasing focus on sustainable and fair trade sourcing is driving market growth.
Extra Virgin Coconut Oil Competitive Landscape
The market report analyses the leading companies in the industry including Barlean's Organic Oils LLC, Celebes Coconut Corp, Forest Essentials Products, Garden of Life, Healthy Traditions, MaxCare, Nature's Way Brands, Nutiva Inc, SPECTRUM ORGANIC PRODUCTS LLC, Universal Corp, and Others.
Extra Virgin Coconut Oil Market Dynamics
Extra Virgin Coconut Oil Market Trend: Increasing Demand for Natural and Healthy Ingredients
The market for extra virgin coconut oil is experiencing a prominent trend towards the increasing demand for natural and healthy ingredients. Consumers are becoming more conscious of their health and are actively seeking products that are free from artificial additives, chemicals, and preservatives. Extra virgin coconut oil, known for its natural properties, including medium-chain fatty acids and antioxidants, aligns with this trend as a versatile ingredient with potential health benefits. This trend is driven by consumer preferences for clean-label products, organic options, and the desire for natural alternatives in cooking, skincare, and wellness applications.
Extra Virgin Coconut Oil Market Driver: Rising Popularity of Coconut-Based Products
A major driver for the extra virgin coconut oil market is the rising popularity of coconut-based products across various industries. Coconut oil has gained traction as a versatile ingredient used not only in cooking but also in cosmetics, personal care products, and natural remedies. The diverse applications of extra virgin coconut oil, such as moisturizing properties in skincare, hair care, and as a healthier cooking oil alternative, contribute to its growing demand among consumers. This consumer-driven demand for coconut-based products and ingredients fuels the growth of the extra virgin coconut oil market.
Extra Virgin Coconut Oil Market Opportunity: Expansion into Health and Wellness Segments
The extra virgin coconut oil market presents a significant opportunity for expansion into health and wellness segments. Producers and manufacturers of coconut oil can leverage its natural properties, including antimicrobial, anti-inflammatory, and moisturizing benefits, to target health-conscious consumers, wellness enthusiasts, and the beauty industry. This opportunity includes developing specialized products such as organic, cold-pressed, or infused coconut oil variants for specific applications, such as dietary supplements, natural skincare formulations, and aromatherapy products. Additionally, partnering with health and wellness brands, retailers, and online platforms to promote the benefits of extra virgin coconut oil and educate consumers about its uses can further enhance market penetration and drive growth in the coconut oil segment. By capitalizing on the growing demand for natural, multifunctional ingredients, companies can position extra virgin coconut oil as a preferred choice in the health, beauty, and wellness markets.
Extra Virgin Coconut Oil Market Share Analysis: B2C segment generated the highest revenue share in the industry
The largest segment in the Extra Virgin Coconut Oil Market is the B2C (Business to Consumer) end-user segment. Extra virgin coconut oil has gained immense popularity among individual consumers due to its versatile uses and health benefits. It is widely used in households for cooking purposes, as a healthier alternative to regular cooking oils. Its high smoke point, pleasant aroma, and distinct flavor make it a preferred choice for cooking various cuisines. Additionally, extra virgin coconut oil is extensively used in personal care and beauty products such as skincare creams, lotions, hair oils, and massage oils. Its moisturizing, anti-inflammatory, and antimicrobial properties make it a valuable ingredient in natural skincare formulations. With the growing awareness of the health benefits associated with coconut oil and the increasing demand for natural and organic products, the B2C segment of the extra virgin coconut oil market is witnessing rapid growth and is expected to continue growing significantly in the coming years.
Extra Virgin Coconut Oil Market Share Analysis: Organic Type is the fastest growing segment over the forecast period to 2032
The fastest-growing segment in the Extra Virgin Coconut Oil Market is the Organic type. Organic extra virgin coconut oil is experiencing rapid growth due to increasing consumer awareness and preference for organic and natural products. Consumers are becoming more health-conscious and are seeking products that are free from pesticides, chemicals, and artificial additives. Organic extra virgin coconut oil is produced from coconuts that are grown without synthetic pesticides or fertilizers, ensuring a higher quality and purity level. It retains more nutrients and antioxidants compared to conventional coconut oil, making it a popular choice among health-conscious consumers. The demand for organic extra virgin coconut oil is also driven by its use in organic food products, natural cosmetics, and wellness supplements. As the organic food and wellness industries continue to expand globally, the organic segment of the extra virgin coconut oil market is expected to witness significant growth and market share by 2032.
Extra Virgin Coconut Oil Market Share Analysis: Plastic Bottles segment generated the highest revenue share in the industry
The largest segment in the Extra Virgin Coconut Oil Market is the Plastic Bottles category. Plastic bottles are widely used for packaging extra virgin coconut oil due to their convenience, durability, and cost-effectiveness. They provide a lightweight and sturdy packaging solution that is easy to handle and transport, making them popular among manufacturers, retailers, and consumers alike. Plastic bottles also offer excellent protection against moisture, light, and air, which helps preserve the freshness and quality of the coconut oil. Further, plastic bottles are available in various sizes and shapes, catering to different consumer preferences and packaging requirements. With the rising demand for extra virgin coconut oil across various industries such as food and beverages, cosmetics, and pharmaceuticals, the plastic bottles segment continues to dominate the market and is projected to maintain its leading position in the coming years.
Extra Virgin Coconut Oil Market Segmentation
By End-User
B2B
B2C
By Type
Organic
Conventional
By Packaging
Metal Cans
Plastic Bottles
Pouches
Countries Analyzed
North America (US, Canada, Mexico)
Europe (Germany, UK, France, Spain, Italy, Russia, Rest of Europe)
Asia Pacific (China, India, Japan, South Korea, Australia, South East Asia, Rest of Asia)
South America (Brazil, Argentina, Rest of South America)
Middle East and Africa (Saudi Arabia, UAE, Rest of Middle East, South Africa, Egypt, Rest of Africa)
Extra Virgin Coconut Oil Companies Profiled in the Study
Barlean's Organic Oils LLC
Celebes Coconut Corp
Forest Essentials Products
Garden of Life
Healthy Traditions
MaxCare
Nature's Way Brands
Nutiva Inc
SPECTRUM ORGANIC PRODUCTS LLC
Universal Corp
*- List Not Exhaustive
Chapter 1. TABLE OF CONTENTS
Chapter 2. Introduction to Extra Virgin Coconut Oil Market
2.1. Market Overview
2.2. Key Statistics and Report Highlights
2.3. Scope of the Comprehensive Study
2.3.1. Market Definition
2.3.2 Countries and Regions Covered
2.3.3 Research Objective
2.3.4 Units, Currency, and Conversions
2.3.5 Industry Value Chain
2.4. Key Market Segments
2.5. Key Companies
2.6. Study Period
Chapter 3. Strategic Analysis Review
3.1. Extra Virgin Coconut Oil Pricing Analysis and Forecast
3.2. Porter’s Five Forces
3.3. Market Ecosystem
3.4. SWOT Analysis
3.5. Regulatory Scenario
3.3. Effects of Inflation, Russia-Ukraine War, moderating economic growth, and other macroeconomic factors
Chapter 4. Competitive Landscape
4.1. Market Share Analysis
4.1.1. Global Extra Virgin Coconut Oil Market Share by Company, 2023
4.1.2. Product Offerings of Leading Extra Virgin Coconut Oil Companies
4.2. Market Entropy
4.2.1. New Product Launches in the Industry
4.2.2. Mergers, Acquisitions, Joint ventures, and Partnerships
4.3. Key Strategies and Best Practices
Chapter 5. Global Market Projections: Best, Reference, and Low Case Scenarios
5.1. Growth Analysis- Case Scenario Definitions
5.2. Low Growth Case Scenario Forecasts
5.3. Reference Growth Case Scenario Forecasts
5.4. High Growth Case Scenario Forecasts
Chapter 6. Market Dynamics
6.1. Extra Virgin Coconut Oil Market Drivers
6.2. Extra Virgin Coconut Oil Market Challenges
6.6. Extra Virgin Coconut Oil Market Opportunities
6.4. Extra Virgin Coconut Oil Market Trends
Chapter 7. Global Extra Virgin Coconut Oil Market Outlook Trends
7.1. Global Extra Virgin Coconut Oil Revenue (USD Million) and CAGR (%) by Type (2021-2032)
7.2. Global Extra Virgin Coconut Oil Revenue (USD Million) and CAGR (%) by Application (2021-2032)
7.3. Global Extra Virgin Coconut Oil Revenue (USD Million) and CAGR (%) by Product (2021-2032)
By End-User
B2B
B2C
By Type
Organic
Conventional
By Packaging
Metal Cans
Plastic Bottles
Pouches
Chapter 8. Global Extra Virgin Coconut Oil Regional Analysis and Outlook
8.1. Global Extra Virgin Coconut Oil Revenue (USD Million) By Regions (2021- 2032)
8.2. North America Extra Virgin Coconut Oil Revenue (USD Million) by Country (2021-2032)
8.2.1. United States Extra Virgin Coconut Oil Regional Analysis and Outlook
8.2.2. Canada Extra Virgin Coconut Oil Regional Analysis and Outlook
8.2.3. Mexico Extra Virgin Coconut Oil Regional Analysis and Outlook
8.3. Europe Extra Virgin Coconut Oil Revenue (USD Million), by Country (2021-2032)
8.3.1. Germany Extra Virgin Coconut Oil Regional Analysis and Outlook
8.3.2. France Extra Virgin Coconut Oil Regional Analysis and Outlook
8.3.3. United Kingdom Extra Virgin Coconut Oil Regional Analysis and Outlook
8.3.4. Spain Extra Virgin Coconut Oil Regional Analysis and Outlook
8.3.5. Italy Extra Virgin Coconut Oil Regional Analysis and Outlook
8.3.6. Russia Extra Virgin Coconut Oil Regional Analysis and Outlook
8.3.7. Rest of Europe Extra Virgin Coconut Oil Regional Analysis and Outlook
8.4. Asia Pacific Extra Virgin Coconut Oil Revenue (USD Million) by Country (2021-2032)
8.4.1. China Extra Virgin Coconut Oil Regional Analysis and Outlook
8.4.2. Japan Extra Virgin Coconut Oil Regional Analysis and Outlook
8.4.3. India Extra Virgin Coconut Oil Regional Analysis and Outlook
8.4.4. South Korea Extra Virgin Coconut Oil Regional Analysis and Outlook
8.4.5. Australia Extra Virgin Coconut Oil Regional Analysis and Outlook
8.4.6. South East Asia Extra Virgin Coconut Oil Regional Analysis and Outlook
8.4.7. Rest of Asia Pacific Extra Virgin Coconut Oil Regional Analysis and Outlook
8.5. South America Extra Virgin Coconut Oil Revenue (USD Million), by Country (2021-2032)
8.5.1. Brazil Extra Virgin Coconut Oil Regional Analysis and Outlook
8.5.2. Argentina Extra Virgin Coconut Oil Regional Analysis and Outlook
8.5.3. Rest of South America Extra Virgin Coconut Oil Regional Analysis and Outlook
8.6. Middle East and Africa Extra Virgin Coconut Oil Revenue (USD Million) by Country (2021-2032)
8.6.1. Middle East Extra Virgin Coconut Oil Regional Analysis and Outlook
8.6.2. Africa Extra Virgin Coconut Oil Regional Analysis and Outlook
Chapter 9. North America Extra Virgin Coconut Oil Analysis and Outlook
9.1. North America Extra Virgin Coconut Oil Revenue (USD Million) by Segments (2021-2032)
9.1.1. North America Extra Virgin Coconut Oil Revenue (USD Million) by Type (2021-2032)
9.1.2. North America Extra Virgin Coconut Oil Revenue (USD Million) by Application (2021-2032)
9.1.3. North America Extra Virgin Coconut Oil Revenue (USD Million) by Product (2021-2032)
By End-User
B2B
B2C
By Type
Organic
Conventional
By Packaging
Metal Cans
Plastic Bottles
Pouches
Chapter 10. Europe Extra Virgin Coconut Oil Analysis and Outlook
10.1. Europe Extra Virgin Coconut Oil Revenue (USD Million), by Segments (USD Million) (2021-2032)
10.1.1. Europe Extra Virgin Coconut Oil Revenue (USD Million) by Type (2021-2032)
10.1.2. Europe Extra Virgin Coconut Oil Revenue (USD Million) by Application (2021-2032)
10.1.3. Europe Extra Virgin Coconut Oil Revenue (USD Million) by Product (2021-2032)
By End-User
B2B
B2C
By Type
Organic
Conventional
By Packaging
Metal Cans
Plastic Bottles
Pouches
Chapter 11. Asia Pacific Extra Virgin Coconut Oil Analysis and Outlook
11.1. Asia Pacific Extra Virgin Coconut Oil Revenue (USD Million), and Revenue (USD Million) by Segments (2021-2032)
11.1.1. Asia Pacific Extra Virgin Coconut Oil Revenue (USD Million) by Type (2021-2032)
11.1.2. Asia Pacific Extra Virgin Coconut Oil Revenue (USD Million) by Application (2021-2032)
11.1.3. Asia Pacific Extra Virgin Coconut Oil Revenue (USD Million) by Product (2021-2032)
By End-User
B2B
B2C
By Type
Organic
Conventional
By Packaging
Metal Cans
Plastic Bottles
Pouches
Chapter 12. South America Extra Virgin Coconut Oil Analysis and Outlook
12.1. South America Extra Virgin Coconut Oil Revenue (USD Million), by Segments (2021-2032)
12.1.1. South America Extra Virgin Coconut Oil Revenue (USD Million) by Type (2021-2032)
12.1.2. South America Extra Virgin Coconut Oil Revenue (USD Million) by Application (2021-2032)
12.1.3. South America Extra Virgin Coconut Oil Revenue (USD Million) by Product (2021-2032)
By End-User
B2B
B2C
By Type
Organic
Conventional
By Packaging
Metal Cans
Plastic Bottles
Pouches
Chapter 13. Middle East and Africa Extra Virgin Coconut Oil Analysis and Outlook
13.1. Middle East and Africa Extra Virgin Coconut Oil Revenue (USD Million), by Segments (2021-2032)
13.1.1. Middle East and Africa Extra Virgin Coconut Oil Revenue (USD Million) by Type (2021-2032)
13.1.2. Middle East and Africa Extra Virgin Coconut Oil Revenue (USD Million) by Application (2021-2032)
13.1.3. Middle East and Africa Extra Virgin Coconut Oil Revenue (USD Million) by Product (2021-2032)
By End-User
B2B
B2C
By Type
Organic
Conventional
By Packaging
Metal Cans
Plastic Bottles
Pouches
Chapter 14. Extra Virgin Coconut Oil Company Profiles
14.1 Business Overview
14.2 Product Profiles
14.3 SWOT Profiles
14.5 Recent Developments
14.6 Financial Profile
List of Companies
Barlean's Organic Oils LLC
Celebes Coconut Corp
Forest Essentials Products
Garden of Life
Healthy Traditions
MaxCare
Nature's Way Brands
Nutiva Inc
SPECTRUM ORGANIC PRODUCTS LLC
Universal Corp
15. Methodology and Data Sources
15.1 Customization Offerings
15.2 Subscription Services
15.3 Related Reports
15.4 Publisher Expertise
LIST OF TABLES
Table 1 Market Segmentation Analysis
Table 2 Global Extra Virgin Coconut Oil Market Share of Leading Companies, 2023
Table 3 Product Offerings of Leading Companies
Table 4 Low Growth Scenario Forecasts
Table 5 Reference Case Growth Scenario
Table 6 High Growth Case Scenario
Table 7 Global Extra Virgin Coconut Oil Revenue (USD Million) And CAGR (%) By Type (2021-2032)
Table 8 Global Extra Virgin Coconut Oil Revenue (USD Million) And CAGR (%) By Application (2021-2032)
Table 9 Global Extra Virgin Coconut Oil Revenue (USD Million) And CAGR (%) By Product (2021-2032)
Table 10 Global Extra Virgin Coconut Oil Market Revenue (USD Million) By Regions (2021-2032)
Table 11 Global Extra Virgin Coconut Oil Market Share (%) By Regions (2021-2032)
Table 12 North America Extra Virgin Coconut Oil Revenue (USD Million) By Country (2021-2032)
Table 13 Europe Extra Virgin Coconut Oil Revenue (USD Million) By Country (2021-2032)
Table 14 Asia Pacific Extra Virgin Coconut Oil Revenue (USD Million) By Country (2021-2032)
Table 15 South America Extra Virgin Coconut Oil Revenue (USD Million) By Country (2021-2032)
Table 16 Middle East and Africa Extra Virgin Coconut Oil Revenue (USD Million) By Region (2021-2032)
Table 17 North America Extra Virgin Coconut Oil Revenue (USD Million) By Type (2021-2032)
Table 18 North America Extra Virgin Coconut Oil Revenue (USD Million) By Application (2021-2032)
Table 19 North America Extra Virgin Coconut Oil Revenue (USD Million) By Product (2021-2032)
Table 20 Europe Extra Virgin Coconut Oil Revenue (USD Million) By Type (2021-2032)
Table 21 Europe Extra Virgin Coconut Oil Revenue (USD Million) By Application (2021-2032)
Table 22 Europe Extra Virgin Coconut Oil Revenue (USD Million) By Product (2021-2032)
Table 23 Asia Pacific Extra Virgin Coconut Oil Revenue (USD Million) By Type (2021-2032)
Table 24 Asia Pacific Extra Virgin Coconut Oil Revenue (USD Million) By Application (2021-2032)
Table 25 Asia Pacific Extra Virgin Coconut Oil Revenue (USD Million) By Product (2021-2032)
Table 26 South America Extra Virgin Coconut Oil Revenue (USD Million) By Type (2021-2032)
Table 27 South America Extra Virgin Coconut Oil Revenue (USD Million) By Application (2021-2032)
Table 28 South America Extra Virgin Coconut Oil Revenue (USD Million) By Product (2021-2032)
Table 29 Middle East and Africa Extra Virgin Coconut Oil Revenue (USD Million) By Type (2021-2032)
Table 30 Middle East and Africa Extra Virgin Coconut Oil Revenue (USD Million) By Application (2021-2032)
Table 31 Middle East and Africa Extra Virgin Coconut Oil Revenue (USD Million) By Product (2021-2032)
LIST OF FIGURES
Figure 1. Market Scope
Figure 2. Pricing Forecasts Per Unit, 2023- 2032
Figure 3. Porter’s Five Forces
Figure 4. Global Extra Virgin Coconut Oil Market Revenue (USD Million) By Regions (2021-2032)
Figure 5. Global Extra Virgin Coconut Oil Market Share (%) By Regions (2023)
Figure 6. North America Extra Virgin Coconut Oil Revenue (USD Million) By Country (2021-2032)
Figure 7. United States Extra Virgin Coconut Oil Revenue (USD Million) By Country (2021-2032)
Figure 8. Canada Extra Virgin Coconut Oil Revenue (USD Million) By Country (2021-2032)
Figure 9. Mexico Extra Virgin Coconut Oil Revenue (USD Million) By Country (2021-2032)
Figure 10. Europe Extra Virgin Coconut Oil Revenue (USD Million) By Country (2021-2032)
Figure 11. Germany Extra Virgin Coconut Oil Revenue (USD Million) By Country (2021-2032)
Figure 12. France Extra Virgin Coconut Oil Revenue (USD Million) By Country (2021-2032)
Figure 13. United Kingdom Extra Virgin Coconut Oil Revenue (USD Million) By Country (2021-2032)
Figure 14. Spain Extra Virgin Coconut Oil Revenue (USD Million) By Country (2021-2032)
Figure 15. Italy Extra Virgin Coconut Oil Revenue (USD Million) By Country (2021-2032)
Figure 16. Russia Extra Virgin Coconut Oil Revenue (USD Million) By Country (2021-2032)
Figure 17. Rest of Europe Extra Virgin Coconut Oil Revenue (USD Million) By Country (2021-2032)
Figure 11. Asia Pacific Extra Virgin Coconut Oil Revenue (USD Million) By Country (2021-2032)
Figure 12. China Extra Virgin Coconut Oil Revenue (USD Million) By Country (2021-2032)
Figure 13. Japan Extra Virgin Coconut Oil Revenue (USD Million) By Country (2021-2032)
Figure 14. India Extra Virgin Coconut Oil Revenue (USD Million) By Country (2021-2032)
Figure 15. South Korea Extra Virgin Coconut Oil Revenue (USD Million) By Country (2021-2032)
Figure 16. Australia Extra Virgin Coconut Oil Revenue (USD Million) By Country (2021-2032)
Figure 17. South East Asia Extra Virgin Coconut Oil Revenue (USD Million) By Country (2021-2032)
Figure 18. South America Extra Virgin Coconut Oil Revenue (USD Million) By Country (2021-2032)
Figure 19. Brazil Extra Virgin Coconut Oil Revenue (USD Million) By Country (2021-2032)
Figure 20. Argentina Extra Virgin Coconut Oil Revenue (USD Million) By Country (2021-2032)
Figure 21. Rest of Asia Pacific Extra Virgin Coconut Oil Revenue (USD Million) By Country (2021-2032)
Figure 22. Middle East and Africa Extra Virgin Coconut Oil Revenue (USD Million) By Region (2021-2032)
Figure 23. Saudi Arabia Extra Virgin Coconut Oil Revenue (USD Million) By Region (2021-2032)
Figure 24. The UAE Extra Virgin Coconut Oil Revenue (USD Million) By Region (2021-2032)
Figure 25. Rest of Middle East Extra Virgin Coconut Oil Revenue (USD Million) By Region (2021-2032)
Figure 26. South Africa Extra Virgin Coconut Oil Revenue (USD Million) By Region (2021-2032)
Figure 27. Africa Extra Virgin Coconut Oil Revenue (USD Million) By Region (2021-2032)
Figure 28. North America Extra Virgin Coconut Oil Revenue (USD Million) By Type (2021-2032)
Figure 29. North America Extra Virgin Coconut Oil Revenue (USD Million) By Application (2021-2032)
Figure 30. North America Extra Virgin Coconut Oil Revenue (USD Million) By Product (2021-2032)
Figure 31. Europe Extra Virgin Coconut Oil Revenue (USD Million) By Type (2021-2032)
Figure 32. Europe Extra Virgin Coconut Oil Revenue (USD Million) By Application (2021-2032)
Figure 33. Europe Extra Virgin Coconut Oil Revenue (USD Million) By Product (2021-2032)
Figure 34. Asia Pacific Extra Virgin Coconut Oil Revenue (USD Million) By Type (2021-2032)
Figure 35. Asia Pacific Extra Virgin Coconut Oil Revenue (USD Million) By Application (2021-2032)
Figure 36. Asia Pacific Extra Virgin Coconut Oil Revenue (USD Million) By Product (2021-2032)
Figure 37. South America Extra Virgin Coconut Oil Revenue (USD Million) By Type (2021-2032)
Figure 38. South America Extra Virgin Coconut Oil Revenue (USD Million) By Application (2021-2032)
Figure 39. South America Extra Virgin Coconut Oil Revenue (USD Million) By Product (2021-2032)
Figure 40. Middle East and Africa Extra Virgin Coconut Oil Revenue (USD Million) By Type (2021-2032)
Figure 41. Middle East and Africa Extra Virgin Coconut Oil Revenue (USD Million) By Application (2021-2032)
Figure 42. Middle East and Africa Extra Virgin Coconut Oil Revenue (USD Million) By Product (2021-2032)
By End-User
B2B
B2C
By Type
Organic
Conventional
By Packaging
Metal Cans
Plastic Bottles
Pouches
Countries Analyzed
North America (US, Canada, Mexico)
Europe (Germany, UK, France, Spain, Italy, Russia, Rest of Europe)
Asia Pacific (China, India, Japan, South Korea, Australia, South East Asia, Rest of Asia)
South America (Brazil, Argentina, Rest of South America)
Middle East and Africa (Saudi Arabia, UAE, Rest of Middle East, South Africa, Egypt, Rest of Africa)
