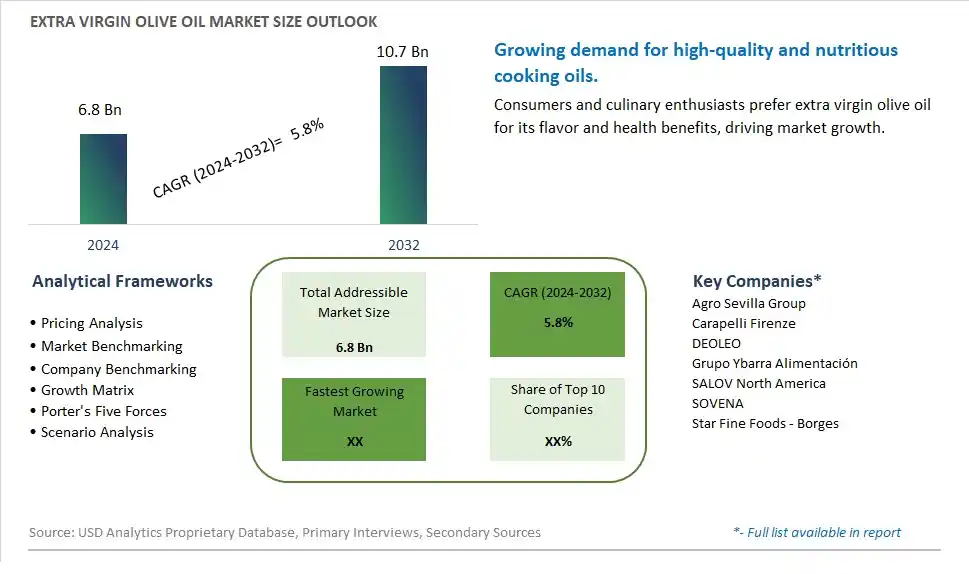
Global Extra Virgin Olive Oil Market Size is valued at $6.8 Billion in 2024 and is forecast to register a growth rate (CAGR) of 5.8% to reach $10.7 Billion by 2032.
The global Extra Virgin Olive Oil Market Comprehensive Study analyzes and forecasts the market size across 6 regions and 24 countries for diverse segments -By Type (Cold Pressed, Flavored, Virgin, Blended, Others), By Application (Cooking, Cosmetics, Pharmaceutical, Fuel)
An Introduction to Extra Virgin Olive Oil Market
The Extra Virgin Olive Oil market in 2024 is experiencing significant growth, driven by the increasing demand for high-quality and health-beneficial cooking oils. Extra virgin olive oil, known for its rich flavor, high monounsaturated fat content, and antioxidant properties, is a staple in Mediterranean and health-focused diets. The market benefits from advancements in olive cultivation and oil extraction technologies, the growing trend of healthy eating, and the expansion of the premium food sector. Additionally, the rising awareness of the cardiovascular benefits of olive oil is contributing to market growth.
Extra Virgin Olive Oil Competitive Landscape
The market report analyses the leading companies in the industry including Agro Sevilla Group, Carapelli Firenze, DEOLEO, Grupo Ybarra Alimentación, SALOV North America, SOVENA, Star Fine Foods - Borges, and Others.
Extra Virgin Olive Oil Market Dynamics
Extra Virgin Olive Oil Market Trend: Increasing Adoption of Mediterranean Diet
The market for extra virgin olive oil is experiencing a prominent trend towards the increasing adoption of the Mediterranean diet. Consumers are becoming more health-conscious and are incorporating elements of the Mediterranean diet, known for its emphasis on olive oil, fruits, vegetables, whole grains, and lean proteins. Extra virgin olive oil, as a key component of this diet, is gaining popularity due to its perceived health benefits, including heart-healthy monounsaturated fats, antioxidants, and anti-inflammatory properties. This trend is driven by consumer awareness of the Mediterranean diet's association with longevity, reduced risk of chronic diseases, and overall well-being.
Extra Virgin Olive Oil Market Driver: Health and Wellness Lifestyle Choices
A major driver for the extra virgin olive oil market is the growing emphasis on health and wellness lifestyle choices among consumers. As individuals prioritize healthier eating habits, they are seeking alternatives to traditional cooking oils that offer nutritional advantages and culinary versatility. Extra virgin olive oil, with its rich flavor profile, low levels of saturated fats, and high levels of antioxidants, appeals to health-conscious consumers looking for a premium and flavorful cooking oil. This consumer-driven demand for healthier ingredients and dietary choices fuels the growth of the extra virgin olive oil market.
Extra Virgin Olive Oil Market Opportunity: Premiumization and Diversification of Olive Oil Products
The extra virgin olive oil market presents a significant opportunity for premiumization and diversification of olive oil products. Producers and distributors can capitalize on the growing demand for high-quality, authentic olive oils by offering a range of products tailored to different consumer preferences. This opportunity includes promoting single-origin or organic extra virgin olive oils, developing flavored or infused variants, and highlighting the traceability and sustainability of olive oil production processes. Additionally, targeting gourmet chefs, culinary enthusiasts, and health-conscious consumers through educational campaigns, cooking demonstrations, and product certifications can further enhance the market presence and value perception of extra virgin olive oil. By positioning olive oil as a premium, versatile, and healthy ingredient, companies can expand their market share and meet the evolving needs of discerning consumers in the culinary and wellness sectors.
Extra Virgin Olive Oil Market Share Analysis: Cold Pressed segment generated the highest revenue share in the industry
The largest segment in the Extra Virgin Olive Oil Market is Cold Pressed. Cold pressing is a traditional and widely preferred method of extracting olive oil that involves crushing the olives without the use of heat or chemicals. This process helps retain the natural flavors, nutrients, and antioxidants present in olives, resulting in a high-quality, flavorful, and healthy oil product. Cold pressed extra virgin olive oil is renowned for its superior taste, aroma, and nutritional benefits, making it highly sought after by consumers who prioritize premium quality and authenticity in their culinary choices. Due to its growing popularity among health-conscious consumers and the increasing demand for natural and unprocessed food products, the cold pressed segment of the extra virgin olive oil market is experiencing rapid growth and is expected to continue expanding significantly in the coming years.
Extra Virgin Olive Oil Market Share Analysis: Cooking is the fastest growing segment over the forecast period to 2032
The fastest-growing segment in the Extra Virgin Olive Oil Market is Cooking. Extra virgin olive oil has long been recognized as a staple in Mediterranean cuisine and is gaining popularity worldwide due to its numerous health benefits and versatile culinary applications. As more consumers become aware of the advantages of using extra virgin olive oil for cooking, such as its high smoke point, rich flavor profile, and heart-healthy properties, the demand for this oil in cooking applications is experiencing substantial growth. Furthermore, with the increasing trend toward healthier eating habits and the incorporation of natural ingredients in cooking, the cooking segment of the extra virgin olive oil market is projected to witness rapid expansion and significant market share by 2032.
Extra Virgin Olive Oil Market Segmentation
By Type
Cold Pressed
Flavored
Virgin
Blended
Others
By Application
Cooking
Cosmetics
Pharmaceutical
Fuel
Countries Analyzed
North America (US, Canada, Mexico)
Europe (Germany, UK, France, Spain, Italy, Russia, Rest of Europe)
Asia Pacific (China, India, Japan, South Korea, Australia, South East Asia, Rest of Asia)
South America (Brazil, Argentina, Rest of South America)
Middle East and Africa (Saudi Arabia, UAE, Rest of Middle East, South Africa, Egypt, Rest of Africa)
Extra Virgin Olive Oil Companies Profiled in the Study
Agro Sevilla Group
Carapelli Firenze
DEOLEO
Grupo Ybarra Alimentación
SALOV North America
SOVENA
Star Fine Foods - Borges
*- List Not Exhaustive
Chapter 1. TABLE OF CONTENTS
Chapter 2. Introduction to Extra Virgin Olive Oil Market
2.1. Market Overview
2.2. Key Statistics and Report Highlights
2.3. Scope of the Comprehensive Study
2.3.1. Market Definition
2.3.2 Countries and Regions Covered
2.3.3 Research Objective
2.3.4 Units, Currency, and Conversions
2.3.5 Industry Value Chain
2.4. Key Market Segments
2.5. Key Companies
2.6. Study Period
Chapter 3. Strategic Analysis Review
3.1. Extra Virgin Olive Oil Pricing Analysis and Forecast
3.2. Porter’s Five Forces
3.3. Market Ecosystem
3.4. SWOT Analysis
3.5. Regulatory Scenario
3.3. Effects of Inflation, Russia-Ukraine War, moderating economic growth, and other macroeconomic factors
Chapter 4. Competitive Landscape
4.1. Market Share Analysis
4.1.1. Global Extra Virgin Olive Oil Market Share by Company, 2023
4.1.2. Product Offerings of Leading Extra Virgin Olive Oil Companies
4.2. Market Entropy
4.2.1. New Product Launches in the Industry
4.2.2. Mergers, Acquisitions, Joint ventures, and Partnerships
4.3. Key Strategies and Best Practices
Chapter 5. Global Market Projections: Best, Reference, and Low Case Scenarios
5.1. Growth Analysis- Case Scenario Definitions
5.2. Low Growth Case Scenario Forecasts
5.3. Reference Growth Case Scenario Forecasts
5.4. High Growth Case Scenario Forecasts
Chapter 6. Market Dynamics
6.1. Extra Virgin Olive Oil Market Drivers
6.2. Extra Virgin Olive Oil Market Challenges
6.6. Extra Virgin Olive Oil Market Opportunities
6.4. Extra Virgin Olive Oil Market Trends
Chapter 7. Global Extra Virgin Olive Oil Market Outlook Trends
7.1. Global Extra Virgin Olive Oil Revenue (USD Million) and CAGR (%) by Type (2021-2032)
7.2. Global Extra Virgin Olive Oil Revenue (USD Million) and CAGR (%) by Application (2021-2032)
7.3. Global Extra Virgin Olive Oil Revenue (USD Million) and CAGR (%) by Product (2021-2032)
By Type
Cold Pressed
Flavored
Virgin
Blended
Others
By Application
Cooking
Cosmetics
Pharmaceutical
Fuel
Chapter 8. Global Extra Virgin Olive Oil Regional Analysis and Outlook
8.1. Global Extra Virgin Olive Oil Revenue (USD Million) By Regions (2021- 2032)
8.2. North America Extra Virgin Olive Oil Revenue (USD Million) by Country (2021-2032)
8.2.1. United States Extra Virgin Olive Oil Regional Analysis and Outlook
8.2.2. Canada Extra Virgin Olive Oil Regional Analysis and Outlook
8.2.3. Mexico Extra Virgin Olive Oil Regional Analysis and Outlook
8.3. Europe Extra Virgin Olive Oil Revenue (USD Million), by Country (2021-2032)
8.3.1. Germany Extra Virgin Olive Oil Regional Analysis and Outlook
8.3.2. France Extra Virgin Olive Oil Regional Analysis and Outlook
8.3.3. United Kingdom Extra Virgin Olive Oil Regional Analysis and Outlook
8.3.4. Spain Extra Virgin Olive Oil Regional Analysis and Outlook
8.3.5. Italy Extra Virgin Olive Oil Regional Analysis and Outlook
8.3.6. Russia Extra Virgin Olive Oil Regional Analysis and Outlook
8.3.7. Rest of Europe Extra Virgin Olive Oil Regional Analysis and Outlook
8.4. Asia Pacific Extra Virgin Olive Oil Revenue (USD Million) by Country (2021-2032)
8.4.1. China Extra Virgin Olive Oil Regional Analysis and Outlook
8.4.2. Japan Extra Virgin Olive Oil Regional Analysis and Outlook
8.4.3. India Extra Virgin Olive Oil Regional Analysis and Outlook
8.4.4. South Korea Extra Virgin Olive Oil Regional Analysis and Outlook
8.4.5. Australia Extra Virgin Olive Oil Regional Analysis and Outlook
8.4.6. South East Asia Extra Virgin Olive Oil Regional Analysis and Outlook
8.4.7. Rest of Asia Pacific Extra Virgin Olive Oil Regional Analysis and Outlook
8.5. South America Extra Virgin Olive Oil Revenue (USD Million), by Country (2021-2032)
8.5.1. Brazil Extra Virgin Olive Oil Regional Analysis and Outlook
8.5.2. Argentina Extra Virgin Olive Oil Regional Analysis and Outlook
8.5.3. Rest of South America Extra Virgin Olive Oil Regional Analysis and Outlook
8.6. Middle East and Africa Extra Virgin Olive Oil Revenue (USD Million) by Country (2021-2032)
8.6.1. Middle East Extra Virgin Olive Oil Regional Analysis and Outlook
8.6.2. Africa Extra Virgin Olive Oil Regional Analysis and Outlook
Chapter 9. North America Extra Virgin Olive Oil Analysis and Outlook
9.1. North America Extra Virgin Olive Oil Revenue (USD Million) by Segments (2021-2032)
9.1.1. North America Extra Virgin Olive Oil Revenue (USD Million) by Type (2021-2032)
9.1.2. North America Extra Virgin Olive Oil Revenue (USD Million) by Application (2021-2032)
9.1.3. North America Extra Virgin Olive Oil Revenue (USD Million) by Product (2021-2032)
By Type
Cold Pressed
Flavored
Virgin
Blended
Others
By Application
Cooking
Cosmetics
Pharmaceutical
Fuel
Chapter 10. Europe Extra Virgin Olive Oil Analysis and Outlook
10.1. Europe Extra Virgin Olive Oil Revenue (USD Million), by Segments (USD Million) (2021-2032)
10.1.1. Europe Extra Virgin Olive Oil Revenue (USD Million) by Type (2021-2032)
10.1.2. Europe Extra Virgin Olive Oil Revenue (USD Million) by Application (2021-2032)
10.1.3. Europe Extra Virgin Olive Oil Revenue (USD Million) by Product (2021-2032)
By Type
Cold Pressed
Flavored
Virgin
Blended
Others
By Application
Cooking
Cosmetics
Pharmaceutical
Fuel
Chapter 11. Asia Pacific Extra Virgin Olive Oil Analysis and Outlook
11.1. Asia Pacific Extra Virgin Olive Oil Revenue (USD Million), and Revenue (USD Million) by Segments (2021-2032)
11.1.1. Asia Pacific Extra Virgin Olive Oil Revenue (USD Million) by Type (2021-2032)
11.1.2. Asia Pacific Extra Virgin Olive Oil Revenue (USD Million) by Application (2021-2032)
11.1.3. Asia Pacific Extra Virgin Olive Oil Revenue (USD Million) by Product (2021-2032)
By Type
Cold Pressed
Flavored
Virgin
Blended
Others
By Application
Cooking
Cosmetics
Pharmaceutical
Fuel
Chapter 12. South America Extra Virgin Olive Oil Analysis and Outlook
12.1. South America Extra Virgin Olive Oil Revenue (USD Million), by Segments (2021-2032)
12.1.1. South America Extra Virgin Olive Oil Revenue (USD Million) by Type (2021-2032)
12.1.2. South America Extra Virgin Olive Oil Revenue (USD Million) by Application (2021-2032)
12.1.3. South America Extra Virgin Olive Oil Revenue (USD Million) by Product (2021-2032)
By Type
Cold Pressed
Flavored
Virgin
Blended
Others
By Application
Cooking
Cosmetics
Pharmaceutical
Fuel
Chapter 13. Middle East and Africa Extra Virgin Olive Oil Analysis and Outlook
13.1. Middle East and Africa Extra Virgin Olive Oil Revenue (USD Million), by Segments (2021-2032)
13.1.1. Middle East and Africa Extra Virgin Olive Oil Revenue (USD Million) by Type (2021-2032)
13.1.2. Middle East and Africa Extra Virgin Olive Oil Revenue (USD Million) by Application (2021-2032)
13.1.3. Middle East and Africa Extra Virgin Olive Oil Revenue (USD Million) by Product (2021-2032)
By Type
Cold Pressed
Flavored
Virgin
Blended
Others
By Application
Cooking
Cosmetics
Pharmaceutical
Fuel
Chapter 14. Extra Virgin Olive Oil Company Profiles
14.1 Business Overview
14.2 Product Profiles
14.3 SWOT Profiles
14.5 Recent Developments
14.6 Financial Profile
List of Companies
Agro Sevilla Group
Carapelli Firenze
DEOLEO
Grupo Ybarra Alimentación
SALOV North America
SOVENA
Star Fine Foods - Borges
15. Methodology and Data Sources
15.1 Customization Offerings
15.2 Subscription Services
15.3 Related Reports
15.4 Publisher Expertise
LIST OF TABLES
Table 1 Market Segmentation Analysis
Table 2 Global Extra Virgin Olive Oil Market Share of Leading Companies, 2023
Table 3 Product Offerings of Leading Companies
Table 4 Low Growth Scenario Forecasts
Table 5 Reference Case Growth Scenario
Table 6 High Growth Case Scenario
Table 7 Global Extra Virgin Olive Oil Revenue (USD Million) And CAGR (%) By Type (2021-2032)
Table 8 Global Extra Virgin Olive Oil Revenue (USD Million) And CAGR (%) By Application (2021-2032)
Table 9 Global Extra Virgin Olive Oil Revenue (USD Million) And CAGR (%) By Product (2021-2032)
Table 10 Global Extra Virgin Olive Oil Market Revenue (USD Million) By Regions (2021-2032)
Table 11 Global Extra Virgin Olive Oil Market Share (%) By Regions (2021-2032)
Table 12 North America Extra Virgin Olive Oil Revenue (USD Million) By Country (2021-2032)
Table 13 Europe Extra Virgin Olive Oil Revenue (USD Million) By Country (2021-2032)
Table 14 Asia Pacific Extra Virgin Olive Oil Revenue (USD Million) By Country (2021-2032)
Table 15 South America Extra Virgin Olive Oil Revenue (USD Million) By Country (2021-2032)
Table 16 Middle East and Africa Extra Virgin Olive Oil Revenue (USD Million) By Region (2021-2032)
Table 17 North America Extra Virgin Olive Oil Revenue (USD Million) By Type (2021-2032)
Table 18 North America Extra Virgin Olive Oil Revenue (USD Million) By Application (2021-2032)
Table 19 North America Extra Virgin Olive Oil Revenue (USD Million) By Product (2021-2032)
Table 20 Europe Extra Virgin Olive Oil Revenue (USD Million) By Type (2021-2032)
Table 21 Europe Extra Virgin Olive Oil Revenue (USD Million) By Application (2021-2032)
Table 22 Europe Extra Virgin Olive Oil Revenue (USD Million) By Product (2021-2032)
Table 23 Asia Pacific Extra Virgin Olive Oil Revenue (USD Million) By Type (2021-2032)
Table 24 Asia Pacific Extra Virgin Olive Oil Revenue (USD Million) By Application (2021-2032)
Table 25 Asia Pacific Extra Virgin Olive Oil Revenue (USD Million) By Product (2021-2032)
Table 26 South America Extra Virgin Olive Oil Revenue (USD Million) By Type (2021-2032)
Table 27 South America Extra Virgin Olive Oil Revenue (USD Million) By Application (2021-2032)
Table 28 South America Extra Virgin Olive Oil Revenue (USD Million) By Product (2021-2032)
Table 29 Middle East and Africa Extra Virgin Olive Oil Revenue (USD Million) By Type (2021-2032)
Table 30 Middle East and Africa Extra Virgin Olive Oil Revenue (USD Million) By Application (2021-2032)
Table 31 Middle East and Africa Extra Virgin Olive Oil Revenue (USD Million) By Product (2021-2032)
LIST OF FIGURES
Figure 1. Market Scope
Figure 2. Pricing Forecasts Per Unit, 2023- 2032
Figure 3. Porter’s Five Forces
Figure 4. Global Extra Virgin Olive Oil Market Revenue (USD Million) By Regions (2021-2032)
Figure 5. Global Extra Virgin Olive Oil Market Share (%) By Regions (2023)
Figure 6. North America Extra Virgin Olive Oil Revenue (USD Million) By Country (2021-2032)
Figure 7. United States Extra Virgin Olive Oil Revenue (USD Million) By Country (2021-2032)
Figure 8. Canada Extra Virgin Olive Oil Revenue (USD Million) By Country (2021-2032)
Figure 9. Mexico Extra Virgin Olive Oil Revenue (USD Million) By Country (2021-2032)
Figure 10. Europe Extra Virgin Olive Oil Revenue (USD Million) By Country (2021-2032)
Figure 11. Germany Extra Virgin Olive Oil Revenue (USD Million) By Country (2021-2032)
Figure 12. France Extra Virgin Olive Oil Revenue (USD Million) By Country (2021-2032)
Figure 13. United Kingdom Extra Virgin Olive Oil Revenue (USD Million) By Country (2021-2032)
Figure 14. Spain Extra Virgin Olive Oil Revenue (USD Million) By Country (2021-2032)
Figure 15. Italy Extra Virgin Olive Oil Revenue (USD Million) By Country (2021-2032)
Figure 16. Russia Extra Virgin Olive Oil Revenue (USD Million) By Country (2021-2032)
Figure 17. Rest of Europe Extra Virgin Olive Oil Revenue (USD Million) By Country (2021-2032)
Figure 11. Asia Pacific Extra Virgin Olive Oil Revenue (USD Million) By Country (2021-2032)
Figure 12. China Extra Virgin Olive Oil Revenue (USD Million) By Country (2021-2032)
Figure 13. Japan Extra Virgin Olive Oil Revenue (USD Million) By Country (2021-2032)
Figure 14. India Extra Virgin Olive Oil Revenue (USD Million) By Country (2021-2032)
Figure 15. South Korea Extra Virgin Olive Oil Revenue (USD Million) By Country (2021-2032)
Figure 16. Australia Extra Virgin Olive Oil Revenue (USD Million) By Country (2021-2032)
Figure 17. South East Asia Extra Virgin Olive Oil Revenue (USD Million) By Country (2021-2032)
Figure 18. South America Extra Virgin Olive Oil Revenue (USD Million) By Country (2021-2032)
Figure 19. Brazil Extra Virgin Olive Oil Revenue (USD Million) By Country (2021-2032)
Figure 20. Argentina Extra Virgin Olive Oil Revenue (USD Million) By Country (2021-2032)
Figure 21. Rest of Asia Pacific Extra Virgin Olive Oil Revenue (USD Million) By Country (2021-2032)
Figure 22. Middle East and Africa Extra Virgin Olive Oil Revenue (USD Million) By Region (2021-2032)
Figure 23. Saudi Arabia Extra Virgin Olive Oil Revenue (USD Million) By Region (2021-2032)
Figure 24. The UAE Extra Virgin Olive Oil Revenue (USD Million) By Region (2021-2032)
Figure 25. Rest of Middle East Extra Virgin Olive Oil Revenue (USD Million) By Region (2021-2032)
Figure 26. South Africa Extra Virgin Olive Oil Revenue (USD Million) By Region (2021-2032)
Figure 27. Africa Extra Virgin Olive Oil Revenue (USD Million) By Region (2021-2032)
Figure 28. North America Extra Virgin Olive Oil Revenue (USD Million) By Type (2021-2032)
Figure 29. North America Extra Virgin Olive Oil Revenue (USD Million) By Application (2021-2032)
Figure 30. North America Extra Virgin Olive Oil Revenue (USD Million) By Product (2021-2032)
Figure 31. Europe Extra Virgin Olive Oil Revenue (USD Million) By Type (2021-2032)
Figure 32. Europe Extra Virgin Olive Oil Revenue (USD Million) By Application (2021-2032)
Figure 33. Europe Extra Virgin Olive Oil Revenue (USD Million) By Product (2021-2032)
Figure 34. Asia Pacific Extra Virgin Olive Oil Revenue (USD Million) By Type (2021-2032)
Figure 35. Asia Pacific Extra Virgin Olive Oil Revenue (USD Million) By Application (2021-2032)
Figure 36. Asia Pacific Extra Virgin Olive Oil Revenue (USD Million) By Product (2021-2032)
Figure 37. South America Extra Virgin Olive Oil Revenue (USD Million) By Type (2021-2032)
Figure 38. South America Extra Virgin Olive Oil Revenue (USD Million) By Application (2021-2032)
Figure 39. South America Extra Virgin Olive Oil Revenue (USD Million) By Product (2021-2032)
Figure 40. Middle East and Africa Extra Virgin Olive Oil Revenue (USD Million) By Type (2021-2032)
Figure 41. Middle East and Africa Extra Virgin Olive Oil Revenue (USD Million) By Application (2021-2032)
Figure 42. Middle East and Africa Extra Virgin Olive Oil Revenue (USD Million) By Product (2021-2032)
By Type
Cold Pressed
Flavored
Virgin
Blended
Others
By Application
Cooking
Cosmetics
Pharmaceutical
Fuel
Countries Analyzed
North America (US, Canada, Mexico)
Europe (Germany, UK, France, Spain, Italy, Russia, Rest of Europe)
Asia Pacific (China, India, Japan, South Korea, Australia, South East Asia, Rest of Asia)
South America (Brazil, Argentina, Rest of South America)
Middle East and Africa (Saudi Arabia, UAE, Rest of Middle East, South Africa, Egypt, Rest of Africa)
