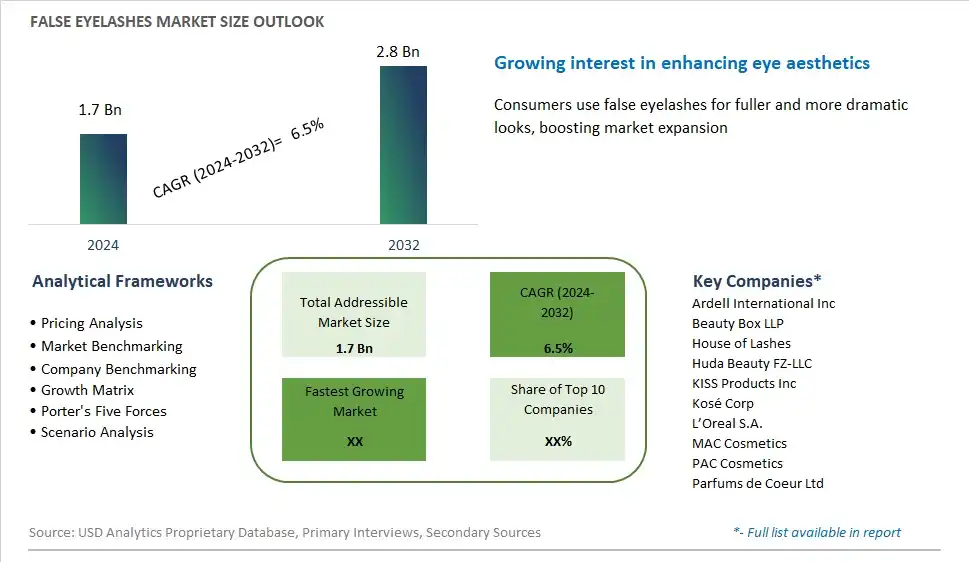
Global False Eyelashes Market Size is valued at $1.7 Billion in 2024 and is forecast to register a growth rate (CAGR) of 6.5% to reach $2.8 Billion by 2032.
The global False Eyelashes Market Comprehensive Study analyzes and forecasts the market size across 6 regions and 24 countries for diverse segments -By Product (Strips, Cluster/Accent, Individual, Others), By Type (Natural, Synthetic), By Distribution Channel (Online, Convenience Stores, Hypermarkets, Others)
An Introduction to False Eyelashes Market
The false eyelashes market continues to thrive in 2024, propelled by the influence of social media, celebrity endorsements, and evolving beauty trends. False eyelashes have become a staple in makeup routines, offering instant glamour and enhancing the appearance of eyes. This market is characterized by a diverse range of products catering to different styles, lengths, and materials, including synthetic fibers, mink, and silk. Consumers are increasingly seeking customizable options, driving innovation in adhesive technologies and application methods. Additionally, the rise of virtual makeup try-on tools and tutorials on digital platforms is amplifying consumer engagement and driving sales. As beauty standards evolve and individual expression gains prominence, false eyelashes remain a dynamic segment within the cosmetics industry.
False Eyelashes Competitive Landscape
The market report analyses the leading companies in the industry including Ardell International Inc, Beauty Box LLP, House of Lashes, Huda Beauty FZ-LLC, KISS Products Inc, Kosé Corp, L’Oreal S.A., MAC Cosmetics, PAC Cosmetics, Parfums de Coeur Ltd, and Others.
False Eyelashes Market Dynamics
False Eyelashes Market Trend: Emphasis on Dramatic and Customizable Eye Looks
A significant trend in the false eyelashes market is the emphasis on dramatic and customizable eye looks. Consumers are increasingly seeking false eyelashes that allow them to achieve bold and glamorous eye makeup looks for various occasions, including parties, special events, and everyday wear. This trend is driven by factors such as the influence of social media and celebrity culture in promoting dramatic eye makeup trends, the desire for self-expression and creativity in makeup, and the availability of a wide range of false eyelash styles, lengths, and densities. As a result, there is a growing demand for false eyelashes that offer dramatic volume, length, and intensity, allowing consumers to customize their eye looks to suit their personal style preferences and aesthetic goals.
Market Driver: Influence of Beauty Influencers and Makeup Artists
A significant driver behind the demand for false eyelashes is the influence of beauty influencers and makeup artists in promoting and popularizing false eyelash trends. With the rise of social media platforms such as Instagram, YouTube, and TikTok, beauty influencers and makeup artists have become powerful influencers in shaping consumer preferences and trends in the beauty industry. This driver is fueled by factors such as the creation of makeup tutorials, product reviews, and eye makeup inspiration by beauty influencers, as well as collaborations between influencers and beauty brands to develop and promote false eyelash collections. Additionally, the endorsement of false eyelashes by celebrities and influencers further amplifies their popularity and drives consumer interest and purchase intent. As consumers aspire to recreate the eye looks showcased by their favorite influencers and celebrities, the demand for false eyelashes continues to grow, making them a staple in many makeup routines worldwide.
Market Opportunity: Expansion into Sustainable and Eco-Friendly Materials
An opportunity for the false eyelashes market lies in expansion into sustainable and eco-friendly materials to meet the growing demand for ethical and environmentally conscious beauty products. Manufacturers can explore opportunities to develop false eyelashes made from sustainable materials such as synthetic fibers, recycled plastics, or cruelty-free mink alternatives that minimize environmental impact and promote animal welfare. Additionally, incorporating eco-friendly packaging options such as recyclable materials or biodegradable packaging aligns with consumer preferences for sustainable beauty products. Furthermore, offering false eyelashes that are reusable, durable, and easy to clean encourages sustainability and reduces waste, appealing to environmentally conscious consumers seeking eco-friendly alternatives. By embracing sustainability in materials and packaging, manufacturers can differentiate their false eyelash products, attract environmentally conscious consumers, and capitalize on opportunities for growth and market expansion in the competitive beauty industry.
False Eyelashes Market Share Analysis: Strips held the dominant market share in 2024
In the False Eyelashes Market segmented by product, the strips segment is the largest, driven by its widespread popularity and ease of use among consumers. False eyelash strips offer a quick and convenient way to enhance the length, volume, and glamour of natural lashes. They come in a variety of styles, ranging from natural-looking to dramatic, catering to different preferences and occasions. Additionally, false eyelash strips are widely available in beauty stores, drugstores, and online retailers, making them accessible to a broad consumer base. Their affordability and reusability also contribute to their dominance in the False Eyelashes Market, as they offer a cost-effective option for individuals seeking to elevate their eye makeup look without the commitment of eyelash extensions or individual lashes. As consumers continue to embrace false eyelashes as a staple in their beauty routines, the strips segment maintains its prominence in the market.
False Eyelashes Market Share Analysis: Synthetic market is poised to register the fastest growth rae over the forecast period to 2032
In the False Eyelashes Market segmented by constituent, the synthetic segment is experiencing rapid growth, driven by several key factors. Synthetic false eyelashes offer a wide range of styles, lengths, and volumes, mimicking the appearance of natural lashes while providing added drama and intensity to eye makeup looks. They are often more affordable than natural false eyelashes, making them accessible to a broader consumer base. Additionally, synthetic false eyelashes are cruelty-free and vegan-friendly, appealing to environmentally conscious consumers who prefer alternatives to animal-derived products. Further, advancements in synthetic fiber technology have led to the development of high-quality, lightweight materials that closely resemble the texture and appearance of natural lashes. As consumers seek affordable, versatile, and cruelty-free beauty options, the synthetic segment of the False Eyelashes Market is poised for continued rapid growth in the foreseeable future.
False Eyelashes Market Share Analysis: Online held the dominant market share in 2024
In the False Eyelashes Market segmented by distribution channel, the online segment is the largest, driven by its convenience, accessibility, and wide variety of product offerings. Online platforms provide consumers with the flexibility to browse through an extensive range of false eyelashes from various brands, styles, and price points, all from the comfort of their homes. Additionally, the rise of e-commerce platforms and digital marketing efforts by beauty brands have increased the visibility and accessibility of false eyelashes to a global audience. Further, online retailers often offer exclusive deals, discounts, and promotions, enticing consumers to make their purchases online. As consumers increasingly turn to online shopping for their beauty needs, the online distribution channel continues to dominate the False Eyelashes Market, making it the largest segment in terms of distribution.
False Eyelashes Market Segmentation
By Product
Strips
Cluster/Accent
Individual
Others
By Constituent
Natural
Synthetic
By Distribution Channel
Online
Convenience Stores
Hypermarkets
Others
Countries Analyzed
North America (US, Canada, Mexico)
Europe (Germany, UK, France, Spain, Italy, Russia, Rest of Europe)
Asia Pacific (China, India, Japan, South Korea, Australia, South East Asia, Rest of Asia)
South America (Brazil, Argentina, Rest of South America)
Middle East and Africa (Saudi Arabia, UAE, Rest of Middle East, South Africa, Egypt, Rest of Africa)
False Eyelashes Companies Profiled in the Study
Ardell International Inc
Beauty Box LLP
House of Lashes
Huda Beauty FZ-LLC
KISS Products Inc
Kosé Corp
L’Oreal S.A.
MAC Cosmetics
PAC Cosmetics
Parfums de Coeur Ltd
*- List Not Exhaustive
Chapter 1. TABLE OF CONTENTS
Chapter 2. Introduction to False Eyelashes Market
2.1. Market Overview
2.2. Key Statistics and Report Highlights
2.3. Scope of the Comprehensive Study
2.3.1. Market Definition
2.3.2 Countries and Regions Covered
2.3.3 Research Objective
2.3.4 Units, Currency, and Conversions
2.3.5 Industry Value Chain
2.4. Key Market Segments
2.5. Key Companies
2.6. Study Period
Chapter 3. Strategic Analysis Review
3.1. False Eyelashes Pricing Analysis and Forecast
3.2. Porter’s Five Forces
3.3. Market Ecosystem
3.4. SWOT Analysis
3.5. Regulatory Scenario
3.3. Effects of Inflation, Russia-Ukraine War, moderating economic growth, and other macroeconomic factors
Chapter 4. Competitive Landscape
4.1. Market Share Analysis
4.1.1. Global False Eyelashes Market Share by Company, 2023
4.1.2. Product Offerings of Leading False Eyelashes Companies
4.2. Market Entropy
4.2.1. New Product Launches in the Industry
4.2.2. Mergers, Acquisitions, Joint ventures, and Partnerships
4.3. Key Strategies and Best Practices
Chapter 5. Global Market Projections: Best, Reference, and Low Case Scenarios
5.1. Growth Analysis- Case Scenario Definitions
5.2. Low Growth Case Scenario Forecasts
5.3. Reference Growth Case Scenario Forecasts
5.4. High Growth Case Scenario Forecasts
Chapter 6. Market Dynamics
6.1. False Eyelashes Market Drivers
6.2. False Eyelashes Market Challenges
6.6. False Eyelashes Market Opportunities
6.4. False Eyelashes Market Trends
Chapter 7. Global False Eyelashes Market Outlook Trends
7.1. Global False Eyelashes Revenue (USD Million) and CAGR (%) by Type (2021-2032)
7.2. Global False Eyelashes Revenue (USD Million) and CAGR (%) by Application (2021-2032)
7.3. Global False Eyelashes Revenue (USD Million) and CAGR (%) by Product (2021-2032)
By Product
Strips
Cluster/Accent
Individual
Others
By Constituent
Natural
Synthetic
By Distribution Channel
Online
Convenience Stores
Hypermarkets
Others
Chapter 8. Global False Eyelashes Regional Analysis and Outlook
8.1. Global False Eyelashes Revenue (USD Million) By Regions (2021- 2032)
8.2. North America False Eyelashes Revenue (USD Million) by Country (2021-2032)
8.2.1. United States False Eyelashes Regional Analysis and Outlook
8.2.2. Canada False Eyelashes Regional Analysis and Outlook
8.2.3. Mexico False Eyelashes Regional Analysis and Outlook
8.3. Europe False Eyelashes Revenue (USD Million), by Country (2021-2032)
8.3.1. Germany False Eyelashes Regional Analysis and Outlook
8.3.2. France False Eyelashes Regional Analysis and Outlook
8.3.3. United Kingdom False Eyelashes Regional Analysis and Outlook
8.3.4. Spain False Eyelashes Regional Analysis and Outlook
8.3.5. Italy False Eyelashes Regional Analysis and Outlook
8.3.6. Russia False Eyelashes Regional Analysis and Outlook
8.3.7. Rest of Europe False Eyelashes Regional Analysis and Outlook
8.4. Asia Pacific False Eyelashes Revenue (USD Million) by Country (2021-2032)
8.4.1. China False Eyelashes Regional Analysis and Outlook
8.4.2. Japan False Eyelashes Regional Analysis and Outlook
8.4.3. India False Eyelashes Regional Analysis and Outlook
8.4.4. South Korea False Eyelashes Regional Analysis and Outlook
8.4.5. Australia False Eyelashes Regional Analysis and Outlook
8.4.6. South East Asia False Eyelashes Regional Analysis and Outlook
8.4.7. Rest of Asia Pacific False Eyelashes Regional Analysis and Outlook
8.5. South America False Eyelashes Revenue (USD Million), by Country (2021-2032)
8.5.1. Brazil False Eyelashes Regional Analysis and Outlook
8.5.2. Argentina False Eyelashes Regional Analysis and Outlook
8.5.3. Rest of South America False Eyelashes Regional Analysis and Outlook
8.6. Middle East and Africa False Eyelashes Revenue (USD Million) by Country (2021-2032)
8.6.1. Middle East False Eyelashes Regional Analysis and Outlook
8.6.2. Africa False Eyelashes Regional Analysis and Outlook
Chapter 9. North America False Eyelashes Analysis and Outlook
9.1. North America False Eyelashes Revenue (USD Million) by Segments (2021-2032)
9.1.1. North America False Eyelashes Revenue (USD Million) by Type (2021-2032)
9.1.2. North America False Eyelashes Revenue (USD Million) by Application (2021-2032)
9.1.3. North America False Eyelashes Revenue (USD Million) by Product (2021-2032)
By Product
Strips
Cluster/Accent
Individual
Others
By Constituent
Natural
Synthetic
By Distribution Channel
Online
Convenience Stores
Hypermarkets
Others
Chapter 10. Europe False Eyelashes Analysis and Outlook
10.1. Europe False Eyelashes Revenue (USD Million), by Segments (USD Million) (2021-2032)
10.1.1. Europe False Eyelashes Revenue (USD Million) by Type (2021-2032)
10.1.2. Europe False Eyelashes Revenue (USD Million) by Application (2021-2032)
10.1.3. Europe False Eyelashes Revenue (USD Million) by Product (2021-2032)
By Product
Strips
Cluster/Accent
Individual
Others
By Constituent
Natural
Synthetic
By Distribution Channel
Online
Convenience Stores
Hypermarkets
Others
Chapter 11. Asia Pacific False Eyelashes Analysis and Outlook
11.1. Asia Pacific False Eyelashes Revenue (USD Million), and Revenue (USD Million) by Segments (2021-2032)
11.1.1. Asia Pacific False Eyelashes Revenue (USD Million) by Type (2021-2032)
11.1.2. Asia Pacific False Eyelashes Revenue (USD Million) by Application (2021-2032)
11.1.3. Asia Pacific False Eyelashes Revenue (USD Million) by Product (2021-2032)
By Product
Strips
Cluster/Accent
Individual
Others
By Constituent
Natural
Synthetic
By Distribution Channel
Online
Convenience Stores
Hypermarkets
Others
Chapter 12. South America False Eyelashes Analysis and Outlook
12.1. South America False Eyelashes Revenue (USD Million), by Segments (2021-2032)
12.1.1. South America False Eyelashes Revenue (USD Million) by Type (2021-2032)
12.1.2. South America False Eyelashes Revenue (USD Million) by Application (2021-2032)
12.1.3. South America False Eyelashes Revenue (USD Million) by Product (2021-2032)
By Product
Strips
Cluster/Accent
Individual
Others
By Constituent
Natural
Synthetic
By Distribution Channel
Online
Convenience Stores
Hypermarkets
Others
Chapter 13. Middle East and Africa False Eyelashes Analysis and Outlook
13.1. Middle East and Africa False Eyelashes Revenue (USD Million), by Segments (2021-2032)
13.1.1. Middle East and Africa False Eyelashes Revenue (USD Million) by Type (2021-2032)
13.1.2. Middle East and Africa False Eyelashes Revenue (USD Million) by Application (2021-2032)
13.1.3. Middle East and Africa False Eyelashes Revenue (USD Million) by Product (2021-2032)
By Product
Strips
Cluster/Accent
Individual
Others
By Constituent
Natural
Synthetic
By Distribution Channel
Online
Convenience Stores
Hypermarkets
Others
Chapter 14. False Eyelashes Company Profiles
14.1 Business Overview
14.2 Product Profiles
14.3 SWOT Profiles
14.5 Recent Developments
14.6 Financial Profile
List of Companies
Ardell International Inc
Beauty Box LLP
House of Lashes
Huda Beauty FZ-LLC
KISS Products Inc
Kosé Corp
L’Oreal S.A.
MAC Cosmetics
PAC Cosmetics
Parfums de Coeur Ltd
15. Methodology and Data Sources
15.1 Customization Offerings
15.2 Subscription Services
15.3 Related Reports
15.4 Publisher Expertise
LIST OF TABLES
Table 1 Market Segmentation Analysis
Table 2 Global False Eyelashes Market Share of Leading Companies, 2023
Table 3 Product Offerings of Leading Companies
Table 4 Low Growth Scenario Forecasts
Table 5 Reference Case Growth Scenario
Table 6 High Growth Case Scenario
Table 7 Global False Eyelashes Revenue (USD Million) And CAGR (%) By Type (2021-2032)
Table 8 Global False Eyelashes Revenue (USD Million) And CAGR (%) By Application (2021-2032)
Table 9 Global False Eyelashes Revenue (USD Million) And CAGR (%) By Product (2021-2032)
Table 10 Global False Eyelashes Market Revenue (USD Million) By Regions (2021-2032)
Table 11 Global False Eyelashes Market Share (%) By Regions (2021-2032)
Table 12 North America False Eyelashes Revenue (USD Million) By Country (2021-2032)
Table 13 Europe False Eyelashes Revenue (USD Million) By Country (2021-2032)
Table 14 Asia Pacific False Eyelashes Revenue (USD Million) By Country (2021-2032)
Table 15 South America False Eyelashes Revenue (USD Million) By Country (2021-2032)
Table 16 Middle East and Africa False Eyelashes Revenue (USD Million) By Region (2021-2032)
Table 17 North America False Eyelashes Revenue (USD Million) By Type (2021-2032)
Table 18 North America False Eyelashes Revenue (USD Million) By Application (2021-2032)
Table 19 North America False Eyelashes Revenue (USD Million) By Product (2021-2032)
Table 20 Europe False Eyelashes Revenue (USD Million) By Type (2021-2032)
Table 21 Europe False Eyelashes Revenue (USD Million) By Application (2021-2032)
Table 22 Europe False Eyelashes Revenue (USD Million) By Product (2021-2032)
Table 23 Asia Pacific False Eyelashes Revenue (USD Million) By Type (2021-2032)
Table 24 Asia Pacific False Eyelashes Revenue (USD Million) By Application (2021-2032)
Table 25 Asia Pacific False Eyelashes Revenue (USD Million) By Product (2021-2032)
Table 26 South America False Eyelashes Revenue (USD Million) By Type (2021-2032)
Table 27 South America False Eyelashes Revenue (USD Million) By Application (2021-2032)
Table 28 South America False Eyelashes Revenue (USD Million) By Product (2021-2032)
Table 29 Middle East and Africa False Eyelashes Revenue (USD Million) By Type (2021-2032)
Table 30 Middle East and Africa False Eyelashes Revenue (USD Million) By Application (2021-2032)
Table 31 Middle East and Africa False Eyelashes Revenue (USD Million) By Product (2021-2032)
LIST OF FIGURES
Figure 1. Market Scope
Figure 2. Pricing Forecasts Per Unit, 2023- 2032
Figure 3. Porter’s Five Forces
Figure 4. Global False Eyelashes Market Revenue (USD Million) By Regions (2021-2032)
Figure 5. Global False Eyelashes Market Share (%) By Regions (2023)
Figure 6. North America False Eyelashes Revenue (USD Million) By Country (2021-2032)
Figure 7. United States False Eyelashes Revenue (USD Million) By Country (2021-2032)
Figure 8. Canada False Eyelashes Revenue (USD Million) By Country (2021-2032)
Figure 9. Mexico False Eyelashes Revenue (USD Million) By Country (2021-2032)
Figure 10. Europe False Eyelashes Revenue (USD Million) By Country (2021-2032)
Figure 11. Germany False Eyelashes Revenue (USD Million) By Country (2021-2032)
Figure 12. France False Eyelashes Revenue (USD Million) By Country (2021-2032)
Figure 13. United Kingdom False Eyelashes Revenue (USD Million) By Country (2021-2032)
Figure 14. Spain False Eyelashes Revenue (USD Million) By Country (2021-2032)
Figure 15. Italy False Eyelashes Revenue (USD Million) By Country (2021-2032)
Figure 16. Russia False Eyelashes Revenue (USD Million) By Country (2021-2032)
Figure 17. Rest of Europe False Eyelashes Revenue (USD Million) By Country (2021-2032)
Figure 11. Asia Pacific False Eyelashes Revenue (USD Million) By Country (2021-2032)
Figure 12. China False Eyelashes Revenue (USD Million) By Country (2021-2032)
Figure 13. Japan False Eyelashes Revenue (USD Million) By Country (2021-2032)
Figure 14. India False Eyelashes Revenue (USD Million) By Country (2021-2032)
Figure 15. South Korea False Eyelashes Revenue (USD Million) By Country (2021-2032)
Figure 16. Australia False Eyelashes Revenue (USD Million) By Country (2021-2032)
Figure 17. South East Asia False Eyelashes Revenue (USD Million) By Country (2021-2032)
Figure 18. South America False Eyelashes Revenue (USD Million) By Country (2021-2032)
Figure 19. Brazil False Eyelashes Revenue (USD Million) By Country (2021-2032)
Figure 20. Argentina False Eyelashes Revenue (USD Million) By Country (2021-2032)
Figure 21. Rest of Asia Pacific False Eyelashes Revenue (USD Million) By Country (2021-2032)
Figure 22. Middle East and Africa False Eyelashes Revenue (USD Million) By Region (2021-2032)
Figure 23. Saudi Arabia False Eyelashes Revenue (USD Million) By Region (2021-2032)
Figure 24. The UAE False Eyelashes Revenue (USD Million) By Region (2021-2032)
Figure 25. Rest of Middle East False Eyelashes Revenue (USD Million) By Region (2021-2032)
Figure 26. South Africa False Eyelashes Revenue (USD Million) By Region (2021-2032)
Figure 27. Africa False Eyelashes Revenue (USD Million) By Region (2021-2032)
Figure 28. North America False Eyelashes Revenue (USD Million) By Type (2021-2032)
Figure 29. North America False Eyelashes Revenue (USD Million) By Application (2021-2032)
Figure 30. North America False Eyelashes Revenue (USD Million) By Product (2021-2032)
Figure 31. Europe False Eyelashes Revenue (USD Million) By Type (2021-2032)
Figure 32. Europe False Eyelashes Revenue (USD Million) By Application (2021-2032)
Figure 33. Europe False Eyelashes Revenue (USD Million) By Product (2021-2032)
Figure 34. Asia Pacific False Eyelashes Revenue (USD Million) By Type (2021-2032)
Figure 35. Asia Pacific False Eyelashes Revenue (USD Million) By Application (2021-2032)
Figure 36. Asia Pacific False Eyelashes Revenue (USD Million) By Product (2021-2032)
Figure 37. South America False Eyelashes Revenue (USD Million) By Type (2021-2032)
Figure 38. South America False Eyelashes Revenue (USD Million) By Application (2021-2032)
Figure 39. South America False Eyelashes Revenue (USD Million) By Product (2021-2032)
Figure 40. Middle East and Africa False Eyelashes Revenue (USD Million) By Type (2021-2032)
Figure 41. Middle East and Africa False Eyelashes Revenue (USD Million) By Application (2021-2032)
Figure 42. Middle East and Africa False Eyelashes Revenue (USD Million) By Product (2021-2032)
By Product
Strips
Cluster/Accent
Individual
Others
By Constituent
Natural
Synthetic
By Distribution Channel
Online
Convenience Stores
Hypermarkets
Others
Countries Analyzed
North America (US, Canada, Mexico)
Europe (Germany, UK, France, Spain, Italy, Russia, Rest of Europe)
Asia Pacific (China, India, Japan, South Korea, Australia, South East Asia, Rest of Asia)
South America (Brazil, Argentina, Rest of South America)
Middle East and Africa (Saudi Arabia, UAE, Rest of Middle East, South Africa, Egypt, Rest of Africa)
