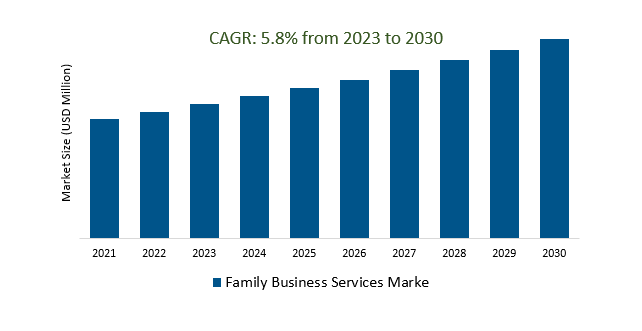
The Global Family Business Services Market Size is estimated to register 5.8% growth over the forecast period from 2023 to 2030.
The market growth is driven by increasing Succession planning remains a critical aspect for family businesses to ensure a smooth transfer of leadership and ownership. Family business services often assist in developing and implementing succession plans. Leading Companies focusing on Generational Transitions, Increasing Complexity, Digital Transformation, Cross-Border Expansion, Niche Market Focus, Family Office Services, Networking and Knowledge Sharing, and others to boost market shares in the industry.
Market Overview
The Family Business Services Market offers specialized advisory and support services to family-owned enterprises, addressing their unique challenges, including succession planning, governance, financial management, and more. Key drivers of this market include generational transitions, increased complexity, digital transformation, sustainability, global expansion, and wealth management. As family businesses continue to recognize the need for tailored solutions, the market is poised for growth, with services spanning various areas, from crisis management to sustainability and ESG integration, enabling these enterprises to thrive while preserving their legacies.
Market Dynamics
Market Trends- Tax planning is essential for family businesses of all sizes, as it can help them reduce their tax liability and ensure compliance with all applicable tax laws.
The Family Business Services Market plays a pivotal role in aiding family-owned enterprises, regardless of their scale, in navigating the complex landscape of tax planning. Tax planning is an indispensable facet of financial management for these businesses, as it enables them to strategically minimize their tax burden while adhering to the intricate web of tax regulations and laws. Effective tax planning involves a careful assessment of a family business's financial structure, assets, and income streams, with the goal of optimizing tax efficiency. This can encompass a range of strategies, such as the creation of tax-efficient structures, exploiting tax credits and deductions, and ensuring timely compliance with all tax obligations.
Market Driver- The demand for financial planning and wealth management services is growing among family businesses.
the Family Business Services Market, there is a discernible surge in the demand for financial planning and wealth management services among family-owned enterprises. This trend can be attributed to several factors, including the increasing complexity of financial markets, evolving tax laws, and the desire of family businesses to safeguard their wealth for future generations. As family businesses often possess unique challenges and opportunities, there is a growing recognition of the need for specialized financial expertise. Services tailored to their specific needs can include succession planning, investment strategies, risk management, and estate planning the services, family businesses are not only better equipped to navigate financial complexities but also to capitalize on growth opportunities while preserving their family legacy and wealth,
Market Opportunity- The introduction of family office services is providing family businesses with access to a wide range of wealth management and other services
Family office services have revolutionized the Family Business Services Market, offering comprehensive wealth management and specialized solutions for family-owned enterprises. These services cover investment management, tax and estate planning, risk management, and more. Family offices provide highly personalized and holistic approaches that align with a family's unique goals and values, ensuring financial success, generational wealth preservation, and legacy continuity in complex financial markets and regulatory environments. This trend underscores the critical role of family office services in supporting the long-term prosperity of family businesses.
Market Share Analysis-Family-owned business The family Business Services Market will register the fastest growth
The Global Family Business Services Market is analyzed across Family-owned businesses, Family-owned and managed businesses, LED businesses, and others. The family-owned business is poised to register the fastest growth. Family-owned businesses are a crucial focus of the Family Business Services Market, where specialized offerings cater to their unique dynamics. These services encompass succession planning, tax optimization, governance, and conflict resolution, aiming to balance business operations with family values and wealth preservation. As integral contributors to the global economy, family-owned businesses rely on the services provided by the market to secure their long-term success and sustainability.
Market Share Analysis- SMEs held a significant market share in 2023
The Global Family Business Services Market is analyzed across various applications including Home Use, Pet store, Animal Management Station, and others. Of these, SMEs held a significant market share in 2023. Small and Medium-sized Enterprises (SMEs) are a vital component of the Family Business Services Market, benefiting from specialized support for succession planning, financing, compliance, and growth strategies. These services are essential for SMEs' success, continuity, and competitiveness in the market, given their significant presence among family-owned businesses.
Family Business Services Market Segmentation
By Type
- Family-owned business
- Family-owned and managed business
- LED business
- Others
By Organization size
By Services
- Wealth
- Governance
- Business continuity
- Strategic management
- Digitization of business
- Advisory services
- Others
By Region
- North America (United States, Canada, Mexico)
- Europe (Germany, France, United Kingdom, Spain, Italy, Others)
- Asia Pacific (China, India, Japan, South Korea, Australia, Others)
- Latin America (Brazil, Argentina, Others)
- Middle East and Africa (Saudi Arabia, UAE, Kuwait, Other Middle East, South Africa, Nigeria, Other Africa)
Family Business Services Market Companies
- McKinsey (United States)
- Deloitte (United Kingdom)
- EY (United Kingdom)
- Mazars (France)
- KPMG (Netherlands)
- Egon Zehnder (Switzerland)
- BCG (United States)
- Accenture (Ireland)
- Grant Thronton (United States)
- PWC (United Kingdom)
*List not exhaustive
Family Business Services Market Outlook 2023
1 Market Overview
1.1 Introduction to the Family Business Services Market
1.2 Scope of the Study
1.3 Research Objective
1.3.1 Key Market Scope and Segments
1.3.2 Players Covered
1.3.3 Years Considered
2 Executive Summary
2.1 2023 Family Business Services Industry- Market Statistics
3 Market Dynamics
3.1 Market Drivers
3.2 Market Challenges
3.3 Market Opportunities
3.4 Market Trends
4 Market Factor Analysis
4.1 Porter’s Five Forces
4.2 Market Entropy
4.2.1 Global Family Business Services Market Companies with Area Served
4.2.2 Products Offerings Global Family Business Services Market
5 COVID-19 Impact Analysis and Outlook Scenarios
5.1.1 Covid-19 Impact Analysis
5.1.2 Post-COVID-19 Scenario- Low Growth Case
5.1.3 Post-COVID-19 Scenario- Reference Growth Case
5.1.4 Post-COVID-19 Scenario- Low Growth Case
6 Global Family Business Services Market Trends
6.1 Global Family Business Services Revenue (USD Million) and CAGR (%) by Type (2018-2030)
6.2 Global Family Business Services Revenue (USD Million) and CAGR (%) by Applications (2018-2030)
6.3 Global Family Business Services Revenue (USD Million) and CAGR (%) by Regions (2018-2030)
7 Global Family Business Services Market Revenue (USD Million) by Type, and Applications (2018-2022)
7.1 Global Family Business Services Revenue (USD Million) by Type (2018-2022)
7.1.1 Global Family Business Services Revenue (USD Million), Market Share (%) by Type (2018-2022)
7.2 Global Family Business Services Revenue (USD Million) by Applications (2018-2022)
7.2.1 Global Family Business Services Revenue (USD Million), Market Share (%) by Applications (2018-2022)
8 Global Family Business Services Development Regional Status and Outlook
8.1 Global Family Business Services Revenue (USD Million) By Regions (2018-2022)
8.2 North America Family Business Services Revenue (USD Million) by Type, and Application (2018-2022)
8.2.1 North America Family Business Services Revenue (USD Million) by Country (2018-2022)
8.2.2 North America Family Business Services Revenue (USD Million) by Type (2018-2022)
8.2.3 North America Family Business Services Revenue (USD Million) by Applications (2018-2022)
8.3 Europe Family Business Services Revenue (USD Million), by Type, and Applications (USD Million) (2018-2022)
8.3.1 Europe Family Business Services Revenue (USD Million), by Country (2018-2022)
8.3.2 Europe Family Business Services Revenue (USD Million) by Type (2018-2022)
8.3.3 Europe Family Business Services Revenue (USD Million) by Applications (2018-2022)
8.4 Asia Pacific Family Business Services Revenue (USD Million), and Revenue (USD Million) by Type, and Applications (2018-2022)
8.4.1 Asia Pacific Family Business Services Revenue (USD Million) by Country (2018-2022)
8.4.2 Asia Pacific Family Business Services Revenue (USD Million) by Type (2018-2022)
8.4.3 Asia Pacific Family Business Services Revenue (USD Million) by Applications (2018-2022)
8.5 South America Family Business Services Revenue (USD Million), by Type, and Applications (2018-2022)
8.5.1 South America Family Business Services Revenue (USD Million), by Country (2018-2022)
8.5.2 South America Family Business Services Revenue (USD Million) by Type (2018-2022)
8.5.3 South America Family Business Services Revenue (USD Million) by Applications (2018-2022)
8.6 Middle East and Africa Family Business Services Revenue (USD Million), by Type, Technology, Application, Thickness (2018-2022)
8.6.1 Middle East and Africa Family Business Services Revenue (USD Million) by Country (2018-2022)
8.6.2 Middle East and Africa Family Business Services Revenue (USD Million) by Type (2018-2022)
8.6.3 Middle East and Africa Family Business Services Revenue (USD Million) by Applications (2018-2022)
9 Company Profiles
10 Global Family Business Services Market Revenue (USD Million), by Type, and Applications (2023-2030)
10.1 Global Family Business Services Revenue (USD Million) and Market Share (%) by Type (2023-2030)
10.1.1 Global Family Business Services Revenue (USD Million), and Market Share (%) by Type (2023-2030)
10.2 Global Family Business Services Revenue (USD Million) and Market Share (%) by Applications (2023-2030)
10.2.1 Global Family Business Services Revenue (USD Million), and Market Share (%) by Applications (2023-2030)
11 Global Family Business Services Development Regional Status and Outlook Forecast
11.1 Global Family Business Services Revenue (USD Million) By Regions (2023-2030)
11.2 North America Family Business Services Revenue (USD Million) by Type, and Applications (2023-2030)
11.2.1 North America Family Business Services Revenue (USD) Million by Country (2023-2030)
11.2.2 North America Family Business Services Revenue (USD Million), by Type (2023-2030)
11.2.3 North America Family Business Services Revenue (USD Million), Market Share (%) by Applications (2023-2030)
11.3 Europe Family Business Services Revenue (USD Million), by Type, and Applications (2023-2030)
11.3.1 Europe Family Business Services Revenue (USD Million), by Country (2023-2030)
11.3.2 Europe Family Business Services Revenue (USD Million), by Type (2023-2030)
11.3.3 Europe Family Business Services Revenue (USD Million), by Applications (2023-2030)
11.4 Asia Pacific Family Business Services Revenue (USD Million) by Type, and Applications (2023-2030)
11.4.1 Asia Pacific Family Business Services Revenue (USD Million), by Country (2023-2030)
11.4.2 Asia Pacific Family Business Services Revenue (USD Million), by Type (2023-2030)
11.4.3 Asia Pacific Family Business Services Revenue (USD Million), by Applications (2023-2030)
11.5 South America Family Business Services Revenue (USD Million), by Type, and Applications (2023-2030)
11.5.1 South America Family Business Services Revenue (USD Million), by Country (2023-2030)
11.5.2 South America Family Business Services Revenue (USD Million), by Type (2023-2030)
11.5.3 South America Family Business Services Revenue (USD Million), by Applications (2023-2030)
11.6 Middle East and Africa Family Business Services Revenue (USD Million), by Type, and Applications (2023-2030)
11.6.1 Middle East and Africa Family Business Services Revenue (USD Million), by Region (2023-2030)
11.6.2 Middle East and Africa Family Business Services Revenue (USD Million), by Type (2023-2030)
11.6.3 Middle East and Africa Family Business Services Revenue (USD Million), by Applications (2023-2030)
12 Methodology and Data Sources
12.1 Methodology/Research Approach
12.1.1 Research Programs/Design
12.1.2 Market Size Estimation
12.1.3 Market Breakdown and Data Triangulation
12.2 Data Sources
12.2.1 Secondary Sources
12.2.2 Primary Sources
12.3 Disclaimer
List of Tables
Table 1 Market Segmentation Analysis
Table 2 Global Family Business Services Market Companies with Areas Served
Table 3 Products Offerings Global Family Business Services Market
Table 4 Low Growth Scenario Forecasts
Table 5 Reference Case Growth Scenario
Table 6 High Growth Case Scenario
Table 7 Global Family Business Services Revenue (USD Million) And CAGR (%) By Type (2018-2030)
Table 8 Global Family Business Services Revenue (USD Million) And CAGR (%) By Applications (2018-2030)
Table 9 Global Family Business Services Revenue (USD Million) And CAGR (%) By Regions (2018-2030)
Table 10 Global Family Business Services Revenue (USD Million) By Type (2018-2022)
Table 11 Global Family Business Services Revenue Market Share (%) By Type (2018-2022)
Table 12 Global Family Business Services Revenue (USD Million) By Applications (2018-2022)
Table 13 Global Family Business Services Revenue Market Share (%) By Applications (2018-2022)
Table 14 Global Family Business Services Market Revenue (USD Million) By Regions (2018-2022)
Table 15 Global Family Business Services Market Share (%) By Regions (2018-2022)
Table 16 North America Family Business Services Revenue (USD Million) By Country (2018-2022)
Table 17 North America Family Business Services Revenue (USD Million) By Type (2018-2022)
Table 18 North America Family Business Services Revenue (USD Million) By Applications (2018-2022)
Table 19 Europe Family Business Services Revenue (USD Million) By Country (2018-2022)
Table 20 Europe Family Business Services Revenue (USD Million) By Type (2018-2022)
Table 21 Europe Family Business Services Revenue (USD Million) By Applications (2018-2022)
Table 22 Asia Pacific Family Business Services Revenue (USD Million) By Country (2018-2022)
Table 23 Asia Pacific Family Business Services Revenue (USD Million) By Type (2018-2022)
Table 24 Asia Pacific Family Business Services Revenue (USD Million) By Applications (2018-2022)
Table 25 South America Family Business Services Revenue (USD Million) By Country (2018-2022)
Table 26 South America Family Business Services Revenue (USD Million) By Type (2018-2022)
Table 27 South America Family Business Services Revenue (USD Million) By Applications (2018-2022)
Table 28 Middle East and Africa Family Business Services Revenue (USD Million) By Region (2018-2022)
Table 29 Middle East and Africa Family Business Services Revenue (USD Million) By Type (2018-2022)
Table 30 Middle East and Africa Family Business Services Revenue (USD Million) By Applications (2018-2022)
Table 31 Financial Analysis
Table 32 Global Family Business Services Revenue (USD Million) By Type (2023-2030)
Table 33 Global Family Business Services Revenue Market Share (%) By Type (2023-2030)
Table 34 Global Family Business Services Revenue (USD Million) By Applications (2023-2030)
Table 35 Global Family Business Services Revenue Market Share (%) By Applications (2023-2030)
Table 36 Global Family Business Services Market Revenue (USD Million), And Revenue (USD Million) By Regions (2023-2030)
Table 37 North America Family Business Services Revenue (USD)By Country (2023-2030)
Table 38 North America Family Business Services Revenue (USD Million) By Type (2023-2030)
Table 39 North America Family Business Services Revenue (USD Million) By Applications (2023-2030)
Table 40 Europe Family Business Services Revenue (USD Million) By Country (2023-2030)
Table 41 Europe Family Business Services Revenue (USD Million) By Type (2023-2030)
Table 42 Europe Family Business Services Revenue (USD Million) By Applications (2023-2030)
Table 43 Asia Pacific Family Business Services Revenue (USD Million) By Country (2023-2030)
Table 44 Asia Pacific Family Business Services Revenue (USD Million) By Type (2023-2030)
Table 45 Asia Pacific Family Business Services Revenue (USD Million) By Applications (2023-2030)
Table 46 South America Family Business Services Revenue (USD Million) By Country (2023-2030)
Table 47 South America Family Business Services Revenue (USD Million) By Type (2023-2030)
Table 48 South America Family Business Services Revenue (USD Million) By Applications (2023-2030)
Table 49 Middle East and Africa Family Business Services Revenue (USD Million) By Region (2023-2030)
Table 50 Middle East and Africa Family Business Services Revenue (USD Million) By Region (2023-2030)
Table 51 Middle East and Africa Family Business Services Revenue (USD Million) By Type (2023-2030)
Table 52 Middle East and Africa Family Business Services Revenue (USD Million) By Applications (2023-2030)
Table 53 Research Programs/Design for This Report
Table 54 Key Data Information from Secondary Sources
Table 55 Key Data Information from Primary Sources
List of Figures
Figure 1 Market Scope
Figure 2 Porter’s Five Forces
Figure 3 Global Family Business Services Revenue (USD Million) By Type (2018-2022)
Figure 4 Global Family Business Services Revenue Market Share (%) By Type (2022)
Figure 5 Global Family Business Services Revenue (USD Million) By Applications (2018-2022)
Figure 6 Global Family Business Services Revenue Market Share (%) By Applications (2022)
Figure 7 Global Family Business Services Market Revenue (USD Million) By Regions (2018-2022)
Figure 8 Global Family Business Services Market Share (%) By Regions (2022)
Figure 9 North America Family Business Services Revenue (USD Million) By Country (2018-2022)
Figure 10 North America Family Business Services Revenue (USD Million) By Type (2018-2022)
Figure 11 North America Family Business Services Revenue (USD Million) By Applications (2018-2022)
Figure 12 Europe Family Business Services Revenue (USD Million) By Country (2018-2022)
Figure 13 Europe Family Business Services Revenue (USD Million) By Type (2018-2022)
Figure 14 Europe Family Business Services Revenue (USD Million) By Applications (2018-2022)
Figure 15 Asia Pacific Family Business Services Revenue (USD Million) By Country (2018-2022)
Figure 16 Asia Pacific Family Business Services Revenue (USD Million) By Type (2018-2022)
Figure 17 Asia Pacific Family Business Services Revenue (USD Million) By Applications (2018-2022)
Figure 18 South America Family Business Services Revenue (USD Million) By Country (2018-2022)
Figure 19 South America Family Business Services Revenue (USD Million) By Type (2018-2022)
Figure 20 South America Family Business Services Revenue (USD Million) By Applications (2018-2022)
Figure 21 Middle East and Africa Family Business Services Revenue (USD Million) By Region (2018-2022)
Figure 22 Middle East and Africa Family Business Services Revenue (USD Million) By Type (2018-2022)
Figure 23 Middle East and Africa Family Business Services Revenue (USD Million) By Applications (2018-2022)
Figure 24 Global Family Business Services Revenue (USD Million) By Type (2023-2030)
Figure 25 Global Family Business Services Revenue Market Share (%) By Type (2030)
Figure 26 Global Family Business Services Revenue (USD Million) By Applications (2023-2030)
Figure 27 Global Family Business Services Revenue Market Share (%) By Applications (2030)
Figure 28 Global Family Business Services Market Revenue (USD Million) By Regions (2023-2030)
Figure 29 North America Family Business Services Revenue (USD Million) By Country (2023-2030)
Figure 30 North America Family Business Services Revenue (USD Million) By Type (2023-2030)
Figure 31 North America Family Business Services Revenue (USD Million) By Applications (2023-2030)
Figure 32 Europe Family Business Services Revenue (USD Million) By Country (2023-2030)
Figure 33 Europe Family Business Services Revenue (USD Million) By Type (2023-2030)
Figure 34 Europe Family Business Services Revenue (USD Million) By Applications (2023-2030)
Figure 35 Asia Pacific Family Business Services Revenue (USD Million) By Country (2023-2030)
Figure 36 Asia Pacific Family Business Services Revenue (USD Million) By Type (2023-2030)
Figure 37 Asia Pacific Family Business Services Revenue (USD Million) By Applications (2023-2030)
Figure 38 South America Family Business Services Revenue (USD Million) By Country (2023-2030)
Figure 39 South America Family Business Services Revenue (USD Million) By Type (2023-2030)
Figure 40 South America Family Business Services Revenue (USD Million) By Applications (2023-2030)
Figure 41 Middle East and Africa Family Business Services Revenue (USD Million) By Region (2023-2030)
Figure 42 Middle East and Africa Family Business Services Revenue (USD Million) By Region (2023-2030)
Figure 43 Middle East and Africa Family Business Services Revenue (USD Million) By Type (2023-2030)
Figure 44 Middle East and Africa Family Business Services Revenue (USD Million) By Applications (2023-2030)
Figure 45 Bottom-Up and Top-Down Approaches For This Report
Figure 46 Data Triangulation
