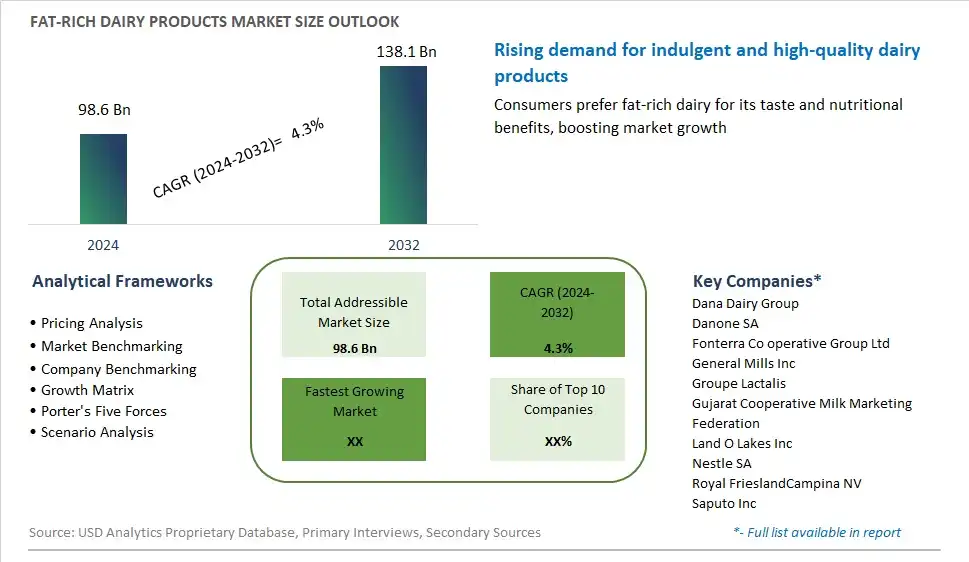
Global Fat-Rich Dairy Products Market Size is valued at $98.6 Billion in 2024 and is forecast to register a growth rate (CAGR) of 4.3% to reach $138.1 Billion by 2032.
The global Fat-Rich Dairy Products Market Comprehensive Study analyzes and forecasts the market size across 6 regions and 24 countries for diverse segments -By Type (Butter, Ghee, Cream), By Application (Food & Beverages, Infant Formulations, Dietary Supplements, Animal Feed, Pharmaceuticals)
An Introduction to Fat-Rich Dairy Products Market
The Fat-Rich Dairy Products Market focuses on the production and sale of dairy products with high fat content, such as butter, cream, and full-fat cheese. These products are valued for their rich flavor and texture. The market is driven by increasing consumer preference for indulgent and high-quality food products, rising demand for dairy-based ingredients in cooking and baking, and growing awareness about the nutritional benefits of dairy fats. Additionally, the expansion of the foodservice industry and advancements in dairy processing technologies support market growth.
Fat Rich Dairy Products Competitive Landscape
The market report analyses the leading companies in the industry including Dana Dairy Group, Danone SA, Fonterra Co operative Group Ltd, General Mills Inc, Groupe Lactalis, Gujarat Cooperative Milk Marketing Federation, Land O Lakes Inc, Nestle SA, Royal FrieslandCampina NV, Saputo Inc, and Others.
Fat Rich Dairy Products Market Dynamics
Market Trend: Rising Demand for High-Fat Dairy Products
The most prominent trend in the Fat-Rich Dairy Products Market is the rising demand for high-fat dairy products. As dietary trends shift towards low-carb, high-fat diets like keto and paleo, consumers are seeking dairy products with higher fat content. This trend is driven by the increasing awareness of the benefits of healthy fats for satiety, energy, and overall health. Products such as full-fat milk, cream, butter, and cheese are gaining popularity as consumers embrace high-fat diets
Market Driver: Health and Wellness Movement
The health and wellness movement is a major driver of the Fat-Rich Dairy Products Market. Consumers are becoming more informed about the nutritional value of fats and are moving away from the low-fat and fat-free trends of the past. The inclusion of high-fat dairy products in various dietary plans, along with endorsements from nutritionists and health experts, is driving their demand. The growing focus on whole, unprocessed foods is further contributing to the popularity of fat-rich dairy products
Market Opportunity: Innovation in Product Offerings
A significant opportunity in the Fat-Rich Dairy Products Market lies in innovation in product offerings. Companies can capitalize on this by developing new and unique fat-rich dairy products that cater to different tastes and dietary preferences. This includes creating flavored butters, high-fat yogurt varieties, and premium cheese blends. By continuously innovating and introducing new products, companies can attract a diverse consumer base and maintain their competitive edge in the market
Fat-Rich Dairy Products Market Share Analysis: Type (Butter, Ghee, Cream)
The ghee segment is anticipated to be the fastest-growing in the Fat-Rich Dairy Products Market by type to 2032. Ghee, a clarified butter commonly used in Indian and Middle Eastern cuisines, is gaining popularity globally due to its rich flavor, nutritional benefits, and versatility in cooking. The demand for ghee is driven by the increasing awareness of its health benefits, including its potential to support digestion, provide healthy fats, and enhance the flavor of dishes. Additionally, the growing trend of traditional and ethnic foods, along with the rise of the ketogenic and paleo diets, contributes to the segment's rapid growth. The expansion of product offerings and the increasing availability of ghee in various retail channels support the growth of this segment.
Fat-Rich Dairy Products Market Share Analysis: Application (Food & Beverages, Infant Formulations, Dietary Supplements, Animal Feed, Pharmaceuticals)
The food & beverages segment is expected to be the fastest-growing in the Fat-Rich Dairy Products Market by application to 2032. The demand for fat-rich dairy products in the food and beverages industry is driven by their versatility and wide range of applications, including cooking, baking, and food processing. Fat-rich dairy products, such as butter, ghee, and cream, are essential ingredients in many culinary preparations, enhancing the flavor, texture, and nutritional value of dishes. Additionally, the growing trend of home cooking and baking, along with the increasing popularity of ethnic and traditional cuisines, contributes to the segment's rapid growth. The expansion of the food and beverages industry and the increasing use of fat-rich dairy products in various applications support the growth of this segment.
Fat Rich Dairy Products Market Segmentation
By Type
Butter
Ghee
Cream
By Application
Food & Beverages
Infant Formulations
Dietary Supplements
Animal Feed
Pharmaceuticals
Countries Analyzed
North America (US, Canada, Mexico)
Europe (Germany, UK, France, Spain, Italy, Russia, Rest of Europe)
Asia Pacific (China, India, Japan, South Korea, Australia, South East Asia, Rest of Asia)
South America (Brazil, Argentina, Rest of South America)
Middle East and Africa (Saudi Arabia, UAE, Rest of Middle East, South Africa, Egypt, Rest of Africa)
Fat Rich Dairy Products Companies Profiled in the Study
Dana Dairy Group
Danone SA
Fonterra Co operative Group Ltd
General Mills Inc
Groupe Lactalis
Gujarat Cooperative Milk Marketing Federation
Land O Lakes Inc
Nestle SA
Royal FrieslandCampina NV
Saputo Inc
*- List Not Exhaustive
Chapter 1. TABLE OF CONTENTS
Chapter 2. Introduction to Fat Rich Dairy Products Market
2.1. Market Overview
2.2. Key Statistics and Report Highlights
2.3. Scope of the Comprehensive Study
2.3.1. Market Definition
2.3.2 Countries and Regions Covered
2.3.3 Research Objective
2.3.4 Units, Currency, and Conversions
2.3.5 Industry Value Chain
2.4. Key Market Segments
2.5. Key Companies
2.6. Study Period
Chapter 3. Strategic Analysis Review
3.1. Fat Rich Dairy Products Pricing Analysis and Forecast
3.2. Porter’s Five Forces
3.3. Market Ecosystem
3.4. SWOT Analysis
3.5. Regulatory Scenario
3.3. Effects of Inflation, Russia-Ukraine War, moderating economic growth, and other macroeconomic factors
Chapter 4. Competitive Landscape
4.1. Market Share Analysis
4.1.1. Global Fat Rich Dairy Products Market Share by Company, 2023
4.1.2. Product Offerings of Leading Fat Rich Dairy Products Companies
4.2. Market Entropy
4.2.1. New Product Launches in the Industry
4.2.2. Mergers, Acquisitions, Joint ventures, and Partnerships
4.3. Key Strategies and Best Practices
Chapter 5. Global Market Projections: Best, Reference, and Low Case Scenarios
5.1. Growth Analysis- Case Scenario Definitions
5.2. Low Growth Case Scenario Forecasts
5.3. Reference Growth Case Scenario Forecasts
5.4. High Growth Case Scenario Forecasts
Chapter 6. Market Dynamics
6.1. Fat Rich Dairy Products Market Drivers
6.2. Fat Rich Dairy Products Market Challenges
6.6. Fat Rich Dairy Products Market Opportunities
6.4. Fat Rich Dairy Products Market Trends
Chapter 7. Global Fat Rich Dairy Products Market Outlook Trends
7.1. Global Fat Rich Dairy Products Revenue (USD Million) and CAGR (%) by Type (2021-2032)
7.2. Global Fat Rich Dairy Products Revenue (USD Million) and CAGR (%) by Application (2021-2032)
7.3. Global Fat Rich Dairy Products Revenue (USD Million) and CAGR (%) by Product (2021-2032)
By Type
Butter
Ghee
Cream
By Application
Food & Beverages
Infant Formulations
Dietary Supplements
Animal Feed
Pharmaceuticals
Chapter 8. Global Fat Rich Dairy Products Regional Analysis and Outlook
8.1. Global Fat Rich Dairy Products Revenue (USD Million) By Regions (2021- 2032)
8.2. North America Fat Rich Dairy Products Revenue (USD Million) by Country (2021-2032)
8.2.1. United States Fat Rich Dairy Products Regional Analysis and Outlook
8.2.2. Canada Fat Rich Dairy Products Regional Analysis and Outlook
8.2.3. Mexico Fat Rich Dairy Products Regional Analysis and Outlook
8.3. Europe Fat Rich Dairy Products Revenue (USD Million), by Country (2021-2032)
8.3.1. Germany Fat Rich Dairy Products Regional Analysis and Outlook
8.3.2. France Fat Rich Dairy Products Regional Analysis and Outlook
8.3.3. United Kingdom Fat Rich Dairy Products Regional Analysis and Outlook
8.3.4. Spain Fat Rich Dairy Products Regional Analysis and Outlook
8.3.5. Italy Fat Rich Dairy Products Regional Analysis and Outlook
8.3.6. Russia Fat Rich Dairy Products Regional Analysis and Outlook
8.3.7. Rest of Europe Fat Rich Dairy Products Regional Analysis and Outlook
8.4. Asia Pacific Fat Rich Dairy Products Revenue (USD Million) by Country (2021-2032)
8.4.1. China Fat Rich Dairy Products Regional Analysis and Outlook
8.4.2. Japan Fat Rich Dairy Products Regional Analysis and Outlook
8.4.3. India Fat Rich Dairy Products Regional Analysis and Outlook
8.4.4. South Korea Fat Rich Dairy Products Regional Analysis and Outlook
8.4.5. Australia Fat Rich Dairy Products Regional Analysis and Outlook
8.4.6. South East Asia Fat Rich Dairy Products Regional Analysis and Outlook
8.4.7. Rest of Asia Pacific Fat Rich Dairy Products Regional Analysis and Outlook
8.5. South America Fat Rich Dairy Products Revenue (USD Million), by Country (2021-2032)
8.5.1. Brazil Fat Rich Dairy Products Regional Analysis and Outlook
8.5.2. Argentina Fat Rich Dairy Products Regional Analysis and Outlook
8.5.3. Rest of South America Fat Rich Dairy Products Regional Analysis and Outlook
8.6. Middle East and Africa Fat Rich Dairy Products Revenue (USD Million) by Country (2021-2032)
8.6.1. Middle East Fat Rich Dairy Products Regional Analysis and Outlook
8.6.2. Africa Fat Rich Dairy Products Regional Analysis and Outlook
Chapter 9. North America Fat Rich Dairy Products Analysis and Outlook
9.1. North America Fat Rich Dairy Products Revenue (USD Million) by Segments (2021-2032)
9.1.1. North America Fat Rich Dairy Products Revenue (USD Million) by Type (2021-2032)
9.1.2. North America Fat Rich Dairy Products Revenue (USD Million) by Application (2021-2032)
9.1.3. North America Fat Rich Dairy Products Revenue (USD Million) by Product (2021-2032)
By Type
Butter
Ghee
Cream
By Application
Food & Beverages
Infant Formulations
Dietary Supplements
Animal Feed
Pharmaceuticals
Chapter 10. Europe Fat Rich Dairy Products Analysis and Outlook
10.1. Europe Fat Rich Dairy Products Revenue (USD Million), by Segments (USD Million) (2021-2032)
10.1.1. Europe Fat Rich Dairy Products Revenue (USD Million) by Type (2021-2032)
10.1.2. Europe Fat Rich Dairy Products Revenue (USD Million) by Application (2021-2032)
10.1.3. Europe Fat Rich Dairy Products Revenue (USD Million) by Product (2021-2032)
By Type
Butter
Ghee
Cream
By Application
Food & Beverages
Infant Formulations
Dietary Supplements
Animal Feed
Pharmaceuticals
Chapter 11. Asia Pacific Fat Rich Dairy Products Analysis and Outlook
11.1. Asia Pacific Fat Rich Dairy Products Revenue (USD Million), and Revenue (USD Million) by Segments (2021-2032)
11.1.1. Asia Pacific Fat Rich Dairy Products Revenue (USD Million) by Type (2021-2032)
11.1.2. Asia Pacific Fat Rich Dairy Products Revenue (USD Million) by Application (2021-2032)
11.1.3. Asia Pacific Fat Rich Dairy Products Revenue (USD Million) by Product (2021-2032)
By Type
Butter
Ghee
Cream
By Application
Food & Beverages
Infant Formulations
Dietary Supplements
Animal Feed
Pharmaceuticals
Chapter 12. South America Fat Rich Dairy Products Analysis and Outlook
12.1. South America Fat Rich Dairy Products Revenue (USD Million), by Segments (2021-2032)
12.1.1. South America Fat Rich Dairy Products Revenue (USD Million) by Type (2021-2032)
12.1.2. South America Fat Rich Dairy Products Revenue (USD Million) by Application (2021-2032)
12.1.3. South America Fat Rich Dairy Products Revenue (USD Million) by Product (2021-2032)
By Type
Butter
Ghee
Cream
By Application
Food & Beverages
Infant Formulations
Dietary Supplements
Animal Feed
Pharmaceuticals
Chapter 13. Middle East and Africa Fat Rich Dairy Products Analysis and Outlook
13.1. Middle East and Africa Fat Rich Dairy Products Revenue (USD Million), by Segments (2021-2032)
13.1.1. Middle East and Africa Fat Rich Dairy Products Revenue (USD Million) by Type (2021-2032)
13.1.2. Middle East and Africa Fat Rich Dairy Products Revenue (USD Million) by Application (2021-2032)
13.1.3. Middle East and Africa Fat Rich Dairy Products Revenue (USD Million) by Product (2021-2032)
By Type
Butter
Ghee
Cream
By Application
Food & Beverages
Infant Formulations
Dietary Supplements
Animal Feed
Pharmaceuticals
Chapter 14. Fat Rich Dairy Products Company Profiles
14.1 Business Overview
14.2 Product Profiles
14.3 SWOT Profiles
14.5 Recent Developments
14.6 Financial Profile
List of Companies
Dana Dairy Group
Danone SA
Fonterra Co operative Group Ltd
General Mills Inc
Groupe Lactalis
Gujarat Cooperative Milk Marketing Federation
Land O Lakes Inc
Nestle SA
Royal FrieslandCampina NV
Saputo Inc
15. Methodology and Data Sources
15.1 Customization Offerings
15.2 Subscription Services
15.3 Related Reports
15.4 Publisher Expertise
LIST OF TABLES
Table 1 Market Segmentation Analysis
Table 2 Global Fat Rich Dairy Products Market Share of Leading Companies, 2023
Table 3 Product Offerings of Leading Companies
Table 4 Low Growth Scenario Forecasts
Table 5 Reference Case Growth Scenario
Table 6 High Growth Case Scenario
Table 7 Global Fat Rich Dairy Products Revenue (USD Million) And CAGR (%) By Type (2021-2032)
Table 8 Global Fat Rich Dairy Products Revenue (USD Million) And CAGR (%) By Application (2021-2032)
Table 9 Global Fat Rich Dairy Products Revenue (USD Million) And CAGR (%) By Product (2021-2032)
Table 10 Global Fat Rich Dairy Products Market Revenue (USD Million) By Regions (2021-2032)
Table 11 Global Fat Rich Dairy Products Market Share (%) By Regions (2021-2032)
Table 12 North America Fat Rich Dairy Products Revenue (USD Million) By Country (2021-2032)
Table 13 Europe Fat Rich Dairy Products Revenue (USD Million) By Country (2021-2032)
Table 14 Asia Pacific Fat Rich Dairy Products Revenue (USD Million) By Country (2021-2032)
Table 15 South America Fat Rich Dairy Products Revenue (USD Million) By Country (2021-2032)
Table 16 Middle East and Africa Fat Rich Dairy Products Revenue (USD Million) By Region (2021-2032)
Table 17 North America Fat Rich Dairy Products Revenue (USD Million) By Type (2021-2032)
Table 18 North America Fat Rich Dairy Products Revenue (USD Million) By Application (2021-2032)
Table 19 North America Fat Rich Dairy Products Revenue (USD Million) By Product (2021-2032)
Table 20 Europe Fat Rich Dairy Products Revenue (USD Million) By Type (2021-2032)
Table 21 Europe Fat Rich Dairy Products Revenue (USD Million) By Application (2021-2032)
Table 22 Europe Fat Rich Dairy Products Revenue (USD Million) By Product (2021-2032)
Table 23 Asia Pacific Fat Rich Dairy Products Revenue (USD Million) By Type (2021-2032)
Table 24 Asia Pacific Fat Rich Dairy Products Revenue (USD Million) By Application (2021-2032)
Table 25 Asia Pacific Fat Rich Dairy Products Revenue (USD Million) By Product (2021-2032)
Table 26 South America Fat Rich Dairy Products Revenue (USD Million) By Type (2021-2032)
Table 27 South America Fat Rich Dairy Products Revenue (USD Million) By Application (2021-2032)
Table 28 South America Fat Rich Dairy Products Revenue (USD Million) By Product (2021-2032)
Table 29 Middle East and Africa Fat Rich Dairy Products Revenue (USD Million) By Type (2021-2032)
Table 30 Middle East and Africa Fat Rich Dairy Products Revenue (USD Million) By Application (2021-2032)
Table 31 Middle East and Africa Fat Rich Dairy Products Revenue (USD Million) By Product (2021-2032)
LIST OF FIGURES
Figure 1. Market Scope
Figure 2. Pricing Forecasts Per Unit, 2023- 2032
Figure 3. Porter’s Five Forces
Figure 4. Global Fat Rich Dairy Products Market Revenue (USD Million) By Regions (2021-2032)
Figure 5. Global Fat Rich Dairy Products Market Share (%) By Regions (2023)
Figure 6. North America Fat Rich Dairy Products Revenue (USD Million) By Country (2021-2032)
Figure 7. United States Fat Rich Dairy Products Revenue (USD Million) By Country (2021-2032)
Figure 8. Canada Fat Rich Dairy Products Revenue (USD Million) By Country (2021-2032)
Figure 9. Mexico Fat Rich Dairy Products Revenue (USD Million) By Country (2021-2032)
Figure 10. Europe Fat Rich Dairy Products Revenue (USD Million) By Country (2021-2032)
Figure 11. Germany Fat Rich Dairy Products Revenue (USD Million) By Country (2021-2032)
Figure 12. France Fat Rich Dairy Products Revenue (USD Million) By Country (2021-2032)
Figure 13. United Kingdom Fat Rich Dairy Products Revenue (USD Million) By Country (2021-2032)
Figure 14. Spain Fat Rich Dairy Products Revenue (USD Million) By Country (2021-2032)
Figure 15. Italy Fat Rich Dairy Products Revenue (USD Million) By Country (2021-2032)
Figure 16. Russia Fat Rich Dairy Products Revenue (USD Million) By Country (2021-2032)
Figure 17. Rest of Europe Fat Rich Dairy Products Revenue (USD Million) By Country (2021-2032)
Figure 11. Asia Pacific Fat Rich Dairy Products Revenue (USD Million) By Country (2021-2032)
Figure 12. China Fat Rich Dairy Products Revenue (USD Million) By Country (2021-2032)
Figure 13. Japan Fat Rich Dairy Products Revenue (USD Million) By Country (2021-2032)
Figure 14. India Fat Rich Dairy Products Revenue (USD Million) By Country (2021-2032)
Figure 15. South Korea Fat Rich Dairy Products Revenue (USD Million) By Country (2021-2032)
Figure 16. Australia Fat Rich Dairy Products Revenue (USD Million) By Country (2021-2032)
Figure 17. South East Asia Fat Rich Dairy Products Revenue (USD Million) By Country (2021-2032)
Figure 18. South America Fat Rich Dairy Products Revenue (USD Million) By Country (2021-2032)
Figure 19. Brazil Fat Rich Dairy Products Revenue (USD Million) By Country (2021-2032)
Figure 20. Argentina Fat Rich Dairy Products Revenue (USD Million) By Country (2021-2032)
Figure 21. Rest of Asia Pacific Fat Rich Dairy Products Revenue (USD Million) By Country (2021-2032)
Figure 22. Middle East and Africa Fat Rich Dairy Products Revenue (USD Million) By Region (2021-2032)
Figure 23. Saudi Arabia Fat Rich Dairy Products Revenue (USD Million) By Region (2021-2032)
Figure 24. The UAE Fat Rich Dairy Products Revenue (USD Million) By Region (2021-2032)
Figure 25. Rest of Middle East Fat Rich Dairy Products Revenue (USD Million) By Region (2021-2032)
Figure 26. South Africa Fat Rich Dairy Products Revenue (USD Million) By Region (2021-2032)
Figure 27. Africa Fat Rich Dairy Products Revenue (USD Million) By Region (2021-2032)
Figure 28. North America Fat Rich Dairy Products Revenue (USD Million) By Type (2021-2032)
Figure 29. North America Fat Rich Dairy Products Revenue (USD Million) By Application (2021-2032)
Figure 30. North America Fat Rich Dairy Products Revenue (USD Million) By Product (2021-2032)
Figure 31. Europe Fat Rich Dairy Products Revenue (USD Million) By Type (2021-2032)
Figure 32. Europe Fat Rich Dairy Products Revenue (USD Million) By Application (2021-2032)
Figure 33. Europe Fat Rich Dairy Products Revenue (USD Million) By Product (2021-2032)
Figure 34. Asia Pacific Fat Rich Dairy Products Revenue (USD Million) By Type (2021-2032)
Figure 35. Asia Pacific Fat Rich Dairy Products Revenue (USD Million) By Application (2021-2032)
Figure 36. Asia Pacific Fat Rich Dairy Products Revenue (USD Million) By Product (2021-2032)
Figure 37. South America Fat Rich Dairy Products Revenue (USD Million) By Type (2021-2032)
Figure 38. South America Fat Rich Dairy Products Revenue (USD Million) By Application (2021-2032)
Figure 39. South America Fat Rich Dairy Products Revenue (USD Million) By Product (2021-2032)
Figure 40. Middle East and Africa Fat Rich Dairy Products Revenue (USD Million) By Type (2021-2032)
Figure 41. Middle East and Africa Fat Rich Dairy Products Revenue (USD Million) By Application (2021-2032)
Figure 42. Middle East and Africa Fat Rich Dairy Products Revenue (USD Million) By Product (2021-2032)
By Type
Butter
Ghee
Cream
By Application
Food & Beverages
Infant Formulations
Dietary Supplements
Animal Feed
Pharmaceuticals
Countries Analyzed
North America (US, Canada, Mexico)
Europe (Germany, UK, France, Spain, Italy, Russia, Rest of Europe)
Asia Pacific (China, India, Japan, South Korea, Australia, South East Asia, Rest of Asia)
South America (Brazil, Argentina, Rest of South America)
Middle East and Africa (Saudi Arabia, UAE, Rest of Middle East, South Africa, Egypt, Rest of Africa)
