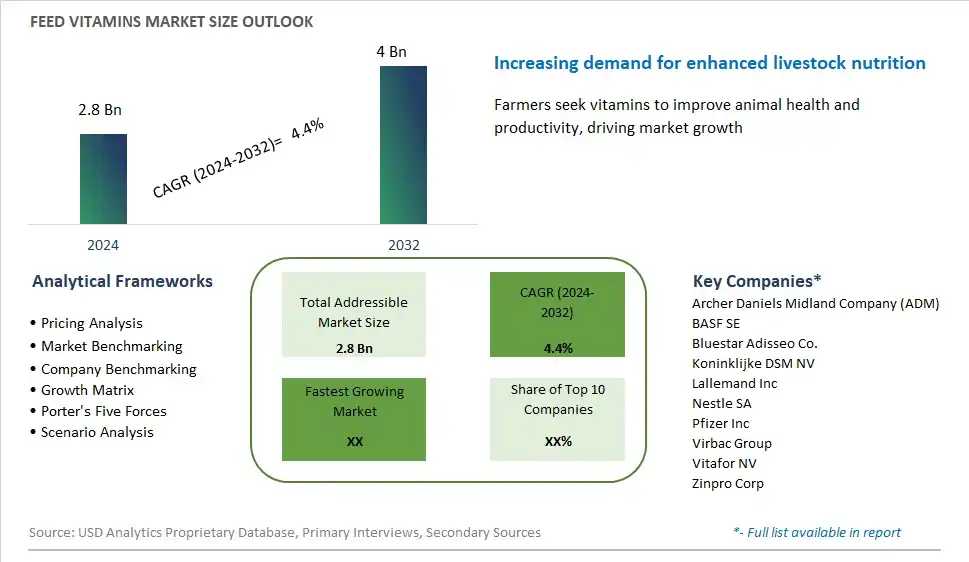
Global Feed Vitamins Market Size is valued at $2.8 Billion in 2024 and is forecast to register a growth rate (CAGR) of 4.4% to reach $4 Billion by 2032.
The global Feed Vitamins Market Comprehensive Study analyzes and forecasts the market size across 6 regions and 24 countries for diverse segments -By Animal (Poultry, Ruminants, Swine, Others), By Type (Vitamin A, Vitamin B, Vitamin C)
An Introduction to Feed Vitamins Market
In 2024, the market for feed vitamins is experiencing significant growth driven by the increasing demand for high-quality animal feed to support livestock health and productivity. Vitamins are essential nutrients for animal growth, reproduction, and immunity, and their supplementation in feed plays a crucial role in ensuring optimal animal nutrition. With the intensification of animal farming practices and the rising awareness of the importance of animal welfare, there is a growing emphasis on fortifying feed with vitamins to prevent deficiencies and improve overall animal performance. Moreover, advancements in vitamin formulations, such as microencapsulation and coated forms, are enhancing stability and bioavailability, thereby maximizing the efficacy of vitamin supplementation. As the global population continues to expand, driving demand for animal-derived products, the market for feed vitamins is poised for further expansion to meet the growing requirements of the livestock industry.
Feed Vitamins Competitive Landscape
The market report analyses the leading companies in the industry including Archer Daniels Midland Company (ADM), BASF SE, Bluestar Adisseo Co., Koninklijke DSM NV, Lallemand Inc, Nestle SA, Pfizer Inc, Virbac Group, Vitafor NV, Zinpro Corp, and Others.
Feed Vitamins Market Dynamics
Market Trend: Increased Focus on Animal Nutrition
The most prominent trend in the Feed Vitamins Market is the increased focus on animal nutrition. As the demand for high-quality animal products grows, there is a greater emphasis on providing livestock with optimal nutrition to ensure their health and productivity. Feed vitamins play a crucial role in supporting various physiological functions and preventing deficiencies in animals. This trend is driven by the need to enhance animal performance, improve feed efficiency, and meet the rising consumer expectations for quality animal products
Market Driver: Growth of the Livestock and Poultry Industry
The growth of the livestock and poultry industry is a major driver of the Feed Vitamins Market. As global populations and incomes rise, there is an increasing consumption of meat, dairy, and eggs. This growing demand for animal-based products is driving the need for high-quality feed that supports the health and productivity of livestock and poultry. Feed vitamins are essential components of animal diets, and their demand is increasing in line with the expansion of the livestock and poultry industry
Market Opportunity: Development of Specialized Vitamin Premixes
A significant opportunity in the Feed Vitamins Market lies in the development of specialized vitamin premixes. As animal nutrition becomes more sophisticated, there is a growing demand for customized vitamin formulations that cater to the specific needs of different animal species and production systems. By offering tailored vitamin premixes that address specific health issues and enhance animal performance, companies can differentiate their products and attract more customers in the competitive feed market
Feed Vitamins Market Share Analysis: Poultry held the dominant market share in 2024
The poultry segment is the largest segment in the feed vitamins market, driven by several compelling factors. Poultry production, encompassing both meat and egg production, represents a significant portion of the global livestock industry, with rising demand for poultry products across various demographics. To meet the nutritional requirements and optimize performance in poultry flocks, feed vitamins play a crucial role in maintaining health, supporting growth, and enhancing production efficiency. Further, advancements in poultry genetics and management practices have intensified the need for targeted vitamin supplementation to address specific physiological demands and environmental stressors. Furthermore, stringent regulatory standards governing poultry feed formulations have propelled the adoption of fortified feeds containing essential vitamins, further fueling market growth. Additionally, ongoing research and development efforts aimed at optimizing vitamin formulations and delivery methods continue to drive innovation within the poultry segment of the feed vitamins market. Consequently, poultry remains at the forefront of demand for feed vitamins, sustaining its position as the largest segment within the industry.
Feed Vitamins Market Share Analysis: Vitamin B market is poised to register the fastest growth rae over the forecast period to 2032
Within the feed vitamins market, the Vitamin B segment is the fastest-growing segment, propelled by several factors driving its expansion. Vitamin B, comprising a group of water-soluble vitamins such as B1, B2, B3, B5, B6, B7, B9, and B12, plays a crucial role in various metabolic processes essential for animal growth, development, and overall health. The increasing awareness of the pivotal role of Vitamin B in enhancing feed conversion efficiency, optimizing nutrient utilization, and mitigating stress responses in livestock has spurred its widespread adoption across diverse animal species. Further, the growing prevalence of subclinical vitamin deficiencies, exacerbated by intensified production systems and dietary imbalances, has heightened the demand for fortified feeds containing adequate levels of Vitamin B. Furthermore, advancements in vitamin formulation technologies, coupled with innovations in feed processing techniques, have facilitated the incorporation of stable and bioavailable forms of Vitamin B into animal diets, further driving market growth. Additionally, regulatory mandates emphasizing the importance of balanced nutrient supplementation in animal feed formulations have underscored the significance of Vitamin B in promoting animal welfare and productivity, thereby accelerating its market penetration and growth trajectory within the feed vitamins segment.
Feed Vitamins Market Segmentation
By Animal
Poultry
Ruminants
Swine
Others
By Type
Vitamin A
Vitamin B
Vitamin C
Countries Analyzed
North America (US, Canada, Mexico)
Europe (Germany, UK, France, Spain, Italy, Russia, Rest of Europe)
Asia Pacific (China, India, Japan, South Korea, Australia, South East Asia, Rest of Asia)
South America (Brazil, Argentina, Rest of South America)
Middle East and Africa (Saudi Arabia, UAE, Rest of Middle East, South Africa, Egypt, Rest of Africa)
Feed Vitamins Companies Profiled in the Study
Archer Daniels Midland Company (ADM)
BASF SE
Bluestar Adisseo Co.
Koninklijke DSM NV
Lallemand Inc
Nestle SA
Pfizer Inc
Virbac Group
Vitafor NV
Zinpro Corp
*- List Not Exhaustive
Chapter 1. TABLE OF CONTENTS
Chapter 2. Introduction to Feed Vitamins Market
2.1. Market Overview
2.2. Key Statistics and Report Highlights
2.3. Scope of the Comprehensive Study
2.3.1. Market Definition
2.3.2 Countries and Regions Covered
2.3.3 Research Objective
2.3.4 Units, Currency, and Conversions
2.3.5 Industry Value Chain
2.4. Key Market Segments
2.5. Key Companies
2.6. Study Period
Chapter 3. Strategic Analysis Review
3.1. Feed Vitamins Pricing Analysis and Forecast
3.2. Porter’s Five Forces
3.3. Market Ecosystem
3.4. SWOT Analysis
3.5. Regulatory Scenario
3.3. Effects of Inflation, Russia-Ukraine War, moderating economic growth, and other macroeconomic factors
Chapter 4. Competitive Landscape
4.1. Market Share Analysis
4.1.1. Global Feed Vitamins Market Share by Company, 2023
4.1.2. Product Offerings of Leading Feed Vitamins Companies
4.2. Market Entropy
4.2.1. New Product Launches in the Industry
4.2.2. Mergers, Acquisitions, Joint ventures, and Partnerships
4.3. Key Strategies and Best Practices
Chapter 5. Global Market Projections: Best, Reference, and Low Case Scenarios
5.1. Growth Analysis- Case Scenario Definitions
5.2. Low Growth Case Scenario Forecasts
5.3. Reference Growth Case Scenario Forecasts
5.4. High Growth Case Scenario Forecasts
Chapter 6. Market Dynamics
6.1. Feed Vitamins Market Drivers
6.2. Feed Vitamins Market Challenges
6.6. Feed Vitamins Market Opportunities
6.4. Feed Vitamins Market Trends
Chapter 7. Global Feed Vitamins Market Outlook Trends
7.1. Global Feed Vitamins Revenue (USD Million) and CAGR (%) by Type (2021-2032)
7.2. Global Feed Vitamins Revenue (USD Million) and CAGR (%) by Application (2021-2032)
7.3. Global Feed Vitamins Revenue (USD Million) and CAGR (%) by Product (2021-2032)
By Animal
Poultry
Ruminants
Swine
Others
By Type
Vitamin A
Vitamin B
Vitamin C
Chapter 8. Global Feed Vitamins Regional Analysis and Outlook
8.1. Global Feed Vitamins Revenue (USD Million) By Regions (2021- 2032)
8.2. North America Feed Vitamins Revenue (USD Million) by Country (2021-2032)
8.2.1. United States Feed Vitamins Regional Analysis and Outlook
8.2.2. Canada Feed Vitamins Regional Analysis and Outlook
8.2.3. Mexico Feed Vitamins Regional Analysis and Outlook
8.3. Europe Feed Vitamins Revenue (USD Million), by Country (2021-2032)
8.3.1. Germany Feed Vitamins Regional Analysis and Outlook
8.3.2. France Feed Vitamins Regional Analysis and Outlook
8.3.3. United Kingdom Feed Vitamins Regional Analysis and Outlook
8.3.4. Spain Feed Vitamins Regional Analysis and Outlook
8.3.5. Italy Feed Vitamins Regional Analysis and Outlook
8.3.6. Russia Feed Vitamins Regional Analysis and Outlook
8.3.7. Rest of Europe Feed Vitamins Regional Analysis and Outlook
8.4. Asia Pacific Feed Vitamins Revenue (USD Million) by Country (2021-2032)
8.4.1. China Feed Vitamins Regional Analysis and Outlook
8.4.2. Japan Feed Vitamins Regional Analysis and Outlook
8.4.3. India Feed Vitamins Regional Analysis and Outlook
8.4.4. South Korea Feed Vitamins Regional Analysis and Outlook
8.4.5. Australia Feed Vitamins Regional Analysis and Outlook
8.4.6. South East Asia Feed Vitamins Regional Analysis and Outlook
8.4.7. Rest of Asia Pacific Feed Vitamins Regional Analysis and Outlook
8.5. South America Feed Vitamins Revenue (USD Million), by Country (2021-2032)
8.5.1. Brazil Feed Vitamins Regional Analysis and Outlook
8.5.2. Argentina Feed Vitamins Regional Analysis and Outlook
8.5.3. Rest of South America Feed Vitamins Regional Analysis and Outlook
8.6. Middle East and Africa Feed Vitamins Revenue (USD Million) by Country (2021-2032)
8.6.1. Middle East Feed Vitamins Regional Analysis and Outlook
8.6.2. Africa Feed Vitamins Regional Analysis and Outlook
Chapter 9. North America Feed Vitamins Analysis and Outlook
9.1. North America Feed Vitamins Revenue (USD Million) by Segments (2021-2032)
9.1.1. North America Feed Vitamins Revenue (USD Million) by Type (2021-2032)
9.1.2. North America Feed Vitamins Revenue (USD Million) by Application (2021-2032)
9.1.3. North America Feed Vitamins Revenue (USD Million) by Product (2021-2032)
By Animal
Poultry
Ruminants
Swine
Others
By Type
Vitamin A
Vitamin B
Vitamin C
Chapter 10. Europe Feed Vitamins Analysis and Outlook
10.1. Europe Feed Vitamins Revenue (USD Million), by Segments (USD Million) (2021-2032)
10.1.1. Europe Feed Vitamins Revenue (USD Million) by Type (2021-2032)
10.1.2. Europe Feed Vitamins Revenue (USD Million) by Application (2021-2032)
10.1.3. Europe Feed Vitamins Revenue (USD Million) by Product (2021-2032)
By Animal
Poultry
Ruminants
Swine
Others
By Type
Vitamin A
Vitamin B
Vitamin C
Chapter 11. Asia Pacific Feed Vitamins Analysis and Outlook
11.1. Asia Pacific Feed Vitamins Revenue (USD Million), and Revenue (USD Million) by Segments (2021-2032)
11.1.1. Asia Pacific Feed Vitamins Revenue (USD Million) by Type (2021-2032)
11.1.2. Asia Pacific Feed Vitamins Revenue (USD Million) by Application (2021-2032)
11.1.3. Asia Pacific Feed Vitamins Revenue (USD Million) by Product (2021-2032)
By Animal
Poultry
Ruminants
Swine
Others
By Type
Vitamin A
Vitamin B
Vitamin C
Chapter 12. South America Feed Vitamins Analysis and Outlook
12.1. South America Feed Vitamins Revenue (USD Million), by Segments (2021-2032)
12.1.1. South America Feed Vitamins Revenue (USD Million) by Type (2021-2032)
12.1.2. South America Feed Vitamins Revenue (USD Million) by Application (2021-2032)
12.1.3. South America Feed Vitamins Revenue (USD Million) by Product (2021-2032)
By Animal
Poultry
Ruminants
Swine
Others
By Type
Vitamin A
Vitamin B
Vitamin C
Chapter 13. Middle East and Africa Feed Vitamins Analysis and Outlook
13.1. Middle East and Africa Feed Vitamins Revenue (USD Million), by Segments (2021-2032)
13.1.1. Middle East and Africa Feed Vitamins Revenue (USD Million) by Type (2021-2032)
13.1.2. Middle East and Africa Feed Vitamins Revenue (USD Million) by Application (2021-2032)
13.1.3. Middle East and Africa Feed Vitamins Revenue (USD Million) by Product (2021-2032)
By Animal
Poultry
Ruminants
Swine
Others
By Type
Vitamin A
Vitamin B
Vitamin C
Chapter 14. Feed Vitamins Company Profiles
14.1 Business Overview
14.2 Product Profiles
14.3 SWOT Profiles
14.5 Recent Developments
14.6 Financial Profile
List of Companies
Archer Daniels Midland Company (ADM)
BASF SE
Bluestar Adisseo Co.
Koninklijke DSM NV
Lallemand Inc
Nestle SA
Pfizer Inc
Virbac Group
Vitafor NV
Zinpro Corp
15. Methodology and Data Sources
15.1 Customization Offerings
15.2 Subscription Services
15.3 Related Reports
15.4 Publisher Expertise
LIST OF TABLES
Table 1 Market Segmentation Analysis
Table 2 Global Feed Vitamins Market Share of Leading Companies, 2023
Table 3 Product Offerings of Leading Companies
Table 4 Low Growth Scenario Forecasts
Table 5 Reference Case Growth Scenario
Table 6 High Growth Case Scenario
Table 7 Global Feed Vitamins Revenue (USD Million) And CAGR (%) By Type (2021-2032)
Table 8 Global Feed Vitamins Revenue (USD Million) And CAGR (%) By Application (2021-2032)
Table 9 Global Feed Vitamins Revenue (USD Million) And CAGR (%) By Product (2021-2032)
Table 10 Global Feed Vitamins Market Revenue (USD Million) By Regions (2021-2032)
Table 11 Global Feed Vitamins Market Share (%) By Regions (2021-2032)
Table 12 North America Feed Vitamins Revenue (USD Million) By Country (2021-2032)
Table 13 Europe Feed Vitamins Revenue (USD Million) By Country (2021-2032)
Table 14 Asia Pacific Feed Vitamins Revenue (USD Million) By Country (2021-2032)
Table 15 South America Feed Vitamins Revenue (USD Million) By Country (2021-2032)
Table 16 Middle East and Africa Feed Vitamins Revenue (USD Million) By Region (2021-2032)
Table 17 North America Feed Vitamins Revenue (USD Million) By Type (2021-2032)
Table 18 North America Feed Vitamins Revenue (USD Million) By Application (2021-2032)
Table 19 North America Feed Vitamins Revenue (USD Million) By Product (2021-2032)
Table 20 Europe Feed Vitamins Revenue (USD Million) By Type (2021-2032)
Table 21 Europe Feed Vitamins Revenue (USD Million) By Application (2021-2032)
Table 22 Europe Feed Vitamins Revenue (USD Million) By Product (2021-2032)
Table 23 Asia Pacific Feed Vitamins Revenue (USD Million) By Type (2021-2032)
Table 24 Asia Pacific Feed Vitamins Revenue (USD Million) By Application (2021-2032)
Table 25 Asia Pacific Feed Vitamins Revenue (USD Million) By Product (2021-2032)
Table 26 South America Feed Vitamins Revenue (USD Million) By Type (2021-2032)
Table 27 South America Feed Vitamins Revenue (USD Million) By Application (2021-2032)
Table 28 South America Feed Vitamins Revenue (USD Million) By Product (2021-2032)
Table 29 Middle East and Africa Feed Vitamins Revenue (USD Million) By Type (2021-2032)
Table 30 Middle East and Africa Feed Vitamins Revenue (USD Million) By Application (2021-2032)
Table 31 Middle East and Africa Feed Vitamins Revenue (USD Million) By Product (2021-2032)
LIST OF FIGURES
Figure 1. Market Scope
Figure 2. Pricing Forecasts Per Unit, 2023- 2032
Figure 3. Porter’s Five Forces
Figure 4. Global Feed Vitamins Market Revenue (USD Million) By Regions (2021-2032)
Figure 5. Global Feed Vitamins Market Share (%) By Regions (2023)
Figure 6. North America Feed Vitamins Revenue (USD Million) By Country (2021-2032)
Figure 7. United States Feed Vitamins Revenue (USD Million) By Country (2021-2032)
Figure 8. Canada Feed Vitamins Revenue (USD Million) By Country (2021-2032)
Figure 9. Mexico Feed Vitamins Revenue (USD Million) By Country (2021-2032)
Figure 10. Europe Feed Vitamins Revenue (USD Million) By Country (2021-2032)
Figure 11. Germany Feed Vitamins Revenue (USD Million) By Country (2021-2032)
Figure 12. France Feed Vitamins Revenue (USD Million) By Country (2021-2032)
Figure 13. United Kingdom Feed Vitamins Revenue (USD Million) By Country (2021-2032)
Figure 14. Spain Feed Vitamins Revenue (USD Million) By Country (2021-2032)
Figure 15. Italy Feed Vitamins Revenue (USD Million) By Country (2021-2032)
Figure 16. Russia Feed Vitamins Revenue (USD Million) By Country (2021-2032)
Figure 17. Rest of Europe Feed Vitamins Revenue (USD Million) By Country (2021-2032)
Figure 11. Asia Pacific Feed Vitamins Revenue (USD Million) By Country (2021-2032)
Figure 12. China Feed Vitamins Revenue (USD Million) By Country (2021-2032)
Figure 13. Japan Feed Vitamins Revenue (USD Million) By Country (2021-2032)
Figure 14. India Feed Vitamins Revenue (USD Million) By Country (2021-2032)
Figure 15. South Korea Feed Vitamins Revenue (USD Million) By Country (2021-2032)
Figure 16. Australia Feed Vitamins Revenue (USD Million) By Country (2021-2032)
Figure 17. South East Asia Feed Vitamins Revenue (USD Million) By Country (2021-2032)
Figure 18. South America Feed Vitamins Revenue (USD Million) By Country (2021-2032)
Figure 19. Brazil Feed Vitamins Revenue (USD Million) By Country (2021-2032)
Figure 20. Argentina Feed Vitamins Revenue (USD Million) By Country (2021-2032)
Figure 21. Rest of Asia Pacific Feed Vitamins Revenue (USD Million) By Country (2021-2032)
Figure 22. Middle East and Africa Feed Vitamins Revenue (USD Million) By Region (2021-2032)
Figure 23. Saudi Arabia Feed Vitamins Revenue (USD Million) By Region (2021-2032)
Figure 24. The UAE Feed Vitamins Revenue (USD Million) By Region (2021-2032)
Figure 25. Rest of Middle East Feed Vitamins Revenue (USD Million) By Region (2021-2032)
Figure 26. South Africa Feed Vitamins Revenue (USD Million) By Region (2021-2032)
Figure 27. Africa Feed Vitamins Revenue (USD Million) By Region (2021-2032)
Figure 28. North America Feed Vitamins Revenue (USD Million) By Type (2021-2032)
Figure 29. North America Feed Vitamins Revenue (USD Million) By Application (2021-2032)
Figure 30. North America Feed Vitamins Revenue (USD Million) By Product (2021-2032)
Figure 31. Europe Feed Vitamins Revenue (USD Million) By Type (2021-2032)
Figure 32. Europe Feed Vitamins Revenue (USD Million) By Application (2021-2032)
Figure 33. Europe Feed Vitamins Revenue (USD Million) By Product (2021-2032)
Figure 34. Asia Pacific Feed Vitamins Revenue (USD Million) By Type (2021-2032)
Figure 35. Asia Pacific Feed Vitamins Revenue (USD Million) By Application (2021-2032)
Figure 36. Asia Pacific Feed Vitamins Revenue (USD Million) By Product (2021-2032)
Figure 37. South America Feed Vitamins Revenue (USD Million) By Type (2021-2032)
Figure 38. South America Feed Vitamins Revenue (USD Million) By Application (2021-2032)
Figure 39. South America Feed Vitamins Revenue (USD Million) By Product (2021-2032)
Figure 40. Middle East and Africa Feed Vitamins Revenue (USD Million) By Type (2021-2032)
Figure 41. Middle East and Africa Feed Vitamins Revenue (USD Million) By Application (2021-2032)
Figure 42. Middle East and Africa Feed Vitamins Revenue (USD Million) By Product (2021-2032)
By Animal
Poultry
Ruminants
Swine
Others
By Type
Vitamin A
Vitamin B
Vitamin C
Countries Analyzed
North America (US, Canada, Mexico)
Europe (Germany, UK, France, Spain, Italy, Russia, Rest of Europe)
Asia Pacific (China, India, Japan, South Korea, Australia, South East Asia, Rest of Asia)
South America (Brazil, Argentina, Rest of South America)
Middle East and Africa (Saudi Arabia, UAE, Rest of Middle East, South Africa, Egypt, Rest of Africa)
