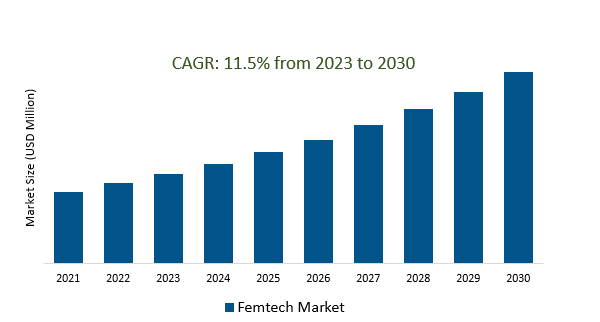
The Global Femtech Market Size is estimated to register 11.5% growth over the forecast period from 2023 to 2030.
The market growth is driven by an increasing awareness of the impact of stress and mental health on women's overall health prompting Femtech companies to integrate features and services that go beyond traditional reproductive health. This trend reflected a more comprehensive understanding of women's healthcare needs. Leading Companies focusing on integrating AI and Machine Learning, Expansion into Menopause Management, Collaboration with Traditional Healthcare Providers, and others to boost market shares in the industry.
Market Overview
The Femtech market, encompassing technology-driven solutions for women's health, has seen rapid growth, driven by increased awareness and technological innovations. Applications range from reproductive and menstrual health to pregnancy and postpartum care. Wearable devices, telehealth, and AI play integral roles, providing personalized insights and remote healthcare access. Despite challenges like data privacy concerns, the market has attracted substantial investment, reflecting confidence in its potential. Inclusivity and regulatory considerations are ongoing focuses, and the industry anticipates continued expansion with positive policy changes.
Market Dynamics
Market Trends- Femtech is transforming the healthcare landscape by empowering women with innovative technological solutions that address their unique health needs.
Femtech, the convergence of technology and women's health is revolutionizing healthcare by delivering innovative solutions tailored to women's unique needs. From fertility tracking to postpartum care, Femtech employs wearables, telehealth, and data analytics, empowering women to proactively manage their well-being. This transformative trend enhances women's autonomy in healthcare decisions and sparks discussions on inclusivity, data privacy, and regulatory considerations. With increasing investment and ongoing evolution, Femtech stands as a pivotal force driving positive change in women's health innovation.
Market Driver- The rapid advancements in technology and the development of innovative Femtech solutions are fueling the growth and demand in the Femtech market.
Rapid technological advancements and innovative solutions are driving significant growth in the Femtech market. The integration of technologies like AI, wearables, and telehealth is reshaping women's health by offering personalized and data-driven approaches. Beyond traditional areas like fertility tracking, Femtech now addresses diverse aspects, including mental health and menopause management. This evolution positions Femtech as a transformative force in healthcare, attracting investment and meeting the rising demand for comprehensive women's health solutions.
Market Opportunity- A surge in investments and funding is propelling the growth and expansion of the Femtech market, enabling the development and accessibility of innovative women's health solutions.
A surge in investments is propelling the growth of the Femtech market, driving the development and accessibility of innovative women's health solutions. This financial support is crucial for advancing research, technology integration, and expanding the product and service offerings within the Femtech sector. The increased funding not only highlights the market's potential but also signifies growing recognition of the importance of addressing women's health needs through technology. As Femtech attracts substantial investments, it plays a pivotal role in shaping the future of women's healthcare by promoting innovation and expanding the reach of impactful solutions.
Market Share Analysis- Devices Femtech Market will register the fastest growth
The Global Femtech Market is analyzed across Devices, Software, Services, and others. Devices are poised to register the fastest growth. The Devices Femtech Market encompasses wearable devices, home testing kits, smart health monitoring devices, fertility tracking devices, pelvic health devices, and maternity wearables. These technologies are designed to address various aspects of women's health, providing convenient and personalized solutions for monitoring menstrual cycles, fertility, overall fitness, and specific health parameters. The market is characterized by the integration of advanced technologies, such as AI and data analytics, aiming to offer accurate tracking, timely interventions, and improved management of women's health. The Devices Femtech Market reflects the growing demand for tech-driven solutions catering to the unique health needs of women.
Market Share Analysis- Reproductive Health held a significant market share in 2023
The Global Femtech Market is analyzed across various applications including Reproductive Health, Pregnancy and Nursing care, Pelvic and Uterine Healthcare, General Healthcare and wellness, and others. Of these, Reproductive Health held a significant market share in 2023. The Reproductive Health Femtech Market focuses on technological solutions catering to women's reproductive health, including fertility tracking apps, ovulation prediction tools, contraceptive technologies, and pregnancy/postpartum apps. These innovations aim to empower women with accurate information, personalized family planning tools, and resources for prenatal and postpartum care. The market addresses the rising demand for data-driven solutions in reproductive health, reflecting a shift towards proactive and personalized approaches to women's healthcare.
Femtech Market Segmentation
By Type
- Devices
- Software
- Services
By Application
- Reproductive Health
- Pregnancy and Nursing care
- Pelvic and Uterine Healthcare
- General Healthcare & Wellness
- Others
By End-User
- Hospitals
- Fertility Clinics
- Others
By Region
- North America (United States, Canada, Mexico)
- Europe (Germany, France, United Kingdom, Spain, Italy, Others)
- Asia Pacific (China, India, Japan, South Korea, Australia, Others)
- Latin America (Brazil, Argentina, Others)
- Middle East and Africa (Saudi Arabia, UAE, Kuwait, Other Middle East, South Africa, Nigeria, Other Africa)
Femtech Market Companies
- Natural Cycles USA Corp
- Nuvo Cares
- Elvie
- HeraMED
- Flo Health Inc
- Clue by Biowink GmbH
- Fitbit Inc
- iSono Health
- Sera Prognostics
- Withings
- Athena Feminine Technologies
- NuroKor Ltd
- Canopie
- Glow Inc
- Apple Inc
*List not exhaustive
Femtech Market Outlook 2023
1 Market Overview
1.1 Introduction to the Femtech Market
1.2 Scope of the Study
1.3 Research Objective
1.3.1 Key Market Scope and Segments
1.3.2 Players Covered
1.3.3 Years Considered
2 Executive Summary
2.1 2023 Femtech Industry- Market Statistics
3 Market Dynamics
3.1 Market Drivers
3.2 Market Challenges
3.3 Market Opportunities
3.4 Market Trends
4 Market Factor Analysis
4.1 Porter’s Five Forces
4.2 Market Entropy
4.2.1 Global Femtech Market Companies with Area Served
4.2.2 Products Offerings Global Femtech Market
5 COVID-19 Impact Analysis and Outlook Scenarios
5.1.1 Covid-19 Impact Analysis
5.1.2 post-COVID-19 Scenario- Low Growth Case
5.1.3 post-COVID-19 Scenario- Reference Growth Case
5.1.4 post-COVID-19 Scenario- Low Growth Case
6 Global Femtech Market Trends
6.1 Global Femtech Revenue (USD Million) and CAGR (%) by Type (2018-2030)
6.2 Global Femtech Revenue (USD Million) and CAGR (%) by Applications (2018-2030)
6.3 Global Femtech Revenue (USD Million) and CAGR (%) by regions (2018-2030)
7 Global Femtech Market Revenue (USD Million) by Type, and Applications (2018-2022)
7.1 Global Femtech Revenue (USD Million) by Type (2018-2022)
7.1.1 Global Femtech Revenue (USD Million), Market Share (%) by Type (2018-2022)
7.2 Global Femtech Revenue (USD Million) by Applications (2018-2022)
7.2.1 Global Femtech Revenue (USD Million), Market Share (%) by Applications (2018-2022)
8 Global Femtech Development Regional Status and Outlook
8.1 Global Femtech Revenue (USD Million) By Regions (2018-2022)
8.2 North America Femtech Revenue (USD Million) by Type, and Application (2018-2022)
8.2.1 North America Femtech Revenue (USD Million) by Country (2018-2022)
8.2.2 North America Femtech Revenue (USD Million) by Type (2018-2022)
8.2.3 North America Femtech Revenue (USD Million) by Applications (2018-2022)
8.3 Europe Femtech Revenue (USD Million), by Type, and Applications (USD Million) (2018-2022)
8.3.1 Europe Femtech Revenue (USD Million), by Country (2018-2022)
8.3.2 Europe Femtech Revenue (USD Million) by Type (2018-2022)
8.3.3 Europe Femtech Revenue (USD Million) by Applications (2018-2022)
8.4 Asia Pacific Femtech Revenue (USD Million), and Revenue (USD Million) by Type, and Applications (2018-2022)
8.4.1 Asia Pacific Femtech Revenue (USD Million) by Country (2018-2022)
8.4.2 Asia Pacific Femtech Revenue (USD Million) by Type (2018-2022)
8.4.3 Asia Pacific Femtech Revenue (USD Million) by Applications (2018-2022)
8.5 South America Femtech Revenue (USD Million), by Type, and Applications (2018-2022)
8.5.1 South America Femtech Revenue (USD Million), by Country (2018-2022)
8.5.2 South America Femtech Revenue (USD Million) by Type (2018-2022)
8.5.3 South America Femtech Revenue (USD Million) by Applications (2018-2022)
8.6 Middle East and Africa Femtech Revenue (USD Million), by Type, Technology, Application, Thickness (2018-2022)
8.6.1 Middle East and Africa Femtech Revenue (USD Million) by Country (2018-2022)
8.6.2 Middle East and Africa Femtech Revenue (USD Million) by Type (2018-2022)
8.6.3 Middle East and Africa Femtech Revenue (USD Million) by Applications (2018-2022)
9 Company Profiles
10 Global Femtech Market Revenue (USD Million), by Type, and Applications (2023-2030)
10.1 Global Femtech Revenue (USD Million) and Market Share (%) by Type (2023-2030)
10.1.1 Global Femtech Revenue (USD Million), and Market Share (%) by Type (2023-2030)
10.2 Global Femtech Revenue (USD Million) and Market Share (%) by Applications (2023-2030)
10.2.1 Global Femtech Revenue (USD Million), and Market Share (%) by Applications (2023-2030)
11 Global Femtech Development Regional Status and Outlook Forecast
11.1 Global Femtech Revenue (USD Million) By Regions (2023-2030)
11.2 North America Femtech Revenue (USD Million) by Type, and Applications (2023-2030)
11.2.1 North America Femtech Revenue (USD) Million by Country (2023-2030)
11.2.2 North America Femtech Revenue (USD Million), by Type (2023-2030)
11.2.3 North America Femtech Revenue (USD Million), Market Share (%) by Applications (2023-2030)
11.3 Europe Femtech Revenue (USD Million), by Type, and Applications (2023-2030)
11.3.1 Europe Femtech Revenue (USD Million), by Country (2023-2030)
11.3.2 Europe Femtech Revenue (USD Million), by Type (2023-2030)
11.3.3 Europe Femtech Revenue (USD Million), by Applications (2023-2030)
11.4 Asia Pacific Femtech Revenue (USD Million) by Type, and Applications (2023-2030)
11.4.1 Asia Pacific Femtech Revenue (USD Million), by Country (2023-2030)
11.4.2 Asia Pacific Femtech Revenue (USD Million), by Type (2023-2030)
11.4.3 Asia Pacific Femtech Revenue (USD Million), by Applications (2023-2030)
11.5 South America Femtech Revenue (USD Million), by Type, and Applications (2023-2030)
11.5.1 South America Femtech Revenue (USD Million), by Country (2023-2030)
11.5.2 South America Femtech Revenue (USD Million), by Type (2023-2030)
11.5.3 South America Femtech Revenue (USD Million), by Applications (2023-2030)
11.6 Middle East and Africa Femtech Revenue (USD Million), by Type, and Applications (2023-2030)
11.6.1 Middle East and Africa Femtech Revenue (USD Million), by region (2023-2030)
11.6.2 Middle East and Africa Femtech Revenue (USD Million), by Type (2023-2030)
11.6.3 Middle East and Africa Femtech Revenue (USD Million), by Applications (2023-2030)
12 Methodology and Data Sources
12.1 Methodology/Research Approach
12.1.1 Research Programs/Design
12.1.2 Market Size Estimation
12.1.3 Market Breakdown and Data Triangulation
12.2 Data Sources
12.2.1 Secondary Sources
12.2.2 Primary Sources
12.3 Disclaimer
List of Tables
Table 1 Market Segmentation Analysis
Table 2 Global Femtech Market Companies with Areas Served
Table 3 Products Offerings Global Femtech Market
Table 4 Low Growth Scenario Forecasts
Table 5 Reference Case Growth Scenario
Table 6 High Growth Case Scenario
Table 7 Global Femtech Revenue (USD Million) And CAGR (%) By Type (2018-2030)
Table 8 Global Femtech Revenue (USD Million) And CAGR (%) By Applications (2018-2030)
Table 9 Global Femtech Revenue (USD Million) And CAGR (%) By Regions (2018-2030)
Table 10 Global Femtech Revenue (USD Million) By Type (2018-2022)
Table 11 Global Femtech Revenue Market Share (%) By Type (2018-2022)
Table 12 Global Femtech Revenue (USD Million) By Applications (2018-2022)
Table 13 Global Femtech Revenue Market Share (%) By Applications (2018-2022)
Table 14 Global Femtech Market Revenue (USD Million) By Regions (2018-2022)
Table 15 Global Femtech Market Share (%) By Regions (2018-2022)
Table 16 North America Femtech Revenue (USD Million) By Country (2018-2022)
Table 17 North America Femtech Revenue (USD Million) By Type (2018-2022)
Table 18 North America Femtech Revenue (USD Million) By Applications (2018-2022)
Table 19 Europe Femtech Revenue (USD Million) By Country (2018-2022)
Table 20 Europe Femtech Revenue (USD Million) By Type (2018-2022)
Table 21 Europe Femtech Revenue (USD Million) By Applications (2018-2022)
Table 22 Asia Pacific Femtech Revenue (USD Million) By Country (2018-2022)
Table 23 Asia Pacific Femtech Revenue (USD Million) By Type (2018-2022)
Table 24 Asia Pacific Femtech Revenue (USD Million) By Applications (2018-2022)
Table 25 South America Femtech Revenue (USD Million) By Country (2018-2022)
Table 26 South America Femtech Revenue (USD Million) By Type (2018-2022)
Table 27 South America Femtech Revenue (USD Million) By Applications (2018-2022)
Table 28 Middle East and Africa Femtech Revenue (USD Million) By Region (2018-2022)
Table 29 Middle East and Africa Femtech Revenue (USD Million) By Type (2018-2022)
Table 30 Middle East and Africa Femtech Revenue (USD Million) By Applications (2018-2022)
Table 31 Financial Analysis
Table 32 Global Femtech Revenue (USD Million) By Type (2023-2030)
Table 33 Global Femtech Revenue Market Share (%) By Type (2023-2030)
Table 34 Global Femtech Revenue (USD Million) By Applications (2023-2030)
Table 35 Global Femtech Revenue Market Share (%) By Applications (2023-2030)
Table 36 Global Femtech Market Revenue (USD Million), And Revenue (USD Million) By Regions (2023-2030)
Table 37 North America Femtech Revenue (USD)By Country (2023-2030)
Table 38 North America Femtech Revenue (USD Million) By Type (2023-2030)
Table 39 North America Femtech Revenue (USD Million) By Applications (2023-2030)
Table 40 Europe Femtech Revenue (USD Million) By Country (2023-2030)
Table 41 Europe Femtech Revenue (USD Million) By Type (2023-2030)
Table 42 Europe Femtech Revenue (USD Million) By Applications (2023-2030)
Table 43 Asia Pacific Femtech Revenue (USD Million) By Country (2023-2030)
Table 44 Asia Pacific Femtech Revenue (USD Million) By Type (2023-2030)
Table 45 Asia Pacific Femtech Revenue (USD Million) By Applications (2023-2030)
Table 46 South America Femtech Revenue (USD Million) By Country (2023-2030)
Table 47 South America Femtech Revenue (USD Million) By Type (2023-2030)
Table 48 South America Femtech Revenue (USD Million) By Applications (2023-2030)
Table 49 Middle East and Africa Femtech Revenue (USD Million) By Region (2023-2030)
Table 50 Middle East and Africa Femtech Revenue (USD Million) By Region (2023-2030)
Table 51 Middle East and Africa Femtech Revenue (USD Million) By Type (2023-2030)
Table 52 Middle East and Africa Femtech Revenue (USD Million) By Applications (2023-2030)
Table 53 Research Programs/Design for This Report
Table 54 Key Data Information from Secondary Sources
Table 55 Key Data Information from Primary Sources
List of Figures
Figure 1 Market Scope
Figure 2 Porter’s Five Forces
Figure 3 Global Femtech Revenue (USD Million) By Type (2018-2022)
Figure 4 Global Femtech Revenue Market Share (%) By Type (2022)
Figure 5 Global Femtech Revenue (USD Million) By Applications (2018-2022)
Figure 6 Global Femtech Revenue Market Share (%) By Applications (2022)
Figure 7 Global Femtech Market Revenue (USD Million) By Regions (2018-2022)
Figure 8 Global Femtech Market Share (%) By Regions (2022)
Figure 9 North America Femtech Revenue (USD Million) By Country (2018-2022)
Figure 10 North America Femtech Revenue (USD Million) By Type (2018-2022)
Figure 11 North America Femtech Revenue (USD Million) By Applications (2018-2022)
Figure 12 Europe Femtech Revenue (USD Million) By Country (2018-2022)
Figure 13 Europe Femtech Revenue (USD Million) By Type (2018-2022)
Figure 14 Europe Femtech Revenue (USD Million) By Applications (2018-2022)
Figure 15 Asia Pacific Femtech Revenue (USD Million) By Country (2018-2022)
Figure 16 Asia Pacific Femtech Revenue (USD Million) By Type (2018-2022)
Figure 17 Asia Pacific Femtech Revenue (USD Million) By Applications (2018-2022)
Figure 18 South America Femtech Revenue (USD Million) By Country (2018-2022)
Figure 19 South America Femtech Revenue (USD Million) By Type (2018-2022)
Figure 20 South America Femtech Revenue (USD Million) By Applications (2018-2022)
Figure 21 Middle East and Africa Femtech Revenue (USD Million) By Region (2018-2022)
Figure 22 Middle East and Africa Femtech Revenue (USD Million) By Type (2018-2022)
Figure 23 Middle East and Africa Femtech Revenue (USD Million) By Applications (2018-2022)
Figure 24 Global Femtech Revenue (USD Million) By Type (2023-2030)
Figure 25 Global Femtech Revenue Market Share (%) By Type (2030)
Figure 26 Global Femtech Revenue (USD Million) By Applications (2023-2030)
Figure 27 Global Femtech Revenue Market Share (%) By Applications (2030)
Figure 28 Global Femtech Market Revenue (USD Million) By Regions (2023-2030)
Figure 29 North America Femtech Revenue (USD Million) By Country (2023-2030)
Figure 30 North America Femtech Revenue (USD Million) By Type (2023-2030)
Figure 31 North America Femtech Revenue (USD Million) By Applications (2023-2030)
Figure 32 Europe Femtech Revenue (USD Million) By Country (2023-2030)
Figure 33 Europe Femtech Revenue (USD Million) By Type (2023-2030)
Figure 34 Europe Femtech Revenue (USD Million) By Applications (2023-2030)
Figure 35 Asia Pacific Femtech Revenue (USD Million) By Country (2023-2030)
Figure 36 Asia Pacific Femtech Revenue (USD Million) By Type (2023-2030)
Figure 37 Asia Pacific Femtech Revenue (USD Million) By Applications (2023-2030)
Figure 38 South America Femtech Revenue (USD Million) By Country (2023-2030)
Figure 39 South America Femtech Revenue (USD Million) By Type (2023-2030)
Figure 40 South America Femtech Revenue (USD Million) By Applications (2023-2030)
Figure 41 Middle East and Africa Femtech Revenue (USD Million) By Region (2023-2030)
Figure 42 Middle East and Africa Femtech Revenue (USD Million) By Region (2023-2030)
Figure 43 Middle East and Africa Femtech Revenue (USD Million) By Type (2023-2030)
Figure 44 Middle East and Africa Femtech Revenue (USD Million) By Applications (2023-2030)
Figure 45 Bottom-Up and Top-Down Approaches for This Report
Figure 46 Data Triangulation
