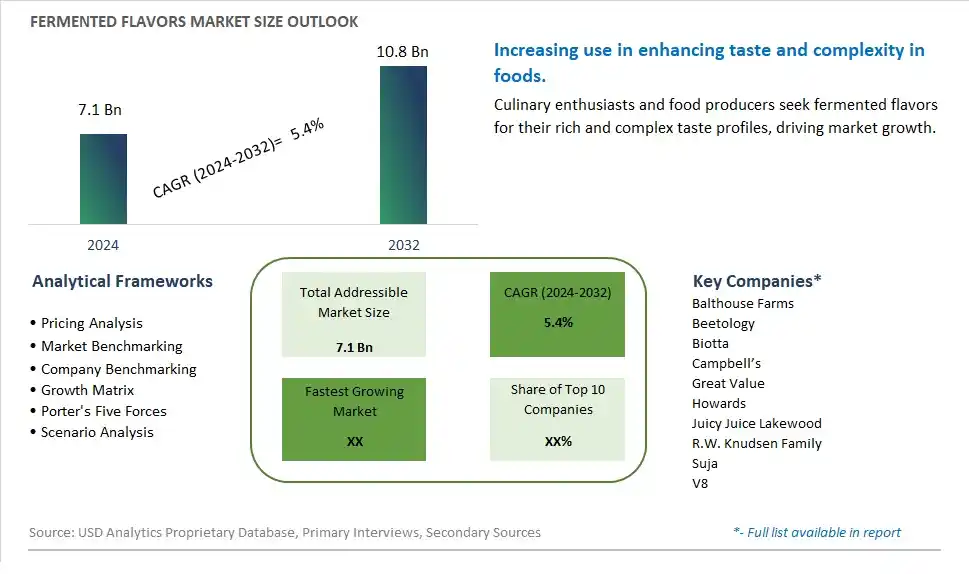
Global Fermented Flavors Market Size is valued at $7.1 Billion in 2024 and is forecast to register a growth rate (CAGR) of 5.4% to reach $10.8 Billion by 2032.
The global Fermented Flavors Market Comprehensive Study analyzes and forecasts the market size across 6 regions and 24 countries for diverse segments -By Application (Food, Beverages, -Alcoholic Beverage, -Non-Alcoholic Beverage, Feed, Pharmaceutical), By Type (Acetic Acid Bacteria, Lactic Acid Bacteria)
An Introduction to Fermented Flavors Market
The Fermented Flavors market in 2024 is experiencing robust growth, driven by the increasing demand for natural and complex flavors in the food and beverage industry. Fermented flavors, produced through microbial fermentation processes, are used to enhance the taste and aroma of products such as sauces, snacks, and beverages. The market benefits from advancements in fermentation technologies, the growing trend of clean label and natural ingredients, and the expansion of the gourmet and specialty food sectors. Additionally, the rising popularity of fermented foods and the associated health benefits are contributing to market growth.
Fermented Flavors Competitive Landscape
The market report analyses the leading companies in the industry including Balthouse Farms, Beetology, Biotta, Campbell’s, Great Value, Howards , Juicy Juice Lakewood, R.W. Knudsen Family, Suja, V8, and Others.
Fermented Flavors Market Dynamics
Fermented Flavors Market Trend: Growing Demand for Natural and Authentic Flavors
The market for fermented flavors is experiencing a prominent trend driven by the growing consumer preference for natural and authentic flavors in food and beverages. Fermentation processes create complex and rich flavor profiles that are sought after by consumers looking for unique culinary experiences. The trend towards clean label products and the desire for minimally processed ingredients has led to an increased demand for fermented flavors across various food and beverage categories.
Fermented Flavors Market Driver: Shift Towards Healthier and Functional Ingredients
A major driver for the fermented flavors market is the global shift towards healthier and functional ingredients in food and beverage products. Fermented flavors offer not only unique taste profiles but also potential health benefits such as improved digestion and gut health due to their probiotic nature. As consumers become more health-conscious and seek functional foods, the demand for fermented flavors as natural and beneficial ingredients continues to rise, driving innovation and product development in the food industry.
Fermented Flavors Market Opportunity: Expansion in Specialty and Craft Beverages
The fermented flavors market presents a significant opportunity for expansion in specialty and craft beverages. Manufacturers can capitalize on this opportunity by incorporating fermented flavors into a wide range of beverages such as kombucha, craft beers, artisanal sodas, and flavored waters. The unique taste and health benefits of fermented flavors can attract consumers looking for innovative and premium beverage options. Additionally, there is potential for collaboration with mixologists, breweries, and beverage brands to create signature drinks and unique flavor combinations, tapping into the growing market for artisanal and experiential beverages.
Fermented Flavors Market Share Analysis: Food segment generated the highest revenue share in the industry
The Food segment is the largest in the Fermented Flavors market. This dominance is primarily due to the widespread use of fermented flavors across a diverse range of food products, from dairy to bakery items, condiments, and snacks. The popularity of fermented flavors in the food industry is driven by their ability to enhance taste profiles with complex, rich flavors that cater to the evolving palate of consumers seeking gourmet and authentic culinary experiences. Additionally, the health benefits associated with fermented products, such as improved digestion and enhanced nutrient absorption, appeal to the growing health-conscious consumer base. The segment's growth is further fueled by the global trend toward natural and clean-label products, as fermented flavors are often perceived as a natural way to add depth and intensity to food without the use of artificial additives. The demand in the food industry for innovative flavor solutions that also meet nutritional standards is expected to keep the Food segment as the largest in the fermented flavors market.
Fermented Flavors Market Share Analysis: Lactic Acid Bacteria is the fastest growing segment over the forecast period to 2032
Lactic Acid Bacteria (LAB) is anticipated to be the fastest-growing segment in the Fermented Flavors market by 2032. This rapid growth is primarily driven by the increasing demand for natural and health-promoting ingredients in both food and beverage applications. LAB is widely recognized for its ability to improve gut health, enhance the immune system, and increase the nutritional value of foods, which aligns well with the global trend towards healthier eating habits. Furthermore, lactic acid bacteria play a crucial role in the fermentation process, contributing unique flavors and textures to a variety of products, including yogurts, cheeses, and sourdough breads. The versatility of LAB in enhancing flavor while also offering probiotic benefits makes it particularly attractive to food manufacturers looking to meet consumer demands for functional foods. Additionally, the growing popularity of fermented beverages and plant-based dairy alternatives is expected to further boost the demand for lactic acid bacteria, positioning it as the segment with the fastest growth potential in the fermented flavors market heading towards 2032.
Fermented Flavors Market Segmentation
By Application
Food
Beverages
-Alcoholic Beverage
-Non-Alcoholic Beverage
Feed
Pharmaceutical
By Type
Acetic Acid Bacteria
Lactic Acid Bacteria
Countries Analyzed
North America (US, Canada, Mexico)
Europe (Germany, UK, France, Spain, Italy, Russia, Rest of Europe)
Asia Pacific (China, India, Japan, South Korea, Australia, South East Asia, Rest of Asia)
South America (Brazil, Argentina, Rest of South America)
Middle East and Africa (Saudi Arabia, UAE, Rest of Middle East, South Africa, Egypt, Rest of Africa)
Fermented Flavors Companies Profiled in the Study
Balthouse Farms
Beetology
Biotta
Campbell’s
Great Value
Howards
Juicy Juice Lakewood
R.W. Knudsen Family
Suja
V8
*- List Not Exhaustive
Chapter 1. TABLE OF CONTENTS
Chapter 2. Introduction to Fermented Flavors Market
2.1. Market Overview
2.2. Key Statistics and Report Highlights
2.3. Scope of the Comprehensive Study
2.3.1. Market Definition
2.3.2 Countries and Regions Covered
2.3.3 Research Objective
2.3.4 Units, Currency, and Conversions
2.3.5 Industry Value Chain
2.4. Key Market Segments
2.5. Key Companies
2.6. Study Period
Chapter 3. Strategic Analysis Review
3.1. Fermented Flavors Pricing Analysis and Forecast
3.2. Porter’s Five Forces
3.3. Market Ecosystem
3.4. SWOT Analysis
3.5. Regulatory Scenario
3.3. Effects of Inflation, Russia-Ukraine War, moderating economic growth, and other macroeconomic factors
Chapter 4. Competitive Landscape
4.1. Market Share Analysis
4.1.1. Global Fermented Flavors Market Share by Company, 2023
4.1.2. Product Offerings of Leading Fermented Flavors Companies
4.2. Market Entropy
4.2.1. New Product Launches in the Industry
4.2.2. Mergers, Acquisitions, Joint ventures, and Partnerships
4.3. Key Strategies and Best Practices
Chapter 5. Global Market Projections: Best, Reference, and Low Case Scenarios
5.1. Growth Analysis- Case Scenario Definitions
5.2. Low Growth Case Scenario Forecasts
5.3. Reference Growth Case Scenario Forecasts
5.4. High Growth Case Scenario Forecasts
Chapter 6. Market Dynamics
6.1. Fermented Flavors Market Drivers
6.2. Fermented Flavors Market Challenges
6.6. Fermented Flavors Market Opportunities
6.4. Fermented Flavors Market Trends
Chapter 7. Global Fermented Flavors Market Outlook Trends
7.1. Global Fermented Flavors Revenue (USD Million) and CAGR (%) by Type (2021-2032)
7.2. Global Fermented Flavors Revenue (USD Million) and CAGR (%) by Application (2021-2032)
7.3. Global Fermented Flavors Revenue (USD Million) and CAGR (%) by Product (2021-2032)
By Application
Food
Beverages
-Alcoholic Beverage
-Non-Alcoholic Beverage
Feed
Pharmaceutical
By Type
Acetic Acid Bacteria
Lactic Acid Bacteria
Chapter 8. Global Fermented Flavors Regional Analysis and Outlook
8.1. Global Fermented Flavors Revenue (USD Million) By Regions (2021- 2032)
8.2. North America Fermented Flavors Revenue (USD Million) by Country (2021-2032)
8.2.1. United States Fermented Flavors Regional Analysis and Outlook
8.2.2. Canada Fermented Flavors Regional Analysis and Outlook
8.2.3. Mexico Fermented Flavors Regional Analysis and Outlook
8.3. Europe Fermented Flavors Revenue (USD Million), by Country (2021-2032)
8.3.1. Germany Fermented Flavors Regional Analysis and Outlook
8.3.2. France Fermented Flavors Regional Analysis and Outlook
8.3.3. United Kingdom Fermented Flavors Regional Analysis and Outlook
8.3.4. Spain Fermented Flavors Regional Analysis and Outlook
8.3.5. Italy Fermented Flavors Regional Analysis and Outlook
8.3.6. Russia Fermented Flavors Regional Analysis and Outlook
8.3.7. Rest of Europe Fermented Flavors Regional Analysis and Outlook
8.4. Asia Pacific Fermented Flavors Revenue (USD Million) by Country (2021-2032)
8.4.1. China Fermented Flavors Regional Analysis and Outlook
8.4.2. Japan Fermented Flavors Regional Analysis and Outlook
8.4.3. India Fermented Flavors Regional Analysis and Outlook
8.4.4. South Korea Fermented Flavors Regional Analysis and Outlook
8.4.5. Australia Fermented Flavors Regional Analysis and Outlook
8.4.6. South East Asia Fermented Flavors Regional Analysis and Outlook
8.4.7. Rest of Asia Pacific Fermented Flavors Regional Analysis and Outlook
8.5. South America Fermented Flavors Revenue (USD Million), by Country (2021-2032)
8.5.1. Brazil Fermented Flavors Regional Analysis and Outlook
8.5.2. Argentina Fermented Flavors Regional Analysis and Outlook
8.5.3. Rest of South America Fermented Flavors Regional Analysis and Outlook
8.6. Middle East and Africa Fermented Flavors Revenue (USD Million) by Country (2021-2032)
8.6.1. Middle East Fermented Flavors Regional Analysis and Outlook
8.6.2. Africa Fermented Flavors Regional Analysis and Outlook
Chapter 9. North America Fermented Flavors Analysis and Outlook
9.1. North America Fermented Flavors Revenue (USD Million) by Segments (2021-2032)
9.1.1. North America Fermented Flavors Revenue (USD Million) by Type (2021-2032)
9.1.2. North America Fermented Flavors Revenue (USD Million) by Application (2021-2032)
9.1.3. North America Fermented Flavors Revenue (USD Million) by Product (2021-2032)
By Application
Food
Beverages
-Alcoholic Beverage
-Non-Alcoholic Beverage
Feed
Pharmaceutical
By Type
Acetic Acid Bacteria
Lactic Acid Bacteria
Chapter 10. Europe Fermented Flavors Analysis and Outlook
10.1. Europe Fermented Flavors Revenue (USD Million), by Segments (USD Million) (2021-2032)
10.1.1. Europe Fermented Flavors Revenue (USD Million) by Type (2021-2032)
10.1.2. Europe Fermented Flavors Revenue (USD Million) by Application (2021-2032)
10.1.3. Europe Fermented Flavors Revenue (USD Million) by Product (2021-2032)
By Application
Food
Beverages
-Alcoholic Beverage
-Non-Alcoholic Beverage
Feed
Pharmaceutical
By Type
Acetic Acid Bacteria
Lactic Acid Bacteria
Chapter 11. Asia Pacific Fermented Flavors Analysis and Outlook
11.1. Asia Pacific Fermented Flavors Revenue (USD Million), and Revenue (USD Million) by Segments (2021-2032)
11.1.1. Asia Pacific Fermented Flavors Revenue (USD Million) by Type (2021-2032)
11.1.2. Asia Pacific Fermented Flavors Revenue (USD Million) by Application (2021-2032)
11.1.3. Asia Pacific Fermented Flavors Revenue (USD Million) by Product (2021-2032)
By Application
Food
Beverages
-Alcoholic Beverage
-Non-Alcoholic Beverage
Feed
Pharmaceutical
By Type
Acetic Acid Bacteria
Lactic Acid Bacteria
Chapter 12. South America Fermented Flavors Analysis and Outlook
12.1. South America Fermented Flavors Revenue (USD Million), by Segments (2021-2032)
12.1.1. South America Fermented Flavors Revenue (USD Million) by Type (2021-2032)
12.1.2. South America Fermented Flavors Revenue (USD Million) by Application (2021-2032)
12.1.3. South America Fermented Flavors Revenue (USD Million) by Product (2021-2032)
By Application
Food
Beverages
-Alcoholic Beverage
-Non-Alcoholic Beverage
Feed
Pharmaceutical
By Type
Acetic Acid Bacteria
Lactic Acid Bacteria
Chapter 13. Middle East and Africa Fermented Flavors Analysis and Outlook
13.1. Middle East and Africa Fermented Flavors Revenue (USD Million), by Segments (2021-2032)
13.1.1. Middle East and Africa Fermented Flavors Revenue (USD Million) by Type (2021-2032)
13.1.2. Middle East and Africa Fermented Flavors Revenue (USD Million) by Application (2021-2032)
13.1.3. Middle East and Africa Fermented Flavors Revenue (USD Million) by Product (2021-2032)
By Application
Food
Beverages
-Alcoholic Beverage
-Non-Alcoholic Beverage
Feed
Pharmaceutical
By Type
Acetic Acid Bacteria
Lactic Acid Bacteria
Chapter 14. Fermented Flavors Company Profiles
14.1 Business Overview
14.2 Product Profiles
14.3 SWOT Profiles
14.5 Recent Developments
14.6 Financial Profile
List of Companies
Balthouse Farms
Beetology
Biotta
Campbell’s
Great Value
Howards
Juicy Juice Lakewood
R.W. Knudsen Family
Suja
V8
15. Methodology and Data Sources
15.1 Customization Offerings
15.2 Subscription Services
15.3 Related Reports
15.4 Publisher Expertise
LIST OF TABLES
Table 1 Market Segmentation Analysis
Table 2 Global Fermented Flavors Market Share of Leading Companies, 2023
Table 3 Product Offerings of Leading Companies
Table 4 Low Growth Scenario Forecasts
Table 5 Reference Case Growth Scenario
Table 6 High Growth Case Scenario
Table 7 Global Fermented Flavors Revenue (USD Million) And CAGR (%) By Type (2021-2032)
Table 8 Global Fermented Flavors Revenue (USD Million) And CAGR (%) By Application (2021-2032)
Table 9 Global Fermented Flavors Revenue (USD Million) And CAGR (%) By Product (2021-2032)
Table 10 Global Fermented Flavors Market Revenue (USD Million) By Regions (2021-2032)
Table 11 Global Fermented Flavors Market Share (%) By Regions (2021-2032)
Table 12 North America Fermented Flavors Revenue (USD Million) By Country (2021-2032)
Table 13 Europe Fermented Flavors Revenue (USD Million) By Country (2021-2032)
Table 14 Asia Pacific Fermented Flavors Revenue (USD Million) By Country (2021-2032)
Table 15 South America Fermented Flavors Revenue (USD Million) By Country (2021-2032)
Table 16 Middle East and Africa Fermented Flavors Revenue (USD Million) By Region (2021-2032)
Table 17 North America Fermented Flavors Revenue (USD Million) By Type (2021-2032)
Table 18 North America Fermented Flavors Revenue (USD Million) By Application (2021-2032)
Table 19 North America Fermented Flavors Revenue (USD Million) By Product (2021-2032)
Table 20 Europe Fermented Flavors Revenue (USD Million) By Type (2021-2032)
Table 21 Europe Fermented Flavors Revenue (USD Million) By Application (2021-2032)
Table 22 Europe Fermented Flavors Revenue (USD Million) By Product (2021-2032)
Table 23 Asia Pacific Fermented Flavors Revenue (USD Million) By Type (2021-2032)
Table 24 Asia Pacific Fermented Flavors Revenue (USD Million) By Application (2021-2032)
Table 25 Asia Pacific Fermented Flavors Revenue (USD Million) By Product (2021-2032)
Table 26 South America Fermented Flavors Revenue (USD Million) By Type (2021-2032)
Table 27 South America Fermented Flavors Revenue (USD Million) By Application (2021-2032)
Table 28 South America Fermented Flavors Revenue (USD Million) By Product (2021-2032)
Table 29 Middle East and Africa Fermented Flavors Revenue (USD Million) By Type (2021-2032)
Table 30 Middle East and Africa Fermented Flavors Revenue (USD Million) By Application (2021-2032)
Table 31 Middle East and Africa Fermented Flavors Revenue (USD Million) By Product (2021-2032)
LIST OF FIGURES
Figure 1. Market Scope
Figure 2. Pricing Forecasts Per Unit, 2023- 2032
Figure 3. Porter’s Five Forces
Figure 4. Global Fermented Flavors Market Revenue (USD Million) By Regions (2021-2032)
Figure 5. Global Fermented Flavors Market Share (%) By Regions (2023)
Figure 6. North America Fermented Flavors Revenue (USD Million) By Country (2021-2032)
Figure 7. United States Fermented Flavors Revenue (USD Million) By Country (2021-2032)
Figure 8. Canada Fermented Flavors Revenue (USD Million) By Country (2021-2032)
Figure 9. Mexico Fermented Flavors Revenue (USD Million) By Country (2021-2032)
Figure 10. Europe Fermented Flavors Revenue (USD Million) By Country (2021-2032)
Figure 11. Germany Fermented Flavors Revenue (USD Million) By Country (2021-2032)
Figure 12. France Fermented Flavors Revenue (USD Million) By Country (2021-2032)
Figure 13. United Kingdom Fermented Flavors Revenue (USD Million) By Country (2021-2032)
Figure 14. Spain Fermented Flavors Revenue (USD Million) By Country (2021-2032)
Figure 15. Italy Fermented Flavors Revenue (USD Million) By Country (2021-2032)
Figure 16. Russia Fermented Flavors Revenue (USD Million) By Country (2021-2032)
Figure 17. Rest of Europe Fermented Flavors Revenue (USD Million) By Country (2021-2032)
Figure 11. Asia Pacific Fermented Flavors Revenue (USD Million) By Country (2021-2032)
Figure 12. China Fermented Flavors Revenue (USD Million) By Country (2021-2032)
Figure 13. Japan Fermented Flavors Revenue (USD Million) By Country (2021-2032)
Figure 14. India Fermented Flavors Revenue (USD Million) By Country (2021-2032)
Figure 15. South Korea Fermented Flavors Revenue (USD Million) By Country (2021-2032)
Figure 16. Australia Fermented Flavors Revenue (USD Million) By Country (2021-2032)
Figure 17. South East Asia Fermented Flavors Revenue (USD Million) By Country (2021-2032)
Figure 18. South America Fermented Flavors Revenue (USD Million) By Country (2021-2032)
Figure 19. Brazil Fermented Flavors Revenue (USD Million) By Country (2021-2032)
Figure 20. Argentina Fermented Flavors Revenue (USD Million) By Country (2021-2032)
Figure 21. Rest of Asia Pacific Fermented Flavors Revenue (USD Million) By Country (2021-2032)
Figure 22. Middle East and Africa Fermented Flavors Revenue (USD Million) By Region (2021-2032)
Figure 23. Saudi Arabia Fermented Flavors Revenue (USD Million) By Region (2021-2032)
Figure 24. The UAE Fermented Flavors Revenue (USD Million) By Region (2021-2032)
Figure 25. Rest of Middle East Fermented Flavors Revenue (USD Million) By Region (2021-2032)
Figure 26. South Africa Fermented Flavors Revenue (USD Million) By Region (2021-2032)
Figure 27. Africa Fermented Flavors Revenue (USD Million) By Region (2021-2032)
Figure 28. North America Fermented Flavors Revenue (USD Million) By Type (2021-2032)
Figure 29. North America Fermented Flavors Revenue (USD Million) By Application (2021-2032)
Figure 30. North America Fermented Flavors Revenue (USD Million) By Product (2021-2032)
Figure 31. Europe Fermented Flavors Revenue (USD Million) By Type (2021-2032)
Figure 32. Europe Fermented Flavors Revenue (USD Million) By Application (2021-2032)
Figure 33. Europe Fermented Flavors Revenue (USD Million) By Product (2021-2032)
Figure 34. Asia Pacific Fermented Flavors Revenue (USD Million) By Type (2021-2032)
Figure 35. Asia Pacific Fermented Flavors Revenue (USD Million) By Application (2021-2032)
Figure 36. Asia Pacific Fermented Flavors Revenue (USD Million) By Product (2021-2032)
Figure 37. South America Fermented Flavors Revenue (USD Million) By Type (2021-2032)
Figure 38. South America Fermented Flavors Revenue (USD Million) By Application (2021-2032)
Figure 39. South America Fermented Flavors Revenue (USD Million) By Product (2021-2032)
Figure 40. Middle East and Africa Fermented Flavors Revenue (USD Million) By Type (2021-2032)
Figure 41. Middle East and Africa Fermented Flavors Revenue (USD Million) By Application (2021-2032)
Figure 42. Middle East and Africa Fermented Flavors Revenue (USD Million) By Product (2021-2032)
By Application
Food
Beverages
-Alcoholic Beverage
-Non-Alcoholic Beverage
Feed
Pharmaceutical
By Type
Acetic Acid Bacteria
Lactic Acid Bacteria
Countries Analyzed
North America (US, Canada, Mexico)
Europe (Germany, UK, France, Spain, Italy, Russia, Rest of Europe)
Asia Pacific (China, India, Japan, South Korea, Australia, South East Asia, Rest of Asia)
South America (Brazil, Argentina, Rest of South America)
Middle East and Africa (Saudi Arabia, UAE, Rest of Middle East, South Africa, Egypt, Rest of Africa)
