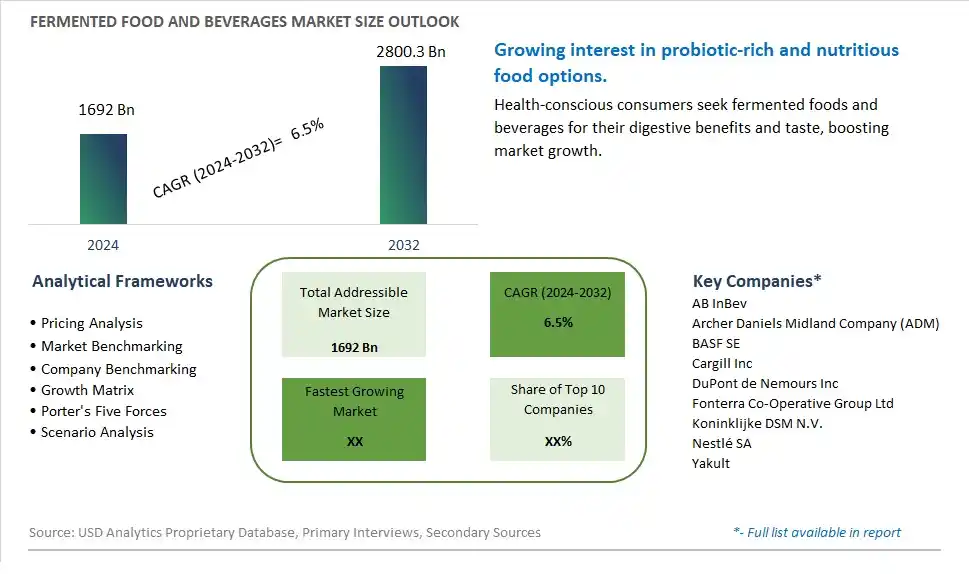
Global Fermented Food and Beverages Market Size is valued at $1692 Billion in 2024 and is forecast to register a growth rate (CAGR) of 6.5% to reach $2800.3 Billion by 2032.
The global Fermented Food and Beverages Market Comprehensive Study analyzes and forecasts the market size across 6 regions and 24 countries for diverse segments -By Ingredient (Prebiotics, Probiotics, Vitamins, Industrial Enzymes, Organic Acid, Amino Acids, Others), By Fermentation Process (Anaerobic Fermentation, Aerobic Fermentation, Continuous Fermentation, Batch Fermentation, Others), By End-User (Bakery & Confectionery, Dairy Products, Alcoholic Beverages, Non-alcoholic Beverages, Infant Formula, Dietary Supplements, Vegetables and Meat, Animal Feed Products, Fermented Chilli Sauce, Fermented Fish Sauce, Others)
An Introduction to Fermented Food and Beverages Market
In 2024, the Fermented Food and Beverages market is witnessing significant growth, driven by the rising demand for probiotic-rich and naturally preserved products. Fermented foods and beverages, including yogurt, kimchi, kombucha, and sauerkraut, are popular for their health benefits and unique flavors. The market benefits from advancements in fermentation technologies, the growing trend of gut health and wellness, and the expansion of the functional food and beverage sectors. Additionally, the increasing awareness of the benefits of probiotics and the popularity of traditional fermented foods are contributing to market growth.
Fermented Food and Beverages Competitive Landscape
The market report analyses the leading companies in the industry including AB InBev, Archer Daniels Midland Company (ADM), BASF SE, Cargill Inc, DuPont de Nemours Inc, Fonterra Co-Operative Group Ltd, Koninklijke DSM N.V., Nestlé SA, Yakult, and Others.
Fermented Food and Beverages Market Dynamics
Fermented Food and Beverages Market Trend: Rising Consumer Interest in Gut Health and Probiotics
The market for fermented food and beverages is witnessing a prominent trend driven by the increasing consumer awareness and interest in gut health and probiotics. Fermented products like yogurt, kimchi, kombucha, and kefir are gaining popularity due to their probiotic content, which supports digestive health and immune function. Consumers are actively seeking out fermented options as they recognize the connection between gut health and overall well-being, leading to a growing demand for fermented food and beverage products.
Fermented Food and Beverages Market Driver: Health and Wellness Consciousness
A major driver for the fermented food and beverages market is the growing focus on health and wellness among consumers. Fermented products are perceived as natural, nutritious, and beneficial for digestive health due to their probiotic content. As more consumers prioritize functional foods and beverages that offer tangible health benefits, the demand for fermented options continues to expand. Additionally, the association of fermented foods with traditional and artisanal preparation methods adds to their appeal, driving consumer interest and market growth.
Fermented Food and Beverages Market Opportunity: Diversification and Innovation in Product Offerings
The fermented food and beverages market presents a significant opportunity for diversification and innovation in product offerings. Manufacturers can capitalize on this opportunity by introducing new flavors, ingredients, and formulations to cater to diverse consumer preferences and dietary requirements. There is potential for developing fermented products targeted at specific health concerns, such as gut health support, immune system boosting, or mental wellness. Collaborations with nutritionists, chefs, and health experts can also lead to the creation of functional and appealing fermented food and beverage options, expanding market reach and driving consumer adoption.
Fermented Food and Beverages Market Share Analysis: Probiotics segment generated the highest revenue share in the industry
Probiotics are the largest segment in the Fermented Food and Beverages market. This prominence stems from the increasing consumer awareness of the health benefits associated with probiotics, such as improved gut health, enhanced immune response, and better nutrient absorption. Probiotics are live microorganisms that, when administered in adequate amounts, confer a health benefit on the host. They are key ingredients in popular fermented foods and beverages like yogurt, kefir, sauerkraut, and kombucha. The demand for probiotics is driven by the growing trend towards functional foods that not only satisfy hunger but also offer specific health benefits. This segment's expansion is further fueled by ongoing research that continues to uncover new health benefits associated with probiotics, thereby encouraging more consumers to incorporate these products into their daily diets. Additionally, the rise in digestive health issues, along with an increased interest in natural and organic ingredients, has significantly contributed to the growth and dominance of the probiotics segment in the market.
Fermented Food and Beverages Market Share Analysis: Continuous Fermentation is the fastest growing segment over the forecast period to 2032
Continuous Fermentation is projected to be the fastest-growing segment in the Fermented Food and Beverages market by 2032. This method of fermentation is increasingly preferred due to its efficiency and scalability, which are critical in meeting the rising global demand for fermented products. Continuous fermentation allows for the uninterrupted production of fermented foods and beverages, significantly reducing downtime and enhancing productivity. This process is particularly advantageous for the production of beverages like beer and kombucha, where it ensures consistent product quality and flavor. The adoption of continuous fermentation is also driven by technological advancements that allow for better control and optimization of the fermentation conditions, resulting in higher yields and reduced production costs. As manufacturers increasingly focus on sustainability and efficiency, continuous fermentation offers a solution that minimizes waste and energy consumption, making it a key growth area in the industry as it aligns with both economic and environmental goals.
Fermented Food and Beverages Market Share Analysis: Dairy Products segment generated the highest revenue share in the industry
Dairy Products represent the largest segment in the Fermented Food and Beverages market. This segment's dominance is driven by the extensive consumption of fermented dairy products such as yogurt, kefir, and cheese, which are staple foods in many diets around the world. Fermented dairy products are highly valued for their probiotic content, which plays a crucial role in improving gut health and enhancing the immune system. The demand for these products continues to grow as consumers become more health-conscious and seek foods that offer both nutritional and functional benefits. Furthermore, innovations in flavor and product diversification, such as the introduction of plant-based and lactose-free fermented dairy alternatives, cater to a broader audience, including those with dietary restrictions or preferences. This segment's growth is bolstered by both traditional consumption patterns and modern dietary trends, ensuring its continued dominance in the market.
Fermented Food and Beverages Market Segmentation
By Ingredient
Prebiotics
Probiotics
Vitamins
Industrial Enzymes
Organic Acid
Amino Acids
Others
By Fermentation Process
Anaerobic Fermentation
Aerobic Fermentation
Continuous Fermentation
Batch Fermentation
Others
By End-User
Bakery & Confectionery
Dairy Products
Alcoholic Beverages
Non-alcoholic Beverages
Infant Formula
Dietary Supplements
Vegetables and Meat
Animal Feed Products
Fermented Chilli Sauce
Fermented Fish Sauce
Others
Countries Analyzed
North America (US, Canada, Mexico)
Europe (Germany, UK, France, Spain, Italy, Russia, Rest of Europe)
Asia Pacific (China, India, Japan, South Korea, Australia, South East Asia, Rest of Asia)
South America (Brazil, Argentina, Rest of South America)
Middle East and Africa (Saudi Arabia, UAE, Rest of Middle East, South Africa, Egypt, Rest of Africa)
Fermented Food and Beverages Companies Profiled in the Study
AB InBev
Archer Daniels Midland Company (ADM)
BASF SE
Cargill Inc
DuPont de Nemours Inc
Fonterra Co-Operative Group Ltd
Koninklijke DSM N.V.
Nestlé SA
Yakult
*- List Not Exhaustive
Chapter 1. TABLE OF CONTENTS
Chapter 2. Introduction to Fermented Food and Beverages Market
2.1. Market Overview
2.2. Key Statistics and Report Highlights
2.3. Scope of the Comprehensive Study
2.3.1. Market Definition
2.3.2 Countries and Regions Covered
2.3.3 Research Objective
2.3.4 Units, Currency, and Conversions
2.3.5 Industry Value Chain
2.4. Key Market Segments
2.5. Key Companies
2.6. Study Period
Chapter 3. Strategic Analysis Review
3.1. Fermented Food and Beverages Pricing Analysis and Forecast
3.2. Porter’s Five Forces
3.3. Market Ecosystem
3.4. SWOT Analysis
3.5. Regulatory Scenario
3.3. Effects of Inflation, Russia-Ukraine War, moderating economic growth, and other macroeconomic factors
Chapter 4. Competitive Landscape
4.1. Market Share Analysis
4.1.1. Global Fermented Food and Beverages Market Share by Company, 2023
4.1.2. Product Offerings of Leading Fermented Food and Beverages Companies
4.2. Market Entropy
4.2.1. New Product Launches in the Industry
4.2.2. Mergers, Acquisitions, Joint ventures, and Partnerships
4.3. Key Strategies and Best Practices
Chapter 5. Global Market Projections: Best, Reference, and Low Case Scenarios
5.1. Growth Analysis- Case Scenario Definitions
5.2. Low Growth Case Scenario Forecasts
5.3. Reference Growth Case Scenario Forecasts
5.4. High Growth Case Scenario Forecasts
Chapter 6. Market Dynamics
6.1. Fermented Food and Beverages Market Drivers
6.2. Fermented Food and Beverages Market Challenges
6.6. Fermented Food and Beverages Market Opportunities
6.4. Fermented Food and Beverages Market Trends
Chapter 7. Global Fermented Food and Beverages Market Outlook Trends
7.1. Global Fermented Food and Beverages Revenue (USD Million) and CAGR (%) by Type (2021-2032)
7.2. Global Fermented Food and Beverages Revenue (USD Million) and CAGR (%) by Application (2021-2032)
7.3. Global Fermented Food and Beverages Revenue (USD Million) and CAGR (%) by Product (2021-2032)
By Ingredient
Prebiotics
Probiotics
Vitamins
Industrial Enzymes
Organic Acid
Amino Acids
Others
By Fermentation Process
Anaerobic Fermentation
Aerobic Fermentation
Continuous Fermentation
Batch Fermentation
Others
By End-User
Bakery & Confectionery
Dairy Products
Alcoholic Beverages
Non-alcoholic Beverages
Infant Formula
Dietary Supplements
Vegetables and Meat
Animal Feed Products
Fermented Chilli Sauce
Fermented Fish Sauce
Others
Chapter 8. Global Fermented Food and Beverages Regional Analysis and Outlook
8.1. Global Fermented Food and Beverages Revenue (USD Million) By Regions (2021- 2032)
8.2. North America Fermented Food and Beverages Revenue (USD Million) by Country (2021-2032)
8.2.1. United States Fermented Food and Beverages Regional Analysis and Outlook
8.2.2. Canada Fermented Food and Beverages Regional Analysis and Outlook
8.2.3. Mexico Fermented Food and Beverages Regional Analysis and Outlook
8.3. Europe Fermented Food and Beverages Revenue (USD Million), by Country (2021-2032)
8.3.1. Germany Fermented Food and Beverages Regional Analysis and Outlook
8.3.2. France Fermented Food and Beverages Regional Analysis and Outlook
8.3.3. United Kingdom Fermented Food and Beverages Regional Analysis and Outlook
8.3.4. Spain Fermented Food and Beverages Regional Analysis and Outlook
8.3.5. Italy Fermented Food and Beverages Regional Analysis and Outlook
8.3.6. Russia Fermented Food and Beverages Regional Analysis and Outlook
8.3.7. Rest of Europe Fermented Food and Beverages Regional Analysis and Outlook
8.4. Asia Pacific Fermented Food and Beverages Revenue (USD Million) by Country (2021-2032)
8.4.1. China Fermented Food and Beverages Regional Analysis and Outlook
8.4.2. Japan Fermented Food and Beverages Regional Analysis and Outlook
8.4.3. India Fermented Food and Beverages Regional Analysis and Outlook
8.4.4. South Korea Fermented Food and Beverages Regional Analysis and Outlook
8.4.5. Australia Fermented Food and Beverages Regional Analysis and Outlook
8.4.6. South East Asia Fermented Food and Beverages Regional Analysis and Outlook
8.4.7. Rest of Asia Pacific Fermented Food and Beverages Regional Analysis and Outlook
8.5. South America Fermented Food and Beverages Revenue (USD Million), by Country (2021-2032)
8.5.1. Brazil Fermented Food and Beverages Regional Analysis and Outlook
8.5.2. Argentina Fermented Food and Beverages Regional Analysis and Outlook
8.5.3. Rest of South America Fermented Food and Beverages Regional Analysis and Outlook
8.6. Middle East and Africa Fermented Food and Beverages Revenue (USD Million) by Country (2021-2032)
8.6.1. Middle East Fermented Food and Beverages Regional Analysis and Outlook
8.6.2. Africa Fermented Food and Beverages Regional Analysis and Outlook
Chapter 9. North America Fermented Food and Beverages Analysis and Outlook
9.1. North America Fermented Food and Beverages Revenue (USD Million) by Segments (2021-2032)
9.1.1. North America Fermented Food and Beverages Revenue (USD Million) by Type (2021-2032)
9.1.2. North America Fermented Food and Beverages Revenue (USD Million) by Application (2021-2032)
9.1.3. North America Fermented Food and Beverages Revenue (USD Million) by Product (2021-2032)
By Ingredient
Prebiotics
Probiotics
Vitamins
Industrial Enzymes
Organic Acid
Amino Acids
Others
By Fermentation Process
Anaerobic Fermentation
Aerobic Fermentation
Continuous Fermentation
Batch Fermentation
Others
By End-User
Bakery & Confectionery
Dairy Products
Alcoholic Beverages
Non-alcoholic Beverages
Infant Formula
Dietary Supplements
Vegetables and Meat
Animal Feed Products
Fermented Chilli Sauce
Fermented Fish Sauce
Others
Chapter 10. Europe Fermented Food and Beverages Analysis and Outlook
10.1. Europe Fermented Food and Beverages Revenue (USD Million), by Segments (USD Million) (2021-2032)
10.1.1. Europe Fermented Food and Beverages Revenue (USD Million) by Type (2021-2032)
10.1.2. Europe Fermented Food and Beverages Revenue (USD Million) by Application (2021-2032)
10.1.3. Europe Fermented Food and Beverages Revenue (USD Million) by Product (2021-2032)
By Ingredient
Prebiotics
Probiotics
Vitamins
Industrial Enzymes
Organic Acid
Amino Acids
Others
By Fermentation Process
Anaerobic Fermentation
Aerobic Fermentation
Continuous Fermentation
Batch Fermentation
Others
By End-User
Bakery & Confectionery
Dairy Products
Alcoholic Beverages
Non-alcoholic Beverages
Infant Formula
Dietary Supplements
Vegetables and Meat
Animal Feed Products
Fermented Chilli Sauce
Fermented Fish Sauce
Others
Chapter 11. Asia Pacific Fermented Food and Beverages Analysis and Outlook
11.1. Asia Pacific Fermented Food and Beverages Revenue (USD Million), and Revenue (USD Million) by Segments (2021-2032)
11.1.1. Asia Pacific Fermented Food and Beverages Revenue (USD Million) by Type (2021-2032)
11.1.2. Asia Pacific Fermented Food and Beverages Revenue (USD Million) by Application (2021-2032)
11.1.3. Asia Pacific Fermented Food and Beverages Revenue (USD Million) by Product (2021-2032)
By Ingredient
Prebiotics
Probiotics
Vitamins
Industrial Enzymes
Organic Acid
Amino Acids
Others
By Fermentation Process
Anaerobic Fermentation
Aerobic Fermentation
Continuous Fermentation
Batch Fermentation
Others
By End-User
Bakery & Confectionery
Dairy Products
Alcoholic Beverages
Non-alcoholic Beverages
Infant Formula
Dietary Supplements
Vegetables and Meat
Animal Feed Products
Fermented Chilli Sauce
Fermented Fish Sauce
Others
Chapter 12. South America Fermented Food and Beverages Analysis and Outlook
12.1. South America Fermented Food and Beverages Revenue (USD Million), by Segments (2021-2032)
12.1.1. South America Fermented Food and Beverages Revenue (USD Million) by Type (2021-2032)
12.1.2. South America Fermented Food and Beverages Revenue (USD Million) by Application (2021-2032)
12.1.3. South America Fermented Food and Beverages Revenue (USD Million) by Product (2021-2032)
By Ingredient
Prebiotics
Probiotics
Vitamins
Industrial Enzymes
Organic Acid
Amino Acids
Others
By Fermentation Process
Anaerobic Fermentation
Aerobic Fermentation
Continuous Fermentation
Batch Fermentation
Others
By End-User
Bakery & Confectionery
Dairy Products
Alcoholic Beverages
Non-alcoholic Beverages
Infant Formula
Dietary Supplements
Vegetables and Meat
Animal Feed Products
Fermented Chilli Sauce
Fermented Fish Sauce
Others
Chapter 13. Middle East and Africa Fermented Food and Beverages Analysis and Outlook
13.1. Middle East and Africa Fermented Food and Beverages Revenue (USD Million), by Segments (2021-2032)
13.1.1. Middle East and Africa Fermented Food and Beverages Revenue (USD Million) by Type (2021-2032)
13.1.2. Middle East and Africa Fermented Food and Beverages Revenue (USD Million) by Application (2021-2032)
13.1.3. Middle East and Africa Fermented Food and Beverages Revenue (USD Million) by Product (2021-2032)
By Ingredient
Prebiotics
Probiotics
Vitamins
Industrial Enzymes
Organic Acid
Amino Acids
Others
By Fermentation Process
Anaerobic Fermentation
Aerobic Fermentation
Continuous Fermentation
Batch Fermentation
Others
By End-User
Bakery & Confectionery
Dairy Products
Alcoholic Beverages
Non-alcoholic Beverages
Infant Formula
Dietary Supplements
Vegetables and Meat
Animal Feed Products
Fermented Chilli Sauce
Fermented Fish Sauce
Others
Chapter 14. Fermented Food and Beverages Company Profiles
14.1 Business Overview
14.2 Product Profiles
14.3 SWOT Profiles
14.5 Recent Developments
14.6 Financial Profile
List of Companies
AB InBev
Archer Daniels Midland Company (ADM)
BASF SE
Cargill Inc
DuPont de Nemours Inc
Fonterra Co-Operative Group Ltd
Koninklijke DSM N.V.
Nestlé SA
Yakult
15. Methodology and Data Sources
15.1 Customization Offerings
15.2 Subscription Services
15.3 Related Reports
15.4 Publisher Expertise
LIST OF TABLES
Table 1 Market Segmentation Analysis
Table 2 Global Fermented Food and Beverages Market Share of Leading Companies, 2023
Table 3 Product Offerings of Leading Companies
Table 4 Low Growth Scenario Forecasts
Table 5 Reference Case Growth Scenario
Table 6 High Growth Case Scenario
Table 7 Global Fermented Food and Beverages Revenue (USD Million) And CAGR (%) By Type (2021-2032)
Table 8 Global Fermented Food and Beverages Revenue (USD Million) And CAGR (%) By Application (2021-2032)
Table 9 Global Fermented Food and Beverages Revenue (USD Million) And CAGR (%) By Product (2021-2032)
Table 10 Global Fermented Food and Beverages Market Revenue (USD Million) By Regions (2021-2032)
Table 11 Global Fermented Food and Beverages Market Share (%) By Regions (2021-2032)
Table 12 North America Fermented Food and Beverages Revenue (USD Million) By Country (2021-2032)
Table 13 Europe Fermented Food and Beverages Revenue (USD Million) By Country (2021-2032)
Table 14 Asia Pacific Fermented Food and Beverages Revenue (USD Million) By Country (2021-2032)
Table 15 South America Fermented Food and Beverages Revenue (USD Million) By Country (2021-2032)
Table 16 Middle East and Africa Fermented Food and Beverages Revenue (USD Million) By Region (2021-2032)
Table 17 North America Fermented Food and Beverages Revenue (USD Million) By Type (2021-2032)
Table 18 North America Fermented Food and Beverages Revenue (USD Million) By Application (2021-2032)
Table 19 North America Fermented Food and Beverages Revenue (USD Million) By Product (2021-2032)
Table 20 Europe Fermented Food and Beverages Revenue (USD Million) By Type (2021-2032)
Table 21 Europe Fermented Food and Beverages Revenue (USD Million) By Application (2021-2032)
Table 22 Europe Fermented Food and Beverages Revenue (USD Million) By Product (2021-2032)
Table 23 Asia Pacific Fermented Food and Beverages Revenue (USD Million) By Type (2021-2032)
Table 24 Asia Pacific Fermented Food and Beverages Revenue (USD Million) By Application (2021-2032)
Table 25 Asia Pacific Fermented Food and Beverages Revenue (USD Million) By Product (2021-2032)
Table 26 South America Fermented Food and Beverages Revenue (USD Million) By Type (2021-2032)
Table 27 South America Fermented Food and Beverages Revenue (USD Million) By Application (2021-2032)
Table 28 South America Fermented Food and Beverages Revenue (USD Million) By Product (2021-2032)
Table 29 Middle East and Africa Fermented Food and Beverages Revenue (USD Million) By Type (2021-2032)
Table 30 Middle East and Africa Fermented Food and Beverages Revenue (USD Million) By Application (2021-2032)
Table 31 Middle East and Africa Fermented Food and Beverages Revenue (USD Million) By Product (2021-2032)
LIST OF FIGURES
Figure 1. Market Scope
Figure 2. Pricing Forecasts Per Unit, 2023- 2032
Figure 3. Porter’s Five Forces
Figure 4. Global Fermented Food and Beverages Market Revenue (USD Million) By Regions (2021-2032)
Figure 5. Global Fermented Food and Beverages Market Share (%) By Regions (2023)
Figure 6. North America Fermented Food and Beverages Revenue (USD Million) By Country (2021-2032)
Figure 7. United States Fermented Food and Beverages Revenue (USD Million) By Country (2021-2032)
Figure 8. Canada Fermented Food and Beverages Revenue (USD Million) By Country (2021-2032)
Figure 9. Mexico Fermented Food and Beverages Revenue (USD Million) By Country (2021-2032)
Figure 10. Europe Fermented Food and Beverages Revenue (USD Million) By Country (2021-2032)
Figure 11. Germany Fermented Food and Beverages Revenue (USD Million) By Country (2021-2032)
Figure 12. France Fermented Food and Beverages Revenue (USD Million) By Country (2021-2032)
Figure 13. United Kingdom Fermented Food and Beverages Revenue (USD Million) By Country (2021-2032)
Figure 14. Spain Fermented Food and Beverages Revenue (USD Million) By Country (2021-2032)
Figure 15. Italy Fermented Food and Beverages Revenue (USD Million) By Country (2021-2032)
Figure 16. Russia Fermented Food and Beverages Revenue (USD Million) By Country (2021-2032)
Figure 17. Rest of Europe Fermented Food and Beverages Revenue (USD Million) By Country (2021-2032)
Figure 11. Asia Pacific Fermented Food and Beverages Revenue (USD Million) By Country (2021-2032)
Figure 12. China Fermented Food and Beverages Revenue (USD Million) By Country (2021-2032)
Figure 13. Japan Fermented Food and Beverages Revenue (USD Million) By Country (2021-2032)
Figure 14. India Fermented Food and Beverages Revenue (USD Million) By Country (2021-2032)
Figure 15. South Korea Fermented Food and Beverages Revenue (USD Million) By Country (2021-2032)
Figure 16. Australia Fermented Food and Beverages Revenue (USD Million) By Country (2021-2032)
Figure 17. South East Asia Fermented Food and Beverages Revenue (USD Million) By Country (2021-2032)
Figure 18. South America Fermented Food and Beverages Revenue (USD Million) By Country (2021-2032)
Figure 19. Brazil Fermented Food and Beverages Revenue (USD Million) By Country (2021-2032)
Figure 20. Argentina Fermented Food and Beverages Revenue (USD Million) By Country (2021-2032)
Figure 21. Rest of Asia Pacific Fermented Food and Beverages Revenue (USD Million) By Country (2021-2032)
Figure 22. Middle East and Africa Fermented Food and Beverages Revenue (USD Million) By Region (2021-2032)
Figure 23. Saudi Arabia Fermented Food and Beverages Revenue (USD Million) By Region (2021-2032)
Figure 24. The UAE Fermented Food and Beverages Revenue (USD Million) By Region (2021-2032)
Figure 25. Rest of Middle East Fermented Food and Beverages Revenue (USD Million) By Region (2021-2032)
Figure 26. South Africa Fermented Food and Beverages Revenue (USD Million) By Region (2021-2032)
Figure 27. Africa Fermented Food and Beverages Revenue (USD Million) By Region (2021-2032)
Figure 28. North America Fermented Food and Beverages Revenue (USD Million) By Type (2021-2032)
Figure 29. North America Fermented Food and Beverages Revenue (USD Million) By Application (2021-2032)
Figure 30. North America Fermented Food and Beverages Revenue (USD Million) By Product (2021-2032)
Figure 31. Europe Fermented Food and Beverages Revenue (USD Million) By Type (2021-2032)
Figure 32. Europe Fermented Food and Beverages Revenue (USD Million) By Application (2021-2032)
Figure 33. Europe Fermented Food and Beverages Revenue (USD Million) By Product (2021-2032)
Figure 34. Asia Pacific Fermented Food and Beverages Revenue (USD Million) By Type (2021-2032)
Figure 35. Asia Pacific Fermented Food and Beverages Revenue (USD Million) By Application (2021-2032)
Figure 36. Asia Pacific Fermented Food and Beverages Revenue (USD Million) By Product (2021-2032)
Figure 37. South America Fermented Food and Beverages Revenue (USD Million) By Type (2021-2032)
Figure 38. South America Fermented Food and Beverages Revenue (USD Million) By Application (2021-2032)
Figure 39. South America Fermented Food and Beverages Revenue (USD Million) By Product (2021-2032)
Figure 40. Middle East and Africa Fermented Food and Beverages Revenue (USD Million) By Type (2021-2032)
Figure 41. Middle East and Africa Fermented Food and Beverages Revenue (USD Million) By Application (2021-2032)
Figure 42. Middle East and Africa Fermented Food and Beverages Revenue (USD Million) By Product (2021-2032)
By Ingredient
Prebiotics
Probiotics
Vitamins
Industrial Enzymes
Organic Acid
Amino Acids
Others
By Fermentation Process
Anaerobic Fermentation
Aerobic Fermentation
Continuous Fermentation
Batch Fermentation
Others
By End-User
Bakery & Confectionery
Dairy Products
Alcoholic Beverages
Non-alcoholic Beverages
Infant Formula
Dietary Supplements
Vegetables and Meat
Animal Feed Products
Fermented Chilli Sauce
Fermented Fish Sauce
Others
Countries Analyzed
North America (US, Canada, Mexico)
Europe (Germany, UK, France, Spain, Italy, Russia, Rest of Europe)
Asia Pacific (China, India, Japan, South Korea, Australia, South East Asia, Rest of Asia)
South America (Brazil, Argentina, Rest of South America)
Middle East and Africa (Saudi Arabia, UAE, Rest of Middle East, South Africa, Egypt, Rest of Africa)
