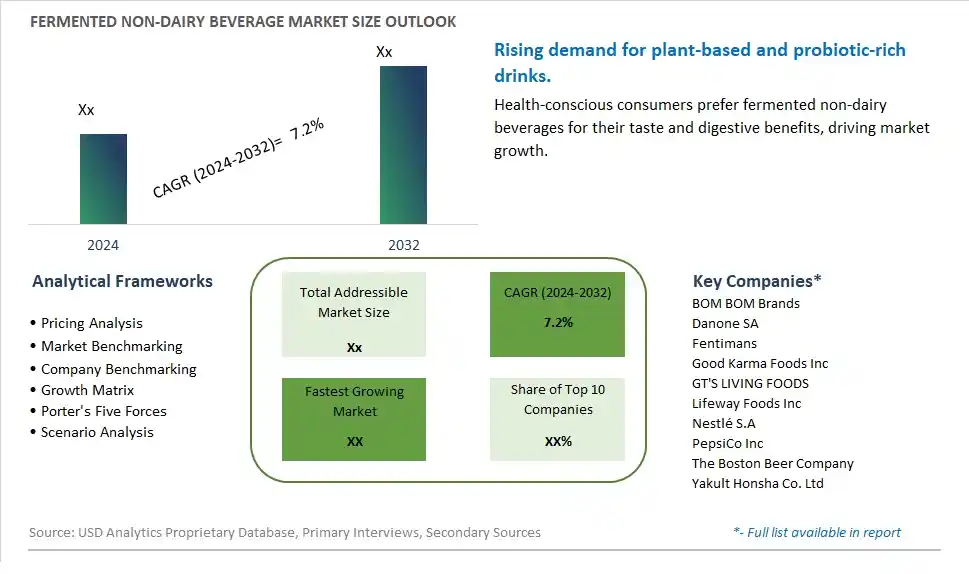
Global Fermented Non-Dairy Beverage Market Size is valued at $XX Million in 2024 and is forecast to register a growth rate (CAGR) of 7.2% to reach $XX Million by 2032.
The global Fermented Non-Dairy Beverage Market Comprehensive Study analyzes and forecasts the market size across 6 regions and 24 countries for diverse segments -By Source (Fruits, Vegetables, Cereals, Others), By Type (Dairy Free Drinkable Yogurts, Fermented Soft Drinks, Fermented Juices, Non-dairy Kefir), By Distribution Channel (Online Retail, Supermarket/Hypermarket, Specialty Stores, Departmental Stores, Others)
An Introduction to Fermented Non-Dairy Beverage Market
The Fermented Non-Dairy Beverage Market involves the production and sale of beverages made from plant-based ingredients that have undergone fermentation. These beverages, such as kombucha and kefir, offer probiotic benefits and cater to consumers seeking dairy-free options. The market is driven by increasing demand for functional and probiotic beverages, rising popularity of plant-based diets, and growing awareness about the health benefits of fermented foods. Additionally, advancements in fermentation technologies and the expansion of product offerings support market growth.
Fermented Non Dairy Beverage Competitive Landscape
The market report analyses the leading companies in the industry including BOM BOM Brands, Danone SA, Fentimans, Good Karma Foods Inc, GT'S LIVING FOODS, Lifeway Foods Inc, Nestlé S.A, PepsiCo Inc, The Boston Beer Company, Yakult Honsha Co. Ltd, and Others.
Fermented Non Dairy Beverage Market Dynamics
Market Trend: Growing Demand for Plant-Based Alternatives
One of the most prominent trends in the market for fermented non-dairy beverages is the increasing demand for plant-based alternatives. Consumers are shifting towards plant-based diets due to various reasons, including health and environmental concerns, ethical considerations, and dietary preferences. This trend is driving the demand for fermented non-dairy beverages made from ingredients like soy, almond, coconut, oats, and rice, offering a wide range of options to cater to different tastes and nutritional needs.
Market Driver: Rise in Vegan and Dairy-Free Lifestyles
A key driver for the fermented non-dairy beverage market is the rise in vegan and dairy-free lifestyles. As more individuals adopt plant-based diets for health, ethical, or environmental reasons, there is a growing demand for non-dairy alternatives to traditional dairy products. Fermented non-dairy beverages offer a nutritious and flavorful option for those seeking dairy-free alternatives, providing probiotics, vitamins, and minerals similar to dairy-based fermented products while catering to the preferences of vegan and lactose-intolerant consumers.
Market Opportunity: Product Innovation and Flavor Varieties
The market presents a significant opportunity for product innovation and the introduction of diverse flavor varieties in fermented non-dairy beverages. Manufacturers can capitalize on this opportunity by developing new formulations using innovative fermentation techniques and incorporating unique ingredients to enhance taste, texture, and nutritional profile. There is potential for creating a wide range of flavors such as fruity, nutty, spicy, and savory options to appeal to different consumer preferences and culinary trends. Additionally, focusing on functional benefits like gut health support, immune system boost, and energy enhancement can further differentiate products and attract a broader consumer base to the market.
Fermented Non-Dairy Beverage Market Share Analysis- Largest Segment by Source
The Fruits segment is the largest in the Fermented Non-Dairy Beverage Market by source. This dominance is driven by the high consumer preference for fruit-based beverages, which are perceived as naturally flavorful and rich in vitamins and antioxidants. Fermented fruit beverages, such as kombucha and probiotic juices, are popular for their health benefits, including improved digestion and enhanced immune function. The natural sweetness and appealing taste of fruit-based beverages make them a preferred choice among consumers seeking healthy and refreshing drinks. Additionally, the continuous innovation in flavor combinations and the introduction of exotic and superfruit options further boost the demand for fermented fruit beverages. The strong consumer interest in natural and functional beverages, coupled with the expanding distribution networks in supermarkets, specialty stores, and online platforms, supports the significant market share of the fruits segment.
Fermented Non-Dairy Beverage Market Share Analysis- Fastest Growing Segment by Type
The Non-dairy Kefir segment is poised to grow the fastest in the Fermented Non-Dairy Beverage Market by type over the next five years. This rapid growth is driven by the increasing consumer awareness of the health benefits associated with kefir, such as improved digestion, enhanced gut health, and strengthened immune system. Non-dairy kefir, made from plant-based milk alternatives like almond, coconut, and soy milk, appeals to consumers who are lactose intolerant, vegan, or seeking dairy-free options. The continuous innovation in non-dairy kefir formulations, including the addition of probiotics, vitamins, and natural flavors, enhances their nutritional profile and taste, attracting health-conscious consumers. Additionally, the growing popularity of functional beverages that promote overall wellness and the expanding availability of non-dairy kefir in supermarkets, health food stores, and online platforms further drive the growth of this segment. The influence of social media and health influencers in promoting kefir as a superfood also boosts its popularity and adoption.
Fermented Non-Dairy Beverage Market Share Analysis- Largest Segment by Distribution Channel
The Supermarket/Hypermarket segment is the largest in the Fermented Non-Dairy Beverage Market by distribution channel. This dominance is due to the extensive reach and accessibility of supermarkets and hypermarkets, which attract a large number of consumers. These retail outlets offer a wide variety of fermented non-dairy beverages, providing consumers with numerous choices and the convenience of one-stop shopping. The high foot traffic and the ability to physically inspect and select products contribute to the strong market presence of supermarkets and hypermarkets. Additionally, the frequent promotions, discounts, and in-store marketing activities in these outlets enhance the visibility and sales of fermented non-dairy beverages. The extensive distribution networks and established relationships with suppliers ensure a steady supply of products, further supporting the significant market share of supermarkets and hypermarkets.
Fermented Non Dairy Beverage Market Segmentation
By Source
Fruits
Vegetables
Cereals
Others
By Type
Dairy Free Drinkable Yogurts
Fermented Soft Drinks
Fermented Juices
Non-dairy Kefir
By Distribution Channel
Online Retail
Supermarket/Hypermarket
Specialty Stores
Departmental Stores
Others
Countries Analyzed
North America (US, Canada, Mexico)
Europe (Germany, UK, France, Spain, Italy, Russia, Rest of Europe)
Asia Pacific (China, India, Japan, South Korea, Australia, South East Asia, Rest of Asia)
South America (Brazil, Argentina, Rest of South America)
Middle East and Africa (Saudi Arabia, UAE, Rest of Middle East, South Africa, Egypt, Rest of Africa)
Fermented Non Dairy Beverage Companies Profiled in the Study
BOM BOM Brands
Danone SA
Fentimans
Good Karma Foods Inc
GT'S LIVING FOODS
Lifeway Foods Inc
Nestlé S.A
PepsiCo Inc
The Boston Beer Company
Yakult Honsha Co. Ltd
*- List Not Exhaustive
Chapter 1. TABLE OF CONTENTS
Chapter 2. Introduction to Fermented Non Dairy Beverage Market
2.1. Market Overview
2.2. Key Statistics and Report Highlights
2.3. Scope of the Comprehensive Study
2.3.1. Market Definition
2.3.2 Countries and Regions Covered
2.3.3 Research Objective
2.3.4 Units, Currency, and Conversions
2.3.5 Industry Value Chain
2.4. Key Market Segments
2.5. Key Companies
2.6. Study Period
Chapter 3. Strategic Analysis Review
3.1. Fermented Non Dairy Beverage Pricing Analysis and Forecast
3.2. Porter’s Five Forces
3.3. Market Ecosystem
3.4. SWOT Analysis
3.5. Regulatory Scenario
3.3. Effects of Inflation, Russia-Ukraine War, moderating economic growth, and other macroeconomic factors
Chapter 4. Competitive Landscape
4.1. Market Share Analysis
4.1.1. Global Fermented Non Dairy Beverage Market Share by Company, 2023
4.1.2. Product Offerings of Leading Fermented Non Dairy Beverage Companies
4.2. Market Entropy
4.2.1. New Product Launches in the Industry
4.2.2. Mergers, Acquisitions, Joint ventures, and Partnerships
4.3. Key Strategies and Best Practices
Chapter 5. Global Market Projections: Best, Reference, and Low Case Scenarios
5.1. Growth Analysis- Case Scenario Definitions
5.2. Low Growth Case Scenario Forecasts
5.3. Reference Growth Case Scenario Forecasts
5.4. High Growth Case Scenario Forecasts
Chapter 6. Market Dynamics
6.1. Fermented Non Dairy Beverage Market Drivers
6.2. Fermented Non Dairy Beverage Market Challenges
6.6. Fermented Non Dairy Beverage Market Opportunities
6.4. Fermented Non Dairy Beverage Market Trends
Chapter 7. Global Fermented Non Dairy Beverage Market Outlook Trends
7.1. Global Fermented Non Dairy Beverage Revenue (USD Million) and CAGR (%) by Type (2021-2032)
7.2. Global Fermented Non Dairy Beverage Revenue (USD Million) and CAGR (%) by Application (2021-2032)
7.3. Global Fermented Non Dairy Beverage Revenue (USD Million) and CAGR (%) by Product (2021-2032)
By Source
Fruits
Vegetables
Cereals
Others
By Type
Dairy Free Drinkable Yogurts
Fermented Soft Drinks
Fermented Juices
Non-dairy Kefir
By Distribution Channel
Online Retail
Supermarket/Hypermarket
Specialty Stores
Departmental Stores
Others
Chapter 8. Global Fermented Non Dairy Beverage Regional Analysis and Outlook
8.1. Global Fermented Non Dairy Beverage Revenue (USD Million) By Regions (2021- 2032)
8.2. North America Fermented Non Dairy Beverage Revenue (USD Million) by Country (2021-2032)
8.2.1. United States Fermented Non Dairy Beverage Regional Analysis and Outlook
8.2.2. Canada Fermented Non Dairy Beverage Regional Analysis and Outlook
8.2.3. Mexico Fermented Non Dairy Beverage Regional Analysis and Outlook
8.3. Europe Fermented Non Dairy Beverage Revenue (USD Million), by Country (2021-2032)
8.3.1. Germany Fermented Non Dairy Beverage Regional Analysis and Outlook
8.3.2. France Fermented Non Dairy Beverage Regional Analysis and Outlook
8.3.3. United Kingdom Fermented Non Dairy Beverage Regional Analysis and Outlook
8.3.4. Spain Fermented Non Dairy Beverage Regional Analysis and Outlook
8.3.5. Italy Fermented Non Dairy Beverage Regional Analysis and Outlook
8.3.6. Russia Fermented Non Dairy Beverage Regional Analysis and Outlook
8.3.7. Rest of Europe Fermented Non Dairy Beverage Regional Analysis and Outlook
8.4. Asia Pacific Fermented Non Dairy Beverage Revenue (USD Million) by Country (2021-2032)
8.4.1. China Fermented Non Dairy Beverage Regional Analysis and Outlook
8.4.2. Japan Fermented Non Dairy Beverage Regional Analysis and Outlook
8.4.3. India Fermented Non Dairy Beverage Regional Analysis and Outlook
8.4.4. South Korea Fermented Non Dairy Beverage Regional Analysis and Outlook
8.4.5. Australia Fermented Non Dairy Beverage Regional Analysis and Outlook
8.4.6. South East Asia Fermented Non Dairy Beverage Regional Analysis and Outlook
8.4.7. Rest of Asia Pacific Fermented Non Dairy Beverage Regional Analysis and Outlook
8.5. South America Fermented Non Dairy Beverage Revenue (USD Million), by Country (2021-2032)
8.5.1. Brazil Fermented Non Dairy Beverage Regional Analysis and Outlook
8.5.2. Argentina Fermented Non Dairy Beverage Regional Analysis and Outlook
8.5.3. Rest of South America Fermented Non Dairy Beverage Regional Analysis and Outlook
8.6. Middle East and Africa Fermented Non Dairy Beverage Revenue (USD Million) by Country (2021-2032)
8.6.1. Middle East Fermented Non Dairy Beverage Regional Analysis and Outlook
8.6.2. Africa Fermented Non Dairy Beverage Regional Analysis and Outlook
Chapter 9. North America Fermented Non Dairy Beverage Analysis and Outlook
9.1. North America Fermented Non Dairy Beverage Revenue (USD Million) by Segments (2021-2032)
9.1.1. North America Fermented Non Dairy Beverage Revenue (USD Million) by Type (2021-2032)
9.1.2. North America Fermented Non Dairy Beverage Revenue (USD Million) by Application (2021-2032)
9.1.3. North America Fermented Non Dairy Beverage Revenue (USD Million) by Product (2021-2032)
By Source
Fruits
Vegetables
Cereals
Others
By Type
Dairy Free Drinkable Yogurts
Fermented Soft Drinks
Fermented Juices
Non-dairy Kefir
By Distribution Channel
Online Retail
Supermarket/Hypermarket
Specialty Stores
Departmental Stores
Others
Chapter 10. Europe Fermented Non Dairy Beverage Analysis and Outlook
10.1. Europe Fermented Non Dairy Beverage Revenue (USD Million), by Segments (USD Million) (2021-2032)
10.1.1. Europe Fermented Non Dairy Beverage Revenue (USD Million) by Type (2021-2032)
10.1.2. Europe Fermented Non Dairy Beverage Revenue (USD Million) by Application (2021-2032)
10.1.3. Europe Fermented Non Dairy Beverage Revenue (USD Million) by Product (2021-2032)
By Source
Fruits
Vegetables
Cereals
Others
By Type
Dairy Free Drinkable Yogurts
Fermented Soft Drinks
Fermented Juices
Non-dairy Kefir
By Distribution Channel
Online Retail
Supermarket/Hypermarket
Specialty Stores
Departmental Stores
Others
Chapter 11. Asia Pacific Fermented Non Dairy Beverage Analysis and Outlook
11.1. Asia Pacific Fermented Non Dairy Beverage Revenue (USD Million), and Revenue (USD Million) by Segments (2021-2032)
11.1.1. Asia Pacific Fermented Non Dairy Beverage Revenue (USD Million) by Type (2021-2032)
11.1.2. Asia Pacific Fermented Non Dairy Beverage Revenue (USD Million) by Application (2021-2032)
11.1.3. Asia Pacific Fermented Non Dairy Beverage Revenue (USD Million) by Product (2021-2032)
By Source
Fruits
Vegetables
Cereals
Others
By Type
Dairy Free Drinkable Yogurts
Fermented Soft Drinks
Fermented Juices
Non-dairy Kefir
By Distribution Channel
Online Retail
Supermarket/Hypermarket
Specialty Stores
Departmental Stores
Others
Chapter 12. South America Fermented Non Dairy Beverage Analysis and Outlook
12.1. South America Fermented Non Dairy Beverage Revenue (USD Million), by Segments (2021-2032)
12.1.1. South America Fermented Non Dairy Beverage Revenue (USD Million) by Type (2021-2032)
12.1.2. South America Fermented Non Dairy Beverage Revenue (USD Million) by Application (2021-2032)
12.1.3. South America Fermented Non Dairy Beverage Revenue (USD Million) by Product (2021-2032)
By Source
Fruits
Vegetables
Cereals
Others
By Type
Dairy Free Drinkable Yogurts
Fermented Soft Drinks
Fermented Juices
Non-dairy Kefir
By Distribution Channel
Online Retail
Supermarket/Hypermarket
Specialty Stores
Departmental Stores
Others
Chapter 13. Middle East and Africa Fermented Non Dairy Beverage Analysis and Outlook
13.1. Middle East and Africa Fermented Non Dairy Beverage Revenue (USD Million), by Segments (2021-2032)
13.1.1. Middle East and Africa Fermented Non Dairy Beverage Revenue (USD Million) by Type (2021-2032)
13.1.2. Middle East and Africa Fermented Non Dairy Beverage Revenue (USD Million) by Application (2021-2032)
13.1.3. Middle East and Africa Fermented Non Dairy Beverage Revenue (USD Million) by Product (2021-2032)
By Source
Fruits
Vegetables
Cereals
Others
By Type
Dairy Free Drinkable Yogurts
Fermented Soft Drinks
Fermented Juices
Non-dairy Kefir
By Distribution Channel
Online Retail
Supermarket/Hypermarket
Specialty Stores
Departmental Stores
Others
Chapter 14. Fermented Non Dairy Beverage Company Profiles
14.1 Business Overview
14.2 Product Profiles
14.3 SWOT Profiles
14.5 Recent Developments
14.6 Financial Profile
List of Companies
BOM BOM Brands
Danone SA
Fentimans
Good Karma Foods Inc
GT'S LIVING FOODS
Lifeway Foods Inc
Nestlé S.A
PepsiCo Inc
The Boston Beer Company
Yakult Honsha Co. Ltd
15. Methodology and Data Sources
15.1 Customization Offerings
15.2 Subscription Services
15.3 Related Reports
15.4 Publisher Expertise
LIST OF TABLES
Table 1 Market Segmentation Analysis
Table 2 Global Fermented Non Dairy Beverage Market Share of Leading Companies, 2023
Table 3 Product Offerings of Leading Companies
Table 4 Low Growth Scenario Forecasts
Table 5 Reference Case Growth Scenario
Table 6 High Growth Case Scenario
Table 7 Global Fermented Non Dairy Beverage Revenue (USD Million) And CAGR (%) By Type (2021-2032)
Table 8 Global Fermented Non Dairy Beverage Revenue (USD Million) And CAGR (%) By Application (2021-2032)
Table 9 Global Fermented Non Dairy Beverage Revenue (USD Million) And CAGR (%) By Product (2021-2032)
Table 10 Global Fermented Non Dairy Beverage Market Revenue (USD Million) By Regions (2021-2032)
Table 11 Global Fermented Non Dairy Beverage Market Share (%) By Regions (2021-2032)
Table 12 North America Fermented Non Dairy Beverage Revenue (USD Million) By Country (2021-2032)
Table 13 Europe Fermented Non Dairy Beverage Revenue (USD Million) By Country (2021-2032)
Table 14 Asia Pacific Fermented Non Dairy Beverage Revenue (USD Million) By Country (2021-2032)
Table 15 South America Fermented Non Dairy Beverage Revenue (USD Million) By Country (2021-2032)
Table 16 Middle East and Africa Fermented Non Dairy Beverage Revenue (USD Million) By Region (2021-2032)
Table 17 North America Fermented Non Dairy Beverage Revenue (USD Million) By Type (2021-2032)
Table 18 North America Fermented Non Dairy Beverage Revenue (USD Million) By Application (2021-2032)
Table 19 North America Fermented Non Dairy Beverage Revenue (USD Million) By Product (2021-2032)
Table 20 Europe Fermented Non Dairy Beverage Revenue (USD Million) By Type (2021-2032)
Table 21 Europe Fermented Non Dairy Beverage Revenue (USD Million) By Application (2021-2032)
Table 22 Europe Fermented Non Dairy Beverage Revenue (USD Million) By Product (2021-2032)
Table 23 Asia Pacific Fermented Non Dairy Beverage Revenue (USD Million) By Type (2021-2032)
Table 24 Asia Pacific Fermented Non Dairy Beverage Revenue (USD Million) By Application (2021-2032)
Table 25 Asia Pacific Fermented Non Dairy Beverage Revenue (USD Million) By Product (2021-2032)
Table 26 South America Fermented Non Dairy Beverage Revenue (USD Million) By Type (2021-2032)
Table 27 South America Fermented Non Dairy Beverage Revenue (USD Million) By Application (2021-2032)
Table 28 South America Fermented Non Dairy Beverage Revenue (USD Million) By Product (2021-2032)
Table 29 Middle East and Africa Fermented Non Dairy Beverage Revenue (USD Million) By Type (2021-2032)
Table 30 Middle East and Africa Fermented Non Dairy Beverage Revenue (USD Million) By Application (2021-2032)
Table 31 Middle East and Africa Fermented Non Dairy Beverage Revenue (USD Million) By Product (2021-2032)
LIST OF FIGURES
Figure 1. Market Scope
Figure 2. Pricing Forecasts Per Unit, 2023- 2032
Figure 3. Porter’s Five Forces
Figure 4. Global Fermented Non Dairy Beverage Market Revenue (USD Million) By Regions (2021-2032)
Figure 5. Global Fermented Non Dairy Beverage Market Share (%) By Regions (2023)
Figure 6. North America Fermented Non Dairy Beverage Revenue (USD Million) By Country (2021-2032)
Figure 7. United States Fermented Non Dairy Beverage Revenue (USD Million) By Country (2021-2032)
Figure 8. Canada Fermented Non Dairy Beverage Revenue (USD Million) By Country (2021-2032)
Figure 9. Mexico Fermented Non Dairy Beverage Revenue (USD Million) By Country (2021-2032)
Figure 10. Europe Fermented Non Dairy Beverage Revenue (USD Million) By Country (2021-2032)
Figure 11. Germany Fermented Non Dairy Beverage Revenue (USD Million) By Country (2021-2032)
Figure 12. France Fermented Non Dairy Beverage Revenue (USD Million) By Country (2021-2032)
Figure 13. United Kingdom Fermented Non Dairy Beverage Revenue (USD Million) By Country (2021-2032)
Figure 14. Spain Fermented Non Dairy Beverage Revenue (USD Million) By Country (2021-2032)
Figure 15. Italy Fermented Non Dairy Beverage Revenue (USD Million) By Country (2021-2032)
Figure 16. Russia Fermented Non Dairy Beverage Revenue (USD Million) By Country (2021-2032)
Figure 17. Rest of Europe Fermented Non Dairy Beverage Revenue (USD Million) By Country (2021-2032)
Figure 11. Asia Pacific Fermented Non Dairy Beverage Revenue (USD Million) By Country (2021-2032)
Figure 12. China Fermented Non Dairy Beverage Revenue (USD Million) By Country (2021-2032)
Figure 13. Japan Fermented Non Dairy Beverage Revenue (USD Million) By Country (2021-2032)
Figure 14. India Fermented Non Dairy Beverage Revenue (USD Million) By Country (2021-2032)
Figure 15. South Korea Fermented Non Dairy Beverage Revenue (USD Million) By Country (2021-2032)
Figure 16. Australia Fermented Non Dairy Beverage Revenue (USD Million) By Country (2021-2032)
Figure 17. South East Asia Fermented Non Dairy Beverage Revenue (USD Million) By Country (2021-2032)
Figure 18. South America Fermented Non Dairy Beverage Revenue (USD Million) By Country (2021-2032)
Figure 19. Brazil Fermented Non Dairy Beverage Revenue (USD Million) By Country (2021-2032)
Figure 20. Argentina Fermented Non Dairy Beverage Revenue (USD Million) By Country (2021-2032)
Figure 21. Rest of Asia Pacific Fermented Non Dairy Beverage Revenue (USD Million) By Country (2021-2032)
Figure 22. Middle East and Africa Fermented Non Dairy Beverage Revenue (USD Million) By Region (2021-2032)
Figure 23. Saudi Arabia Fermented Non Dairy Beverage Revenue (USD Million) By Region (2021-2032)
Figure 24. The UAE Fermented Non Dairy Beverage Revenue (USD Million) By Region (2021-2032)
Figure 25. Rest of Middle East Fermented Non Dairy Beverage Revenue (USD Million) By Region (2021-2032)
Figure 26. South Africa Fermented Non Dairy Beverage Revenue (USD Million) By Region (2021-2032)
Figure 27. Africa Fermented Non Dairy Beverage Revenue (USD Million) By Region (2021-2032)
Figure 28. North America Fermented Non Dairy Beverage Revenue (USD Million) By Type (2021-2032)
Figure 29. North America Fermented Non Dairy Beverage Revenue (USD Million) By Application (2021-2032)
Figure 30. North America Fermented Non Dairy Beverage Revenue (USD Million) By Product (2021-2032)
Figure 31. Europe Fermented Non Dairy Beverage Revenue (USD Million) By Type (2021-2032)
Figure 32. Europe Fermented Non Dairy Beverage Revenue (USD Million) By Application (2021-2032)
Figure 33. Europe Fermented Non Dairy Beverage Revenue (USD Million) By Product (2021-2032)
Figure 34. Asia Pacific Fermented Non Dairy Beverage Revenue (USD Million) By Type (2021-2032)
Figure 35. Asia Pacific Fermented Non Dairy Beverage Revenue (USD Million) By Application (2021-2032)
Figure 36. Asia Pacific Fermented Non Dairy Beverage Revenue (USD Million) By Product (2021-2032)
Figure 37. South America Fermented Non Dairy Beverage Revenue (USD Million) By Type (2021-2032)
Figure 38. South America Fermented Non Dairy Beverage Revenue (USD Million) By Application (2021-2032)
Figure 39. South America Fermented Non Dairy Beverage Revenue (USD Million) By Product (2021-2032)
Figure 40. Middle East and Africa Fermented Non Dairy Beverage Revenue (USD Million) By Type (2021-2032)
Figure 41. Middle East and Africa Fermented Non Dairy Beverage Revenue (USD Million) By Application (2021-2032)
Figure 42. Middle East and Africa Fermented Non Dairy Beverage Revenue (USD Million) By Product (2021-2032)
By Source
Fruits
Vegetables
Cereals
Others
By Type
Dairy Free Drinkable Yogurts
Fermented Soft Drinks
Fermented Juices
Non-dairy Kefir
By Distribution Channel
Online Retail
Supermarket/Hypermarket
Specialty Stores
Departmental Stores
Others
Countries Analyzed
North America (US, Canada, Mexico)
Europe (Germany, UK, France, Spain, Italy, Russia, Rest of Europe)
Asia Pacific (China, India, Japan, South Korea, Australia, South East Asia, Rest of Asia)
South America (Brazil, Argentina, Rest of South America)
Middle East and Africa (Saudi Arabia, UAE, Rest of Middle East, South Africa, Egypt, Rest of Africa)
