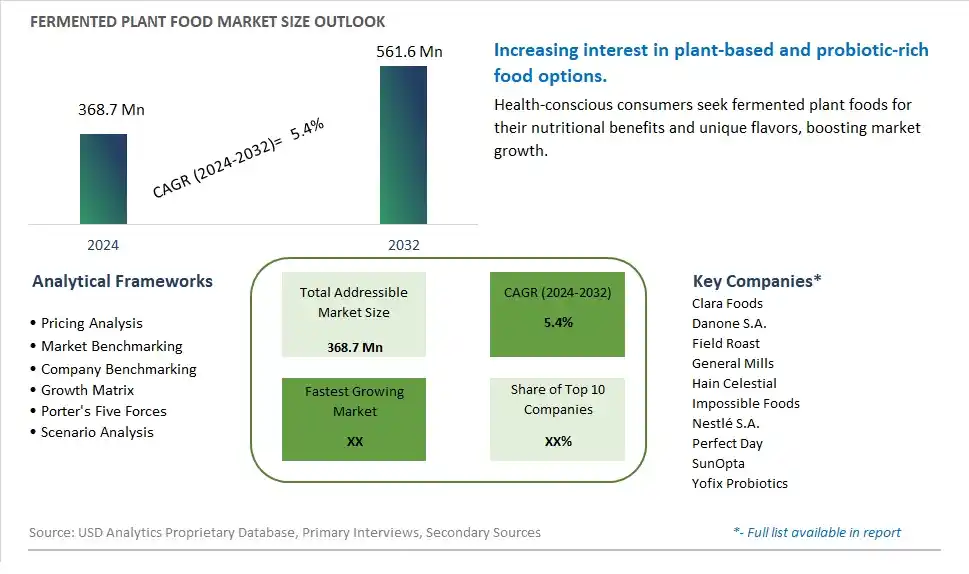
Global Fermented Plant Food Market Size is valued at $368.7 Million in 2024 and is forecast to register a growth rate (CAGR) of 5.4% to reach $561.6 Million by 2032.
The global Fermented Plant Food Market Comprehensive Study analyzes and forecasts the market size across 6 regions and 24 countries for diverse segments -By Type (Dairy Substitutes, Meat Substitutes, Seasoning Substitutes, Others), By Application (Supermarkets, Specialty Stores, Online)
An Introduction to Fermented Plant Food Market
In 2024, the Fermented Plant Food market is experiencing robust growth, driven by the increasing demand for plant-based and probiotic-rich food products. Fermented plant foods, such as sauerkraut, kimchi, tempeh, and miso, are popular for their unique flavors and health benefits. The market benefits from advancements in fermentation technologies, the growing trend of plant-based diets, and the expansion of the functional food sector. Additionally, the rising awareness of the benefits of fermented foods for gut health and overall wellness is contributing to market growth.
Fermented Plant Food Competitive Landscape
The market report analyses the leading companies in the industry including Clara Foods, Danone S.A., Field Roast, General Mills, Hain Celestial, Impossible Foods, Nestlé S.A., Perfect Day, SunOpta, Yofix Probiotics, and Others.
Fermented Plant Food Market Dynamics
Fermented Plant Food Market Trend: Rising Interest in Fermented Plant-Based Diets
One of the most prominent market trends for fermented plant food is the rising interest in fermented plant-based diets. Consumers are increasingly looking for natural and healthy food options, and fermented plant foods align well with this trend due to their probiotic benefits, improved digestibility, and potential positive impact on gut health. This trend is driving the demand for a variety of fermented plant-based foods such as tempeh, kimchi, sauerkraut, miso, and kombucha.
Fermented Plant Food Market Driver: Growing Awareness of Health Benefits
A key driver for the fermented plant food market is the growing awareness of the health benefits associated with fermented foods. Consumers are becoming more knowledgeable about the role of probiotics in supporting gut health, boosting immunity, and promoting overall well-being. As a result, there is an increasing demand for fermented plant foods as they offer a natural source of probiotics, enzymes, vitamins, and minerals, which are beneficial for digestive health and overall vitality.
Fermented Plant Food Market Opportunity: Diverse Product Portfolio and Culinary Innovation
The market presents a significant opportunity for companies to expand their product portfolio and engage in culinary innovation with fermented plant foods. Manufacturers can capitalize on this opportunity by introducing new varieties of fermented plant-based products, exploring unique fermentation techniques, and incorporating diverse plant ingredients to create innovative flavors and textures. There is also potential for developing convenient and ready-to-eat fermented plant food options to cater to the busy lifestyles of modern consumers. Additionally, highlighting the nutritional benefits and sustainability aspects of fermented plant foods can further enhance market growth and consumer adoption.
Fermented Plant Food Market Share Analysis: Dairy Substitutes is the fastest growing segment over the forecast period to 2032
Dairy Substitutes represent the largest segment in the Fermented Plant Food Market. This segment includes a variety of products such as fermented plant-based yogurts, cheeses, and milk alternatives that are made from sources like soy, almonds, oats, and coconut. The popularity of dairy substitutes is driven by the growing number of consumers adopting vegan diets, as well as those with lactose intolerance or allergies to dairy products. These plant-based alternatives offer similar nutritional profiles and probiotic benefits as traditional dairy, making them an attractive option for health-conscious consumers. The market for dairy substitutes is also supported by ongoing innovation in product development, improving taste and texture to better mimic traditional dairy products. As environmental concerns and awareness of animal welfare increase, more consumers are turning to plant-based options, solidifying dairy substitutes as the largest segment in the market.
Fermented Plant Food Market Share Analysis: Online is the fastest growing segment over the forecast period to 2032
The Online segment is projected to be the fastest-growing application in the Fermented Plant Food Market by 2032. This growth is driven by the increasing consumer preference for the convenience of online shopping, coupled with the expansion of e-commerce platforms offering a wide range of specialized food products. Online retailers can offer a broader selection of fermented plant-based foods that may not be available in local physical stores, providing consumers with more options to choose from. The rise of health and dietary trends promoting plant-based diets is also reflected in online sales, as consumers seek out niche products that align with their lifestyle choices. Additionally, online platforms often provide detailed product information, customer reviews, and competitive pricing, which are attractive to informed and health-conscious shoppers. The ongoing digital transformation and the expansion of logistics networks further support the rapid growth of the online segment, making it the fastest-growing application in the fermented plant food market.
Fermented Plant Food Market Segmentation
By Type
Dairy Substitutes
Meat Substitutes
Seasoning Substitutes
Others
By Application
Supermarkets
Specialty Stores
Online
Countries Analyzed
North America (US, Canada, Mexico)
Europe (Germany, UK, France, Spain, Italy, Russia, Rest of Europe)
Asia Pacific (China, India, Japan, South Korea, Australia, South East Asia, Rest of Asia)
South America (Brazil, Argentina, Rest of South America)
Middle East and Africa (Saudi Arabia, UAE, Rest of Middle East, South Africa, Egypt, Rest of Africa)
Fermented Plant Food Companies Profiled in the Study
Clara Foods
Danone S.A.
Field Roast
General Mills
Hain Celestial
Impossible Foods
Nestlé S.A.
Perfect Day
SunOpta
Yofix Probiotics
*- List Not Exhaustive
Chapter 1. TABLE OF CONTENTS
Chapter 2. Introduction to Fermented Plant Food Market
2.1. Market Overview
2.2. Key Statistics and Report Highlights
2.3. Scope of the Comprehensive Study
2.3.1. Market Definition
2.3.2 Countries and Regions Covered
2.3.3 Research Objective
2.3.4 Units, Currency, and Conversions
2.3.5 Industry Value Chain
2.4. Key Market Segments
2.5. Key Companies
2.6. Study Period
Chapter 3. Strategic Analysis Review
3.1. Fermented Plant Food Pricing Analysis and Forecast
3.2. Porter’s Five Forces
3.3. Market Ecosystem
3.4. SWOT Analysis
3.5. Regulatory Scenario
3.3. Effects of Inflation, Russia-Ukraine War, moderating economic growth, and other macroeconomic factors
Chapter 4. Competitive Landscape
4.1. Market Share Analysis
4.1.1. Global Fermented Plant Food Market Share by Company, 2023
4.1.2. Product Offerings of Leading Fermented Plant Food Companies
4.2. Market Entropy
4.2.1. New Product Launches in the Industry
4.2.2. Mergers, Acquisitions, Joint ventures, and Partnerships
4.3. Key Strategies and Best Practices
Chapter 5. Global Market Projections: Best, Reference, and Low Case Scenarios
5.1. Growth Analysis- Case Scenario Definitions
5.2. Low Growth Case Scenario Forecasts
5.3. Reference Growth Case Scenario Forecasts
5.4. High Growth Case Scenario Forecasts
Chapter 6. Market Dynamics
6.1. Fermented Plant Food Market Drivers
6.2. Fermented Plant Food Market Challenges
6.6. Fermented Plant Food Market Opportunities
6.4. Fermented Plant Food Market Trends
Chapter 7. Global Fermented Plant Food Market Outlook Trends
7.1. Global Fermented Plant Food Revenue (USD Million) and CAGR (%) by Type (2021-2032)
7.2. Global Fermented Plant Food Revenue (USD Million) and CAGR (%) by Application (2021-2032)
7.3. Global Fermented Plant Food Revenue (USD Million) and CAGR (%) by Product (2021-2032)
By Type
Dairy Substitutes
Meat Substitutes
Seasoning Substitutes
Others
By Application
Supermarkets
Specialty Stores
Online
Chapter 8. Global Fermented Plant Food Regional Analysis and Outlook
8.1. Global Fermented Plant Food Revenue (USD Million) By Regions (2021- 2032)
8.2. North America Fermented Plant Food Revenue (USD Million) by Country (2021-2032)
8.2.1. United States Fermented Plant Food Regional Analysis and Outlook
8.2.2. Canada Fermented Plant Food Regional Analysis and Outlook
8.2.3. Mexico Fermented Plant Food Regional Analysis and Outlook
8.3. Europe Fermented Plant Food Revenue (USD Million), by Country (2021-2032)
8.3.1. Germany Fermented Plant Food Regional Analysis and Outlook
8.3.2. France Fermented Plant Food Regional Analysis and Outlook
8.3.3. United Kingdom Fermented Plant Food Regional Analysis and Outlook
8.3.4. Spain Fermented Plant Food Regional Analysis and Outlook
8.3.5. Italy Fermented Plant Food Regional Analysis and Outlook
8.3.6. Russia Fermented Plant Food Regional Analysis and Outlook
8.3.7. Rest of Europe Fermented Plant Food Regional Analysis and Outlook
8.4. Asia Pacific Fermented Plant Food Revenue (USD Million) by Country (2021-2032)
8.4.1. China Fermented Plant Food Regional Analysis and Outlook
8.4.2. Japan Fermented Plant Food Regional Analysis and Outlook
8.4.3. India Fermented Plant Food Regional Analysis and Outlook
8.4.4. South Korea Fermented Plant Food Regional Analysis and Outlook
8.4.5. Australia Fermented Plant Food Regional Analysis and Outlook
8.4.6. South East Asia Fermented Plant Food Regional Analysis and Outlook
8.4.7. Rest of Asia Pacific Fermented Plant Food Regional Analysis and Outlook
8.5. South America Fermented Plant Food Revenue (USD Million), by Country (2021-2032)
8.5.1. Brazil Fermented Plant Food Regional Analysis and Outlook
8.5.2. Argentina Fermented Plant Food Regional Analysis and Outlook
8.5.3. Rest of South America Fermented Plant Food Regional Analysis and Outlook
8.6. Middle East and Africa Fermented Plant Food Revenue (USD Million) by Country (2021-2032)
8.6.1. Middle East Fermented Plant Food Regional Analysis and Outlook
8.6.2. Africa Fermented Plant Food Regional Analysis and Outlook
Chapter 9. North America Fermented Plant Food Analysis and Outlook
9.1. North America Fermented Plant Food Revenue (USD Million) by Segments (2021-2032)
9.1.1. North America Fermented Plant Food Revenue (USD Million) by Type (2021-2032)
9.1.2. North America Fermented Plant Food Revenue (USD Million) by Application (2021-2032)
9.1.3. North America Fermented Plant Food Revenue (USD Million) by Product (2021-2032)
By Type
Dairy Substitutes
Meat Substitutes
Seasoning Substitutes
Others
By Application
Supermarkets
Specialty Stores
Online
Chapter 10. Europe Fermented Plant Food Analysis and Outlook
10.1. Europe Fermented Plant Food Revenue (USD Million), by Segments (USD Million) (2021-2032)
10.1.1. Europe Fermented Plant Food Revenue (USD Million) by Type (2021-2032)
10.1.2. Europe Fermented Plant Food Revenue (USD Million) by Application (2021-2032)
10.1.3. Europe Fermented Plant Food Revenue (USD Million) by Product (2021-2032)
By Type
Dairy Substitutes
Meat Substitutes
Seasoning Substitutes
Others
By Application
Supermarkets
Specialty Stores
Online
Chapter 11. Asia Pacific Fermented Plant Food Analysis and Outlook
11.1. Asia Pacific Fermented Plant Food Revenue (USD Million), and Revenue (USD Million) by Segments (2021-2032)
11.1.1. Asia Pacific Fermented Plant Food Revenue (USD Million) by Type (2021-2032)
11.1.2. Asia Pacific Fermented Plant Food Revenue (USD Million) by Application (2021-2032)
11.1.3. Asia Pacific Fermented Plant Food Revenue (USD Million) by Product (2021-2032)
By Type
Dairy Substitutes
Meat Substitutes
Seasoning Substitutes
Others
By Application
Supermarkets
Specialty Stores
Online
Chapter 12. South America Fermented Plant Food Analysis and Outlook
12.1. South America Fermented Plant Food Revenue (USD Million), by Segments (2021-2032)
12.1.1. South America Fermented Plant Food Revenue (USD Million) by Type (2021-2032)
12.1.2. South America Fermented Plant Food Revenue (USD Million) by Application (2021-2032)
12.1.3. South America Fermented Plant Food Revenue (USD Million) by Product (2021-2032)
By Type
Dairy Substitutes
Meat Substitutes
Seasoning Substitutes
Others
By Application
Supermarkets
Specialty Stores
Online
Chapter 13. Middle East and Africa Fermented Plant Food Analysis and Outlook
13.1. Middle East and Africa Fermented Plant Food Revenue (USD Million), by Segments (2021-2032)
13.1.1. Middle East and Africa Fermented Plant Food Revenue (USD Million) by Type (2021-2032)
13.1.2. Middle East and Africa Fermented Plant Food Revenue (USD Million) by Application (2021-2032)
13.1.3. Middle East and Africa Fermented Plant Food Revenue (USD Million) by Product (2021-2032)
By Type
Dairy Substitutes
Meat Substitutes
Seasoning Substitutes
Others
By Application
Supermarkets
Specialty Stores
Online
Chapter 14. Fermented Plant Food Company Profiles
14.1 Business Overview
14.2 Product Profiles
14.3 SWOT Profiles
14.5 Recent Developments
14.6 Financial Profile
List of Companies
Clara Foods
Danone S.A.
Field Roast
General Mills
Hain Celestial
Impossible Foods
Nestlé S.A.
Perfect Day
SunOpta
Yofix Probiotics
15. Methodology and Data Sources
15.1 Customization Offerings
15.2 Subscription Services
15.3 Related Reports
15.4 Publisher Expertise
LIST OF TABLES
Table 1 Market Segmentation Analysis
Table 2 Global Fermented Plant Food Market Share of Leading Companies, 2023
Table 3 Product Offerings of Leading Companies
Table 4 Low Growth Scenario Forecasts
Table 5 Reference Case Growth Scenario
Table 6 High Growth Case Scenario
Table 7 Global Fermented Plant Food Revenue (USD Million) And CAGR (%) By Type (2021-2032)
Table 8 Global Fermented Plant Food Revenue (USD Million) And CAGR (%) By Application (2021-2032)
Table 9 Global Fermented Plant Food Revenue (USD Million) And CAGR (%) By Product (2021-2032)
Table 10 Global Fermented Plant Food Market Revenue (USD Million) By Regions (2021-2032)
Table 11 Global Fermented Plant Food Market Share (%) By Regions (2021-2032)
Table 12 North America Fermented Plant Food Revenue (USD Million) By Country (2021-2032)
Table 13 Europe Fermented Plant Food Revenue (USD Million) By Country (2021-2032)
Table 14 Asia Pacific Fermented Plant Food Revenue (USD Million) By Country (2021-2032)
Table 15 South America Fermented Plant Food Revenue (USD Million) By Country (2021-2032)
Table 16 Middle East and Africa Fermented Plant Food Revenue (USD Million) By Region (2021-2032)
Table 17 North America Fermented Plant Food Revenue (USD Million) By Type (2021-2032)
Table 18 North America Fermented Plant Food Revenue (USD Million) By Application (2021-2032)
Table 19 North America Fermented Plant Food Revenue (USD Million) By Product (2021-2032)
Table 20 Europe Fermented Plant Food Revenue (USD Million) By Type (2021-2032)
Table 21 Europe Fermented Plant Food Revenue (USD Million) By Application (2021-2032)
Table 22 Europe Fermented Plant Food Revenue (USD Million) By Product (2021-2032)
Table 23 Asia Pacific Fermented Plant Food Revenue (USD Million) By Type (2021-2032)
Table 24 Asia Pacific Fermented Plant Food Revenue (USD Million) By Application (2021-2032)
Table 25 Asia Pacific Fermented Plant Food Revenue (USD Million) By Product (2021-2032)
Table 26 South America Fermented Plant Food Revenue (USD Million) By Type (2021-2032)
Table 27 South America Fermented Plant Food Revenue (USD Million) By Application (2021-2032)
Table 28 South America Fermented Plant Food Revenue (USD Million) By Product (2021-2032)
Table 29 Middle East and Africa Fermented Plant Food Revenue (USD Million) By Type (2021-2032)
Table 30 Middle East and Africa Fermented Plant Food Revenue (USD Million) By Application (2021-2032)
Table 31 Middle East and Africa Fermented Plant Food Revenue (USD Million) By Product (2021-2032)
LIST OF FIGURES
Figure 1. Market Scope
Figure 2. Pricing Forecasts Per Unit, 2023- 2032
Figure 3. Porter’s Five Forces
Figure 4. Global Fermented Plant Food Market Revenue (USD Million) By Regions (2021-2032)
Figure 5. Global Fermented Plant Food Market Share (%) By Regions (2023)
Figure 6. North America Fermented Plant Food Revenue (USD Million) By Country (2021-2032)
Figure 7. United States Fermented Plant Food Revenue (USD Million) By Country (2021-2032)
Figure 8. Canada Fermented Plant Food Revenue (USD Million) By Country (2021-2032)
Figure 9. Mexico Fermented Plant Food Revenue (USD Million) By Country (2021-2032)
Figure 10. Europe Fermented Plant Food Revenue (USD Million) By Country (2021-2032)
Figure 11. Germany Fermented Plant Food Revenue (USD Million) By Country (2021-2032)
Figure 12. France Fermented Plant Food Revenue (USD Million) By Country (2021-2032)
Figure 13. United Kingdom Fermented Plant Food Revenue (USD Million) By Country (2021-2032)
Figure 14. Spain Fermented Plant Food Revenue (USD Million) By Country (2021-2032)
Figure 15. Italy Fermented Plant Food Revenue (USD Million) By Country (2021-2032)
Figure 16. Russia Fermented Plant Food Revenue (USD Million) By Country (2021-2032)
Figure 17. Rest of Europe Fermented Plant Food Revenue (USD Million) By Country (2021-2032)
Figure 11. Asia Pacific Fermented Plant Food Revenue (USD Million) By Country (2021-2032)
Figure 12. China Fermented Plant Food Revenue (USD Million) By Country (2021-2032)
Figure 13. Japan Fermented Plant Food Revenue (USD Million) By Country (2021-2032)
Figure 14. India Fermented Plant Food Revenue (USD Million) By Country (2021-2032)
Figure 15. South Korea Fermented Plant Food Revenue (USD Million) By Country (2021-2032)
Figure 16. Australia Fermented Plant Food Revenue (USD Million) By Country (2021-2032)
Figure 17. South East Asia Fermented Plant Food Revenue (USD Million) By Country (2021-2032)
Figure 18. South America Fermented Plant Food Revenue (USD Million) By Country (2021-2032)
Figure 19. Brazil Fermented Plant Food Revenue (USD Million) By Country (2021-2032)
Figure 20. Argentina Fermented Plant Food Revenue (USD Million) By Country (2021-2032)
Figure 21. Rest of Asia Pacific Fermented Plant Food Revenue (USD Million) By Country (2021-2032)
Figure 22. Middle East and Africa Fermented Plant Food Revenue (USD Million) By Region (2021-2032)
Figure 23. Saudi Arabia Fermented Plant Food Revenue (USD Million) By Region (2021-2032)
Figure 24. The UAE Fermented Plant Food Revenue (USD Million) By Region (2021-2032)
Figure 25. Rest of Middle East Fermented Plant Food Revenue (USD Million) By Region (2021-2032)
Figure 26. South Africa Fermented Plant Food Revenue (USD Million) By Region (2021-2032)
Figure 27. Africa Fermented Plant Food Revenue (USD Million) By Region (2021-2032)
Figure 28. North America Fermented Plant Food Revenue (USD Million) By Type (2021-2032)
Figure 29. North America Fermented Plant Food Revenue (USD Million) By Application (2021-2032)
Figure 30. North America Fermented Plant Food Revenue (USD Million) By Product (2021-2032)
Figure 31. Europe Fermented Plant Food Revenue (USD Million) By Type (2021-2032)
Figure 32. Europe Fermented Plant Food Revenue (USD Million) By Application (2021-2032)
Figure 33. Europe Fermented Plant Food Revenue (USD Million) By Product (2021-2032)
Figure 34. Asia Pacific Fermented Plant Food Revenue (USD Million) By Type (2021-2032)
Figure 35. Asia Pacific Fermented Plant Food Revenue (USD Million) By Application (2021-2032)
Figure 36. Asia Pacific Fermented Plant Food Revenue (USD Million) By Product (2021-2032)
Figure 37. South America Fermented Plant Food Revenue (USD Million) By Type (2021-2032)
Figure 38. South America Fermented Plant Food Revenue (USD Million) By Application (2021-2032)
Figure 39. South America Fermented Plant Food Revenue (USD Million) By Product (2021-2032)
Figure 40. Middle East and Africa Fermented Plant Food Revenue (USD Million) By Type (2021-2032)
Figure 41. Middle East and Africa Fermented Plant Food Revenue (USD Million) By Application (2021-2032)
Figure 42. Middle East and Africa Fermented Plant Food Revenue (USD Million) By Product (2021-2032)
By Type
Dairy Substitutes
Meat Substitutes
Seasoning Substitutes
Others
By Application
Supermarkets
Specialty Stores
Online
Countries Analyzed
North America (US, Canada, Mexico)
Europe (Germany, UK, France, Spain, Italy, Russia, Rest of Europe)
Asia Pacific (China, India, Japan, South Korea, Australia, South East Asia, Rest of Asia)
South America (Brazil, Argentina, Rest of South America)
Middle East and Africa (Saudi Arabia, UAE, Rest of Middle East, South Africa, Egypt, Rest of Africa)
