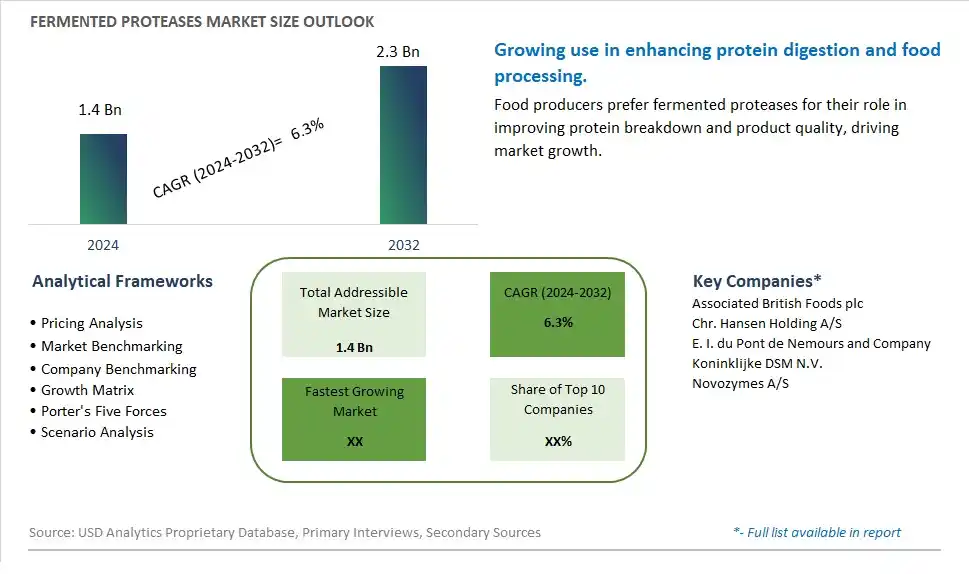
Global Fermented Proteases Market Size is valued at $1.4 Billion in 2024 and is forecast to register a growth rate (CAGR) of 6.3% to reach $2.3 Billion by 2032.
The global Fermented Proteases Market Comprehensive Study analyzes and forecasts the market size across 6 regions and 24 countries for diverse segments -By Type (Liquid Formulation, Lyophilized Powder, Others), By Application (Food & Beverages, Livestock Feed, Soaps & Detergent, Pharmaceuticals, Others)
An Introduction to Fermented Proteases Market
The Fermented Proteases market in 2024 is witnessing significant growth, driven by the increasing demand for natural and efficient enzymes in the food and beverage industry. Fermented proteases, produced through microbial fermentation, are used to improve protein digestion and enhance the texture and flavor of various food products. The market benefits from advancements in enzyme production technologies, the growing trend of clean label and natural ingredients, and the expansion of the functional food sector. Additionally, the increasing focus on food quality and processing efficiency is contributing to market growth.
Fermented Proteases Competitive Landscape
The market report analyses the leading companies in the industry including Associated British Foods plc, Chr. Hansen Holding A/S, E. I. du Pont de Nemours and Company, Koninklijke DSM N.V., Novozymes A/S, and Others.
Fermented Proteases Market Dynamics
Fermented Proteases Market Trend: Increasing Demand for Natural Enzymes in Food Industry
One of the most prominent market trends for fermented proteases is the increasing demand for natural enzymes in the food industry. As consumers seek cleaner labels and natural ingredients in their food products, there is a growing preference for enzymes derived from fermentation processes. Fermented proteases offer advantages such as improved processing efficiency, enhanced flavor development, and better texture in various food applications.
Fermented Proteases Market Driver: Advancements in Biotechnology and Enzyme Engineering
A key driver for the market of fermented proteases is the continuous advancements in biotechnology and enzyme engineering. These advancements have led to the development of more efficient and cost-effective fermentation processes for producing high-quality proteases. Enzyme manufacturers are leveraging biotechnological innovations to enhance enzyme properties, increase substrate specificity, and optimize enzyme performance, thereby meeting the diverse needs of the food industry.
Fermented Proteases Market Opportunity: Expanded Application in Food Processing
The market presents a significant opportunity for the expanded application of fermented proteases in food processing. With their ability to break down proteins, fermented proteases find extensive use in various food sectors such as dairy, bakery, meat processing, and plant-based protein products. Companies can capitalize on this opportunity by developing customized enzyme blends tailored to specific food formulations, improving protein functionality, and enhancing overall product quality. Additionally, there is potential for the development of novel enzyme-based solutions to address emerging challenges in food processing, such as clean label requirements and sustainability concerns.
Fermented Proteases Market Share Analysis: Liquid Formulation segment generated the highest revenue share in the industry
Liquid Formulation is the largest segment in the Fermented Proteases Market. This dominance is primarily due to the ease of integration of liquid enzymes into various industrial processes. Liquid proteases offer several advantages, including ease of handling, better enzyme activity, and uniformity in application, making them highly suitable for industries such as food and beverages, pharmaceuticals, and detergents. These enzymes play a crucial role in breaking down proteins into smaller peptides and amino acids, which is essential in processes like cheese making, meat tenderization, and the manufacture of protein supplements. The liquid formulation of proteases is preferred for its consistent quality and effectiveness, which ensures optimal performance in various applications. Additionally, liquid proteases are often more stable and can be easily dosed, providing significant operational advantages over other forms.
Fermented Proteases Market Share Analysis: Pharmaceuticals is the fastest growing segment over the forecast period to 2032
The Pharmaceuticals segment is projected to be the fastest-growing application in the Fermented Proteases Market by 2032. This growth is driven by the expanding use of proteases in various pharmaceutical applications, including drug formulation and manufacture, wound healing, and protein digestion supplements. Proteases are vital in the pharmaceutical industry for their ability to facilitate drug delivery systems and improve the bioavailability of medications. Their role in the production of active pharmaceutical ingredients (APIs) and in the degradation of unwanted proteins during manufacturing processes is also critical. Additionally, the rising demand for personalized medicine and targeted therapeutic treatments is increasing the need for high-quality enzymes that can be tailored to specific medical applications. The ongoing research and development in enzyme technology further enhance the capabilities and applications of proteases in this sector, contributing to its rapid growth.
Fermented Proteases Market Segmentation
By Type
Liquid Formulation
Lyophilized Powder
Others
By Application
Food & Beverages
Livestock Feed
Soaps & Detergent
Pharmaceuticals
Others
Countries Analyzed
North America (US, Canada, Mexico)
Europe (Germany, UK, France, Spain, Italy, Russia, Rest of Europe)
Asia Pacific (China, India, Japan, South Korea, Australia, South East Asia, Rest of Asia)
South America (Brazil, Argentina, Rest of South America)
Middle East and Africa (Saudi Arabia, UAE, Rest of Middle East, South Africa, Egypt, Rest of Africa)
Fermented Proteases Companies Profiled in the Study
Associated British Foods plc
Chr. Hansen Holding A/S
E. I. du Pont de Nemours and Company
Koninklijke DSM N.V.
Novozymes A/S
*- List Not Exhaustive
Chapter 1. TABLE OF CONTENTS
Chapter 2. Introduction to Fermented Proteases Market
2.1. Market Overview
2.2. Key Statistics and Report Highlights
2.3. Scope of the Comprehensive Study
2.3.1. Market Definition
2.3.2 Countries and Regions Covered
2.3.3 Research Objective
2.3.4 Units, Currency, and Conversions
2.3.5 Industry Value Chain
2.4. Key Market Segments
2.5. Key Companies
2.6. Study Period
Chapter 3. Strategic Analysis Review
3.1. Fermented Proteases Pricing Analysis and Forecast
3.2. Porter’s Five Forces
3.3. Market Ecosystem
3.4. SWOT Analysis
3.5. Regulatory Scenario
3.3. Effects of Inflation, Russia-Ukraine War, moderating economic growth, and other macroeconomic factors
Chapter 4. Competitive Landscape
4.1. Market Share Analysis
4.1.1. Global Fermented Proteases Market Share by Company, 2023
4.1.2. Product Offerings of Leading Fermented Proteases Companies
4.2. Market Entropy
4.2.1. New Product Launches in the Industry
4.2.2. Mergers, Acquisitions, Joint ventures, and Partnerships
4.3. Key Strategies and Best Practices
Chapter 5. Global Market Projections: Best, Reference, and Low Case Scenarios
5.1. Growth Analysis- Case Scenario Definitions
5.2. Low Growth Case Scenario Forecasts
5.3. Reference Growth Case Scenario Forecasts
5.4. High Growth Case Scenario Forecasts
Chapter 6. Market Dynamics
6.1. Fermented Proteases Market Drivers
6.2. Fermented Proteases Market Challenges
6.6. Fermented Proteases Market Opportunities
6.4. Fermented Proteases Market Trends
Chapter 7. Global Fermented Proteases Market Outlook Trends
7.1. Global Fermented Proteases Revenue (USD Million) and CAGR (%) by Type (2021-2032)
7.2. Global Fermented Proteases Revenue (USD Million) and CAGR (%) by Application (2021-2032)
7.3. Global Fermented Proteases Revenue (USD Million) and CAGR (%) by Product (2021-2032)
By Type
Liquid Formulation
Lyophilized Powder
Others
By Application
Food & Beverages
Livestock Feed
Soaps & Detergent
Pharmaceuticals
Others
Chapter 8. Global Fermented Proteases Regional Analysis and Outlook
8.1. Global Fermented Proteases Revenue (USD Million) By Regions (2021- 2032)
8.2. North America Fermented Proteases Revenue (USD Million) by Country (2021-2032)
8.2.1. United States Fermented Proteases Regional Analysis and Outlook
8.2.2. Canada Fermented Proteases Regional Analysis and Outlook
8.2.3. Mexico Fermented Proteases Regional Analysis and Outlook
8.3. Europe Fermented Proteases Revenue (USD Million), by Country (2021-2032)
8.3.1. Germany Fermented Proteases Regional Analysis and Outlook
8.3.2. France Fermented Proteases Regional Analysis and Outlook
8.3.3. United Kingdom Fermented Proteases Regional Analysis and Outlook
8.3.4. Spain Fermented Proteases Regional Analysis and Outlook
8.3.5. Italy Fermented Proteases Regional Analysis and Outlook
8.3.6. Russia Fermented Proteases Regional Analysis and Outlook
8.3.7. Rest of Europe Fermented Proteases Regional Analysis and Outlook
8.4. Asia Pacific Fermented Proteases Revenue (USD Million) by Country (2021-2032)
8.4.1. China Fermented Proteases Regional Analysis and Outlook
8.4.2. Japan Fermented Proteases Regional Analysis and Outlook
8.4.3. India Fermented Proteases Regional Analysis and Outlook
8.4.4. South Korea Fermented Proteases Regional Analysis and Outlook
8.4.5. Australia Fermented Proteases Regional Analysis and Outlook
8.4.6. South East Asia Fermented Proteases Regional Analysis and Outlook
8.4.7. Rest of Asia Pacific Fermented Proteases Regional Analysis and Outlook
8.5. South America Fermented Proteases Revenue (USD Million), by Country (2021-2032)
8.5.1. Brazil Fermented Proteases Regional Analysis and Outlook
8.5.2. Argentina Fermented Proteases Regional Analysis and Outlook
8.5.3. Rest of South America Fermented Proteases Regional Analysis and Outlook
8.6. Middle East and Africa Fermented Proteases Revenue (USD Million) by Country (2021-2032)
8.6.1. Middle East Fermented Proteases Regional Analysis and Outlook
8.6.2. Africa Fermented Proteases Regional Analysis and Outlook
Chapter 9. North America Fermented Proteases Analysis and Outlook
9.1. North America Fermented Proteases Revenue (USD Million) by Segments (2021-2032)
9.1.1. North America Fermented Proteases Revenue (USD Million) by Type (2021-2032)
9.1.2. North America Fermented Proteases Revenue (USD Million) by Application (2021-2032)
9.1.3. North America Fermented Proteases Revenue (USD Million) by Product (2021-2032)
By Type
Liquid Formulation
Lyophilized Powder
Others
By Application
Food & Beverages
Livestock Feed
Soaps & Detergent
Pharmaceuticals
Others
Chapter 10. Europe Fermented Proteases Analysis and Outlook
10.1. Europe Fermented Proteases Revenue (USD Million), by Segments (USD Million) (2021-2032)
10.1.1. Europe Fermented Proteases Revenue (USD Million) by Type (2021-2032)
10.1.2. Europe Fermented Proteases Revenue (USD Million) by Application (2021-2032)
10.1.3. Europe Fermented Proteases Revenue (USD Million) by Product (2021-2032)
By Type
Liquid Formulation
Lyophilized Powder
Others
By Application
Food & Beverages
Livestock Feed
Soaps & Detergent
Pharmaceuticals
Others
Chapter 11. Asia Pacific Fermented Proteases Analysis and Outlook
11.1. Asia Pacific Fermented Proteases Revenue (USD Million), and Revenue (USD Million) by Segments (2021-2032)
11.1.1. Asia Pacific Fermented Proteases Revenue (USD Million) by Type (2021-2032)
11.1.2. Asia Pacific Fermented Proteases Revenue (USD Million) by Application (2021-2032)
11.1.3. Asia Pacific Fermented Proteases Revenue (USD Million) by Product (2021-2032)
By Type
Liquid Formulation
Lyophilized Powder
Others
By Application
Food & Beverages
Livestock Feed
Soaps & Detergent
Pharmaceuticals
Others
Chapter 12. South America Fermented Proteases Analysis and Outlook
12.1. South America Fermented Proteases Revenue (USD Million), by Segments (2021-2032)
12.1.1. South America Fermented Proteases Revenue (USD Million) by Type (2021-2032)
12.1.2. South America Fermented Proteases Revenue (USD Million) by Application (2021-2032)
12.1.3. South America Fermented Proteases Revenue (USD Million) by Product (2021-2032)
By Type
Liquid Formulation
Lyophilized Powder
Others
By Application
Food & Beverages
Livestock Feed
Soaps & Detergent
Pharmaceuticals
Others
Chapter 13. Middle East and Africa Fermented Proteases Analysis and Outlook
13.1. Middle East and Africa Fermented Proteases Revenue (USD Million), by Segments (2021-2032)
13.1.1. Middle East and Africa Fermented Proteases Revenue (USD Million) by Type (2021-2032)
13.1.2. Middle East and Africa Fermented Proteases Revenue (USD Million) by Application (2021-2032)
13.1.3. Middle East and Africa Fermented Proteases Revenue (USD Million) by Product (2021-2032)
By Type
Liquid Formulation
Lyophilized Powder
Others
By Application
Food & Beverages
Livestock Feed
Soaps & Detergent
Pharmaceuticals
Others
Chapter 14. Fermented Proteases Company Profiles
14.1 Business Overview
14.2 Product Profiles
14.3 SWOT Profiles
14.5 Recent Developments
14.6 Financial Profile
List of Companies
Associated British Foods plc
Chr. Hansen Holding A/S
E. I. du Pont de Nemours and Company
Koninklijke DSM N.V.
Novozymes A/S
15. Methodology and Data Sources
15.1 Customization Offerings
15.2 Subscription Services
15.3 Related Reports
15.4 Publisher Expertise
LIST OF TABLES
Table 1 Market Segmentation Analysis
Table 2 Global Fermented Proteases Market Share of Leading Companies, 2023
Table 3 Product Offerings of Leading Companies
Table 4 Low Growth Scenario Forecasts
Table 5 Reference Case Growth Scenario
Table 6 High Growth Case Scenario
Table 7 Global Fermented Proteases Revenue (USD Million) And CAGR (%) By Type (2021-2032)
Table 8 Global Fermented Proteases Revenue (USD Million) And CAGR (%) By Application (2021-2032)
Table 9 Global Fermented Proteases Revenue (USD Million) And CAGR (%) By Product (2021-2032)
Table 10 Global Fermented Proteases Market Revenue (USD Million) By Regions (2021-2032)
Table 11 Global Fermented Proteases Market Share (%) By Regions (2021-2032)
Table 12 North America Fermented Proteases Revenue (USD Million) By Country (2021-2032)
Table 13 Europe Fermented Proteases Revenue (USD Million) By Country (2021-2032)
Table 14 Asia Pacific Fermented Proteases Revenue (USD Million) By Country (2021-2032)
Table 15 South America Fermented Proteases Revenue (USD Million) By Country (2021-2032)
Table 16 Middle East and Africa Fermented Proteases Revenue (USD Million) By Region (2021-2032)
Table 17 North America Fermented Proteases Revenue (USD Million) By Type (2021-2032)
Table 18 North America Fermented Proteases Revenue (USD Million) By Application (2021-2032)
Table 19 North America Fermented Proteases Revenue (USD Million) By Product (2021-2032)
Table 20 Europe Fermented Proteases Revenue (USD Million) By Type (2021-2032)
Table 21 Europe Fermented Proteases Revenue (USD Million) By Application (2021-2032)
Table 22 Europe Fermented Proteases Revenue (USD Million) By Product (2021-2032)
Table 23 Asia Pacific Fermented Proteases Revenue (USD Million) By Type (2021-2032)
Table 24 Asia Pacific Fermented Proteases Revenue (USD Million) By Application (2021-2032)
Table 25 Asia Pacific Fermented Proteases Revenue (USD Million) By Product (2021-2032)
Table 26 South America Fermented Proteases Revenue (USD Million) By Type (2021-2032)
Table 27 South America Fermented Proteases Revenue (USD Million) By Application (2021-2032)
Table 28 South America Fermented Proteases Revenue (USD Million) By Product (2021-2032)
Table 29 Middle East and Africa Fermented Proteases Revenue (USD Million) By Type (2021-2032)
Table 30 Middle East and Africa Fermented Proteases Revenue (USD Million) By Application (2021-2032)
Table 31 Middle East and Africa Fermented Proteases Revenue (USD Million) By Product (2021-2032)
LIST OF FIGURES
Figure 1. Market Scope
Figure 2. Pricing Forecasts Per Unit, 2023- 2032
Figure 3. Porter’s Five Forces
Figure 4. Global Fermented Proteases Market Revenue (USD Million) By Regions (2021-2032)
Figure 5. Global Fermented Proteases Market Share (%) By Regions (2023)
Figure 6. North America Fermented Proteases Revenue (USD Million) By Country (2021-2032)
Figure 7. United States Fermented Proteases Revenue (USD Million) By Country (2021-2032)
Figure 8. Canada Fermented Proteases Revenue (USD Million) By Country (2021-2032)
Figure 9. Mexico Fermented Proteases Revenue (USD Million) By Country (2021-2032)
Figure 10. Europe Fermented Proteases Revenue (USD Million) By Country (2021-2032)
Figure 11. Germany Fermented Proteases Revenue (USD Million) By Country (2021-2032)
Figure 12. France Fermented Proteases Revenue (USD Million) By Country (2021-2032)
Figure 13. United Kingdom Fermented Proteases Revenue (USD Million) By Country (2021-2032)
Figure 14. Spain Fermented Proteases Revenue (USD Million) By Country (2021-2032)
Figure 15. Italy Fermented Proteases Revenue (USD Million) By Country (2021-2032)
Figure 16. Russia Fermented Proteases Revenue (USD Million) By Country (2021-2032)
Figure 17. Rest of Europe Fermented Proteases Revenue (USD Million) By Country (2021-2032)
Figure 11. Asia Pacific Fermented Proteases Revenue (USD Million) By Country (2021-2032)
Figure 12. China Fermented Proteases Revenue (USD Million) By Country (2021-2032)
Figure 13. Japan Fermented Proteases Revenue (USD Million) By Country (2021-2032)
Figure 14. India Fermented Proteases Revenue (USD Million) By Country (2021-2032)
Figure 15. South Korea Fermented Proteases Revenue (USD Million) By Country (2021-2032)
Figure 16. Australia Fermented Proteases Revenue (USD Million) By Country (2021-2032)
Figure 17. South East Asia Fermented Proteases Revenue (USD Million) By Country (2021-2032)
Figure 18. South America Fermented Proteases Revenue (USD Million) By Country (2021-2032)
Figure 19. Brazil Fermented Proteases Revenue (USD Million) By Country (2021-2032)
Figure 20. Argentina Fermented Proteases Revenue (USD Million) By Country (2021-2032)
Figure 21. Rest of Asia Pacific Fermented Proteases Revenue (USD Million) By Country (2021-2032)
Figure 22. Middle East and Africa Fermented Proteases Revenue (USD Million) By Region (2021-2032)
Figure 23. Saudi Arabia Fermented Proteases Revenue (USD Million) By Region (2021-2032)
Figure 24. The UAE Fermented Proteases Revenue (USD Million) By Region (2021-2032)
Figure 25. Rest of Middle East Fermented Proteases Revenue (USD Million) By Region (2021-2032)
Figure 26. South Africa Fermented Proteases Revenue (USD Million) By Region (2021-2032)
Figure 27. Africa Fermented Proteases Revenue (USD Million) By Region (2021-2032)
Figure 28. North America Fermented Proteases Revenue (USD Million) By Type (2021-2032)
Figure 29. North America Fermented Proteases Revenue (USD Million) By Application (2021-2032)
Figure 30. North America Fermented Proteases Revenue (USD Million) By Product (2021-2032)
Figure 31. Europe Fermented Proteases Revenue (USD Million) By Type (2021-2032)
Figure 32. Europe Fermented Proteases Revenue (USD Million) By Application (2021-2032)
Figure 33. Europe Fermented Proteases Revenue (USD Million) By Product (2021-2032)
Figure 34. Asia Pacific Fermented Proteases Revenue (USD Million) By Type (2021-2032)
Figure 35. Asia Pacific Fermented Proteases Revenue (USD Million) By Application (2021-2032)
Figure 36. Asia Pacific Fermented Proteases Revenue (USD Million) By Product (2021-2032)
Figure 37. South America Fermented Proteases Revenue (USD Million) By Type (2021-2032)
Figure 38. South America Fermented Proteases Revenue (USD Million) By Application (2021-2032)
Figure 39. South America Fermented Proteases Revenue (USD Million) By Product (2021-2032)
Figure 40. Middle East and Africa Fermented Proteases Revenue (USD Million) By Type (2021-2032)
Figure 41. Middle East and Africa Fermented Proteases Revenue (USD Million) By Application (2021-2032)
Figure 42. Middle East and Africa Fermented Proteases Revenue (USD Million) By Product (2021-2032)
By Type
Liquid Formulation
Lyophilized Powder
Others
By Application
Food & Beverages
Livestock Feed
Soaps & Detergent
Pharmaceuticals
Others
Countries Analyzed
North America (US, Canada, Mexico)
Europe (Germany, UK, France, Spain, Italy, Russia, Rest of Europe)
Asia Pacific (China, India, Japan, South Korea, Australia, South East Asia, Rest of Asia)
South America (Brazil, Argentina, Rest of South America)
Middle East and Africa (Saudi Arabia, UAE, Rest of Middle East, South Africa, Egypt, Rest of Africa)
