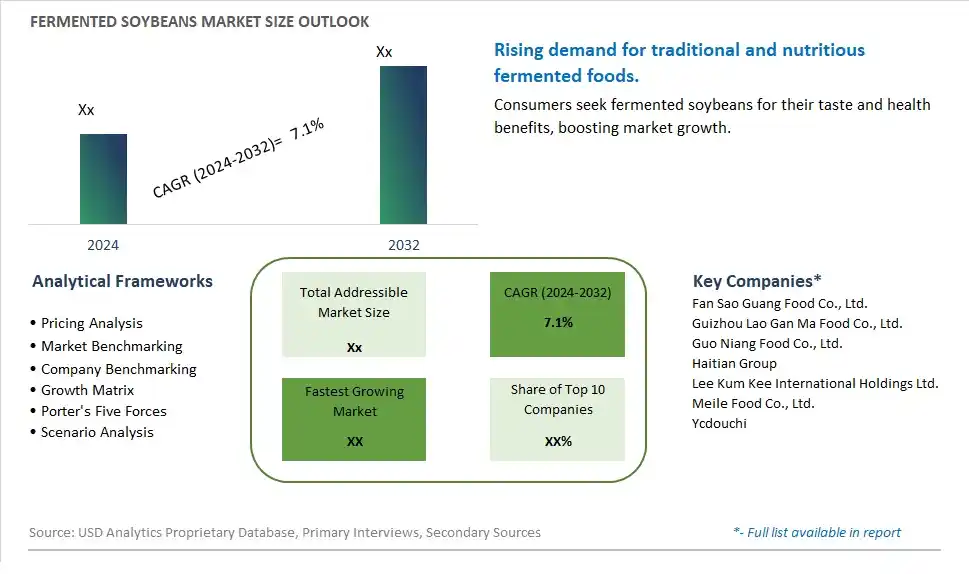
Global Fermented Soybeans Market Size is valued at $XX Million in 2024 and is forecast to register a growth rate (CAGR) of 7.1% to reach $XX Million by 2032.
The global Fermented Soybeans Market Comprehensive Study analyzes and forecasts the market size across 6 regions and 24 countries for diverse segments -By Source (GM, Non-GM), By Application (Particles, Sauce)
An Introduction to Fermented Soybeans Market
In 2024, the Fermented Soya Beans market is thriving, fueled by the rising demand for traditional and probiotic-rich foods. Fermented soya beans, such as natto, tempeh, and miso, are popular in various cuisines for their unique flavors and health benefits. The market benefits from advancements in fermentation and preservation technologies, the growing trend of plant-based diets, and the expansion of the global culinary scene. Additionally, the increasing awareness of the benefits of fermented foods, including improved digestion and gut health, is driving market growth.
Fermented Soybeans Competitive Landscape
The market report analyses the leading companies in the industry including Fan Sao Guang Food Co., Ltd., Guizhou Lao Gan Ma Food Co., Ltd., Guo Niang Food Co., Ltd., Haitian Group, Lee Kum Kee International Holdings Ltd., Meile Food Co., Ltd., Ycdouchi, and Others.
Fermented Soybeans Market Dynamics
Fermented Soya Beans Market Trend: Growing Demand for Plant-Based Protein Sources
A prominent market trend for fermented soya beans is the growing demand for plant-based protein sources. With increasing consumer awareness of health and sustainability, there is a shift towards plant-based diets. Fermented soya beans, known for their high protein content and nutritional benefits, are gaining popularity as a versatile ingredient in various food products catering to vegetarian, vegan, and flexitarian consumers.
Fermented Soya Beans Market Driver: Health Conscious Consumer Preferences
A key driver for the market of fermented soya beans is the health-conscious preferences of consumers. Fermented soya beans are rich in essential amino acids, vitamins, and minerals, making them a valuable source of nutrition. The rising awareness of the health benefits associated with soya-based products, such as improved heart health, cholesterol management, and overall well-being, is driving the demand for fermented soya beans in the food industry.
Fermented Soya Beans Market Opportunity: Diverse Applications in Food Innovation
The market presents a significant opportunity for the diverse applications of fermented soya beans in food innovation. Food manufacturers can leverage the unique properties of fermented soya beans to develop innovative plant-based products such as plant-based meats, dairy alternatives, snacks, condiments, and fermented beverages. Additionally, there is potential for the development of functional ingredients and customized blends derived from fermented soya beans to enhance the nutritional profile, flavor, and texture of food products, meeting the evolving preferences of health-conscious consumers.
Fermented Soybeans Market Share Analysis- Largest Segment by Source
The Non-GM segment is the largest in the Fermented Soybeans Market by source. This dominance is driven by the increasing consumer preference for non-genetically modified (non-GM) food products, which are perceived as safer and more natural. Non-GM fermented soybeans, such as natto and tempeh, are popular among health-conscious consumers seeking clean-label and organic options. The growing awareness of the potential health and environmental impacts of genetically modified organisms (GMOs) further supports the demand for non-GM soybeans. Additionally, the continuous innovation in non-GM soybean products, including improved fermentation techniques and the introduction of new flavors and varieties, enhances their appeal. The extensive availability of non-GM fermented soybean products in health food stores, specialty stores, and online platforms also contributes to their significant market share. The strong consumer demand for non-GM and organic foods reinforces the dominance of the non-GM segment in the fermented soybeans market.
Fermented Soybeans Market Share Analysis- Fastest Growing Segment by Application
The Sauce segment is poised to grow the fastest in the Fermented Soybeans Market by application over the next five years. This rapid growth is driven by the increasing popularity of fermented soybean-based sauces, such as soy sauce and miso, which are essential ingredients in various cuisines around the world. Fermented soybean sauces are valued for their rich umami flavor, which enhances the taste of a wide range of dishes. The growing trend of global cuisine and the increasing consumer interest in Asian flavors support the demand for fermented soybean sauces. Additionally, the continuous innovation in sauce formulations, including reduced-sodium and gluten-free options, caters to health-conscious consumers and those with dietary restrictions. The expanding use of fermented soybean sauces in marinades, dressings, and dips further drives their adoption. The influence of food bloggers and cooking shows in promoting the versatility and flavor benefits of fermented soybean sauces also boosts their popularity and market growth.
Fermented Soybeans Market Segmentation
By Source
GM
Non-GM
By Application
Particles
Sauce
Countries Analyzed
North America (US, Canada, Mexico)
Europe (Germany, UK, France, Spain, Italy, Russia, Rest of Europe)
Asia Pacific (China, India, Japan, South Korea, Australia, South East Asia, Rest of Asia)
South America (Brazil, Argentina, Rest of South America)
Middle East and Africa (Saudi Arabia, UAE, Rest of Middle East, South Africa, Egypt, Rest of Africa)
Fermented Soybeans Companies Profiled in the Study
Fan Sao Guang Food Co., Ltd.
Guizhou Lao Gan Ma Food Co., Ltd.
Guo Niang Food Co., Ltd.
Haitian Group
Lee Kum Kee International Holdings Ltd.
Meile Food Co., Ltd.
Ycdouchi
*- List Not Exhaustive
Chapter 1. TABLE OF CONTENTS
Chapter 2. Introduction to Fermented Soybeans Market
2.1. Market Overview
2.2. Key Statistics and Report Highlights
2.3. Scope of the Comprehensive Study
2.3.1. Market Definition
2.3.2 Countries and Regions Covered
2.3.3 Research Objective
2.3.4 Units, Currency, and Conversions
2.3.5 Industry Value Chain
2.4. Key Market Segments
2.5. Key Companies
2.6. Study Period
Chapter 3. Strategic Analysis Review
3.1. Fermented Soybeans Pricing Analysis and Forecast
3.2. Porter’s Five Forces
3.3. Market Ecosystem
3.4. SWOT Analysis
3.5. Regulatory Scenario
3.3. Effects of Inflation, Russia-Ukraine War, moderating economic growth, and other macroeconomic factors
Chapter 4. Competitive Landscape
4.1. Market Share Analysis
4.1.1. Global Fermented Soybeans Market Share by Company, 2023
4.1.2. Product Offerings of Leading Fermented Soybeans Companies
4.2. Market Entropy
4.2.1. New Product Launches in the Industry
4.2.2. Mergers, Acquisitions, Joint ventures, and Partnerships
4.3. Key Strategies and Best Practices
Chapter 5. Global Market Projections: Best, Reference, and Low Case Scenarios
5.1. Growth Analysis- Case Scenario Definitions
5.2. Low Growth Case Scenario Forecasts
5.3. Reference Growth Case Scenario Forecasts
5.4. High Growth Case Scenario Forecasts
Chapter 6. Market Dynamics
6.1. Fermented Soybeans Market Drivers
6.2. Fermented Soybeans Market Challenges
6.6. Fermented Soybeans Market Opportunities
6.4. Fermented Soybeans Market Trends
Chapter 7. Global Fermented Soybeans Market Outlook Trends
7.1. Global Fermented Soybeans Revenue (USD Million) and CAGR (%) by Type (2021-2032)
7.2. Global Fermented Soybeans Revenue (USD Million) and CAGR (%) by Application (2021-2032)
7.3. Global Fermented Soybeans Revenue (USD Million) and CAGR (%) by Product (2021-2032)
By Source
GM
Non-GM
By Application
Particles
Sauce
Chapter 8. Global Fermented Soybeans Regional Analysis and Outlook
8.1. Global Fermented Soybeans Revenue (USD Million) By Regions (2021- 2032)
8.2. North America Fermented Soybeans Revenue (USD Million) by Country (2021-2032)
8.2.1. United States Fermented Soybeans Regional Analysis and Outlook
8.2.2. Canada Fermented Soybeans Regional Analysis and Outlook
8.2.3. Mexico Fermented Soybeans Regional Analysis and Outlook
8.3. Europe Fermented Soybeans Revenue (USD Million), by Country (2021-2032)
8.3.1. Germany Fermented Soybeans Regional Analysis and Outlook
8.3.2. France Fermented Soybeans Regional Analysis and Outlook
8.3.3. United Kingdom Fermented Soybeans Regional Analysis and Outlook
8.3.4. Spain Fermented Soybeans Regional Analysis and Outlook
8.3.5. Italy Fermented Soybeans Regional Analysis and Outlook
8.3.6. Russia Fermented Soybeans Regional Analysis and Outlook
8.3.7. Rest of Europe Fermented Soybeans Regional Analysis and Outlook
8.4. Asia Pacific Fermented Soybeans Revenue (USD Million) by Country (2021-2032)
8.4.1. China Fermented Soybeans Regional Analysis and Outlook
8.4.2. Japan Fermented Soybeans Regional Analysis and Outlook
8.4.3. India Fermented Soybeans Regional Analysis and Outlook
8.4.4. South Korea Fermented Soybeans Regional Analysis and Outlook
8.4.5. Australia Fermented Soybeans Regional Analysis and Outlook
8.4.6. South East Asia Fermented Soybeans Regional Analysis and Outlook
8.4.7. Rest of Asia Pacific Fermented Soybeans Regional Analysis and Outlook
8.5. South America Fermented Soybeans Revenue (USD Million), by Country (2021-2032)
8.5.1. Brazil Fermented Soybeans Regional Analysis and Outlook
8.5.2. Argentina Fermented Soybeans Regional Analysis and Outlook
8.5.3. Rest of South America Fermented Soybeans Regional Analysis and Outlook
8.6. Middle East and Africa Fermented Soybeans Revenue (USD Million) by Country (2021-2032)
8.6.1. Middle East Fermented Soybeans Regional Analysis and Outlook
8.6.2. Africa Fermented Soybeans Regional Analysis and Outlook
Chapter 9. North America Fermented Soybeans Analysis and Outlook
9.1. North America Fermented Soybeans Revenue (USD Million) by Segments (2021-2032)
9.1.1. North America Fermented Soybeans Revenue (USD Million) by Type (2021-2032)
9.1.2. North America Fermented Soybeans Revenue (USD Million) by Application (2021-2032)
9.1.3. North America Fermented Soybeans Revenue (USD Million) by Product (2021-2032)
By Source
GM
Non-GM
By Application
Particles
Sauce
Chapter 10. Europe Fermented Soybeans Analysis and Outlook
10.1. Europe Fermented Soybeans Revenue (USD Million), by Segments (USD Million) (2021-2032)
10.1.1. Europe Fermented Soybeans Revenue (USD Million) by Type (2021-2032)
10.1.2. Europe Fermented Soybeans Revenue (USD Million) by Application (2021-2032)
10.1.3. Europe Fermented Soybeans Revenue (USD Million) by Product (2021-2032)
By Source
GM
Non-GM
By Application
Particles
Sauce
Chapter 11. Asia Pacific Fermented Soybeans Analysis and Outlook
11.1. Asia Pacific Fermented Soybeans Revenue (USD Million), and Revenue (USD Million) by Segments (2021-2032)
11.1.1. Asia Pacific Fermented Soybeans Revenue (USD Million) by Type (2021-2032)
11.1.2. Asia Pacific Fermented Soybeans Revenue (USD Million) by Application (2021-2032)
11.1.3. Asia Pacific Fermented Soybeans Revenue (USD Million) by Product (2021-2032)
By Source
GM
Non-GM
By Application
Particles
Sauce
Chapter 12. South America Fermented Soybeans Analysis and Outlook
12.1. South America Fermented Soybeans Revenue (USD Million), by Segments (2021-2032)
12.1.1. South America Fermented Soybeans Revenue (USD Million) by Type (2021-2032)
12.1.2. South America Fermented Soybeans Revenue (USD Million) by Application (2021-2032)
12.1.3. South America Fermented Soybeans Revenue (USD Million) by Product (2021-2032)
By Source
GM
Non-GM
By Application
Particles
Sauce
Chapter 13. Middle East and Africa Fermented Soybeans Analysis and Outlook
13.1. Middle East and Africa Fermented Soybeans Revenue (USD Million), by Segments (2021-2032)
13.1.1. Middle East and Africa Fermented Soybeans Revenue (USD Million) by Type (2021-2032)
13.1.2. Middle East and Africa Fermented Soybeans Revenue (USD Million) by Application (2021-2032)
13.1.3. Middle East and Africa Fermented Soybeans Revenue (USD Million) by Product (2021-2032)
By Source
GM
Non-GM
By Application
Particles
Sauce
Chapter 14. Fermented Soybeans Company Profiles
14.1 Business Overview
14.2 Product Profiles
14.3 SWOT Profiles
14.5 Recent Developments
14.6 Financial Profile
List of Companies
Fan Sao Guang Food Co., Ltd.
Guizhou Lao Gan Ma Food Co., Ltd.
Guo Niang Food Co., Ltd.
Haitian Group
Lee Kum Kee International Holdings Ltd.
Meile Food Co., Ltd.
Ycdouchi
15. Methodology and Data Sources
15.1 Customization Offerings
15.2 Subscription Services
15.3 Related Reports
15.4 Publisher Expertise
LIST OF TABLES
Table 1 Market Segmentation Analysis
Table 2 Global Fermented Soybeans Market Share of Leading Companies, 2023
Table 3 Product Offerings of Leading Companies
Table 4 Low Growth Scenario Forecasts
Table 5 Reference Case Growth Scenario
Table 6 High Growth Case Scenario
Table 7 Global Fermented Soybeans Revenue (USD Million) And CAGR (%) By Type (2021-2032)
Table 8 Global Fermented Soybeans Revenue (USD Million) And CAGR (%) By Application (2021-2032)
Table 9 Global Fermented Soybeans Revenue (USD Million) And CAGR (%) By Product (2021-2032)
Table 10 Global Fermented Soybeans Market Revenue (USD Million) By Regions (2021-2032)
Table 11 Global Fermented Soybeans Market Share (%) By Regions (2021-2032)
Table 12 North America Fermented Soybeans Revenue (USD Million) By Country (2021-2032)
Table 13 Europe Fermented Soybeans Revenue (USD Million) By Country (2021-2032)
Table 14 Asia Pacific Fermented Soybeans Revenue (USD Million) By Country (2021-2032)
Table 15 South America Fermented Soybeans Revenue (USD Million) By Country (2021-2032)
Table 16 Middle East and Africa Fermented Soybeans Revenue (USD Million) By Region (2021-2032)
Table 17 North America Fermented Soybeans Revenue (USD Million) By Type (2021-2032)
Table 18 North America Fermented Soybeans Revenue (USD Million) By Application (2021-2032)
Table 19 North America Fermented Soybeans Revenue (USD Million) By Product (2021-2032)
Table 20 Europe Fermented Soybeans Revenue (USD Million) By Type (2021-2032)
Table 21 Europe Fermented Soybeans Revenue (USD Million) By Application (2021-2032)
Table 22 Europe Fermented Soybeans Revenue (USD Million) By Product (2021-2032)
Table 23 Asia Pacific Fermented Soybeans Revenue (USD Million) By Type (2021-2032)
Table 24 Asia Pacific Fermented Soybeans Revenue (USD Million) By Application (2021-2032)
Table 25 Asia Pacific Fermented Soybeans Revenue (USD Million) By Product (2021-2032)
Table 26 South America Fermented Soybeans Revenue (USD Million) By Type (2021-2032)
Table 27 South America Fermented Soybeans Revenue (USD Million) By Application (2021-2032)
Table 28 South America Fermented Soybeans Revenue (USD Million) By Product (2021-2032)
Table 29 Middle East and Africa Fermented Soybeans Revenue (USD Million) By Type (2021-2032)
Table 30 Middle East and Africa Fermented Soybeans Revenue (USD Million) By Application (2021-2032)
Table 31 Middle East and Africa Fermented Soybeans Revenue (USD Million) By Product (2021-2032)
LIST OF FIGURES
Figure 1. Market Scope
Figure 2. Pricing Forecasts Per Unit, 2023- 2032
Figure 3. Porter’s Five Forces
Figure 4. Global Fermented Soybeans Market Revenue (USD Million) By Regions (2021-2032)
Figure 5. Global Fermented Soybeans Market Share (%) By Regions (2023)
Figure 6. North America Fermented Soybeans Revenue (USD Million) By Country (2021-2032)
Figure 7. United States Fermented Soybeans Revenue (USD Million) By Country (2021-2032)
Figure 8. Canada Fermented Soybeans Revenue (USD Million) By Country (2021-2032)
Figure 9. Mexico Fermented Soybeans Revenue (USD Million) By Country (2021-2032)
Figure 10. Europe Fermented Soybeans Revenue (USD Million) By Country (2021-2032)
Figure 11. Germany Fermented Soybeans Revenue (USD Million) By Country (2021-2032)
Figure 12. France Fermented Soybeans Revenue (USD Million) By Country (2021-2032)
Figure 13. United Kingdom Fermented Soybeans Revenue (USD Million) By Country (2021-2032)
Figure 14. Spain Fermented Soybeans Revenue (USD Million) By Country (2021-2032)
Figure 15. Italy Fermented Soybeans Revenue (USD Million) By Country (2021-2032)
Figure 16. Russia Fermented Soybeans Revenue (USD Million) By Country (2021-2032)
Figure 17. Rest of Europe Fermented Soybeans Revenue (USD Million) By Country (2021-2032)
Figure 11. Asia Pacific Fermented Soybeans Revenue (USD Million) By Country (2021-2032)
Figure 12. China Fermented Soybeans Revenue (USD Million) By Country (2021-2032)
Figure 13. Japan Fermented Soybeans Revenue (USD Million) By Country (2021-2032)
Figure 14. India Fermented Soybeans Revenue (USD Million) By Country (2021-2032)
Figure 15. South Korea Fermented Soybeans Revenue (USD Million) By Country (2021-2032)
Figure 16. Australia Fermented Soybeans Revenue (USD Million) By Country (2021-2032)
Figure 17. South East Asia Fermented Soybeans Revenue (USD Million) By Country (2021-2032)
Figure 18. South America Fermented Soybeans Revenue (USD Million) By Country (2021-2032)
Figure 19. Brazil Fermented Soybeans Revenue (USD Million) By Country (2021-2032)
Figure 20. Argentina Fermented Soybeans Revenue (USD Million) By Country (2021-2032)
Figure 21. Rest of Asia Pacific Fermented Soybeans Revenue (USD Million) By Country (2021-2032)
Figure 22. Middle East and Africa Fermented Soybeans Revenue (USD Million) By Region (2021-2032)
Figure 23. Saudi Arabia Fermented Soybeans Revenue (USD Million) By Region (2021-2032)
Figure 24. The UAE Fermented Soybeans Revenue (USD Million) By Region (2021-2032)
Figure 25. Rest of Middle East Fermented Soybeans Revenue (USD Million) By Region (2021-2032)
Figure 26. South Africa Fermented Soybeans Revenue (USD Million) By Region (2021-2032)
Figure 27. Africa Fermented Soybeans Revenue (USD Million) By Region (2021-2032)
Figure 28. North America Fermented Soybeans Revenue (USD Million) By Type (2021-2032)
Figure 29. North America Fermented Soybeans Revenue (USD Million) By Application (2021-2032)
Figure 30. North America Fermented Soybeans Revenue (USD Million) By Product (2021-2032)
Figure 31. Europe Fermented Soybeans Revenue (USD Million) By Type (2021-2032)
Figure 32. Europe Fermented Soybeans Revenue (USD Million) By Application (2021-2032)
Figure 33. Europe Fermented Soybeans Revenue (USD Million) By Product (2021-2032)
Figure 34. Asia Pacific Fermented Soybeans Revenue (USD Million) By Type (2021-2032)
Figure 35. Asia Pacific Fermented Soybeans Revenue (USD Million) By Application (2021-2032)
Figure 36. Asia Pacific Fermented Soybeans Revenue (USD Million) By Product (2021-2032)
Figure 37. South America Fermented Soybeans Revenue (USD Million) By Type (2021-2032)
Figure 38. South America Fermented Soybeans Revenue (USD Million) By Application (2021-2032)
Figure 39. South America Fermented Soybeans Revenue (USD Million) By Product (2021-2032)
Figure 40. Middle East and Africa Fermented Soybeans Revenue (USD Million) By Type (2021-2032)
Figure 41. Middle East and Africa Fermented Soybeans Revenue (USD Million) By Application (2021-2032)
Figure 42. Middle East and Africa Fermented Soybeans Revenue (USD Million) By Product (2021-2032)
By Source
GM
Non-GM
By Application
Particles
Sauce
Countries Analyzed
North America (US, Canada, Mexico)
Europe (Germany, UK, France, Spain, Italy, Russia, Rest of Europe)
Asia Pacific (China, India, Japan, South Korea, Australia, South East Asia, Rest of Asia)
South America (Brazil, Argentina, Rest of South America)
Middle East and Africa (Saudi Arabia, UAE, Rest of Middle East, South Africa, Egypt, Rest of Africa)
