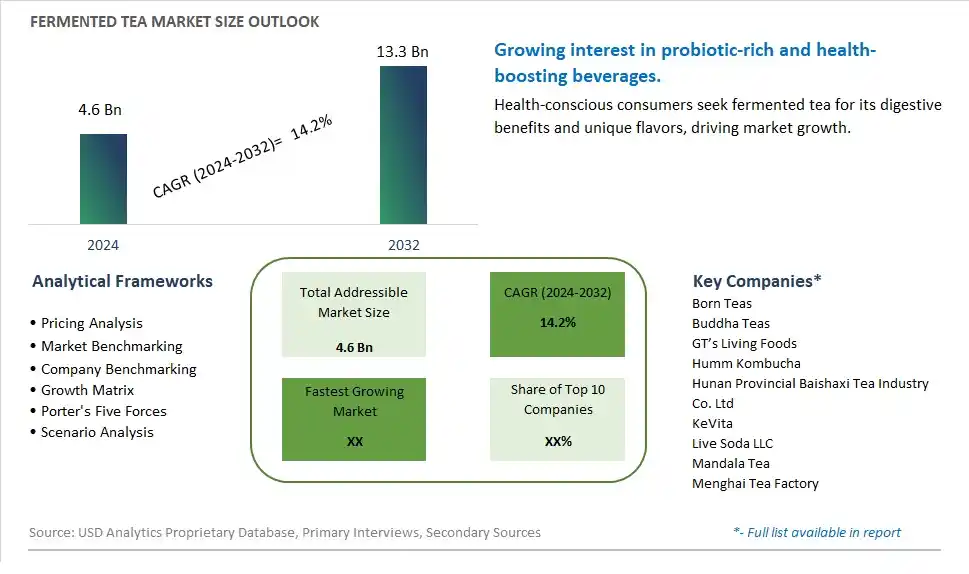
Global Fermented Tea Market Size is valued at $4.6 Billion in 2024 and is forecast to register a growth rate (CAGR) of 14.2% to reach $13.3 Billion by 2032.
The global Fermented Tea Market Comprehensive Study analyzes and forecasts the market size across 6 regions and 24 countries for diverse segments -By Product (Kombucha, Pu-Erh, Others), By Distribution Channel (Online, Offline)
An Introduction to Fermented Tea Market
In 2024, the fermented tea market, particularly kombucha, is booming as consumers seek out probiotic-rich beverages for their health benefits. Fermented tea is valued for its potential to improve digestion, boost the immune system, and provide antioxidants. The market is characterized by a wide variety of flavors and formulations, appealing to a broad consumer base. The growing trend of functional beverages is driving innovation, with new products incorporating adaptogens, superfoods, and low-sugar options. Sustainability and organic certifications are also becoming important, as consumers increasingly prioritize products that align with their health and environmental values.
Fermented Tea Competitive Landscape
The market report analyses the leading companies in the industry including Born Teas, Buddha Teas, GT’s Living Foods, Humm Kombucha, Hunan Provincial Baishaxi Tea Industry Co. Ltd, KeVita, Live Soda LLC, Mandala Tea, Menghai Tea Factory, and Others.
Fermented Tea Market Dynamics
Fermented Tea Market Trend: Increasing Interest in Gut Health and Functional Beverages
The most prominent market trend in the fermented tea industry is the increasing interest in gut health and functional beverages. Consumers are becoming more aware of the importance of maintaining a healthy gut microbiome for overall well-being, leading to a growing demand for probiotic-rich foods and beverages like fermented tea. Fermented tea, such as kombucha, offers probiotic benefits derived from the fermentation process, which promotes the growth of beneficial bacteria in the gut. As consumers seek out functional beverages that support digestive health and immune function, fermented tea has emerged as a popular choice due to its perceived health benefits and unique flavor profiles.
Market Driver: Shift Towards Health-Conscious Lifestyles and Natural Ingredients
The primary market driver for fermented tea is the shift towards health-conscious lifestyles and natural ingredients. With increasing concerns about the impact of processed foods and sugary beverages on health, consumers are gravitating towards natural and minimally processed alternatives. Fermented tea aligns with this trend as it is typically made from simple ingredients like tea, sugar, water, and SCOBY (symbiotic culture of bacteria and yeast). Its natural fermentation process creates a tangy, effervescent beverage that appeals to health-conscious consumers seeking alternatives to sugary sodas and artificial drinks. The demand for fermented tea is driven by its perceived health benefits, including probiotic support, detoxification properties, and potential immune-boosting effects, making it a preferred choice for individuals looking to prioritize their well-being.
Market Opportunity: Expansion into Functional Beverage Market and Product Innovation
An opportunity for the fermented tea market lies in the expansion into the broader functional beverage market and product innovation. Manufacturers can capitalize on the growing popularity of fermented tea by developing new product formulations and flavors that cater to evolving consumer preferences. There is an opportunity to introduce functional variations of fermented tea that target specific health concerns, such as stress relief, energy enhancement, or mental clarity. Additionally, incorporating exotic tea blends, fruit infusions, and botanical extracts can appeal to adventurous consumers looking for unique taste experiences. By expanding the product range and exploring innovative formulations, companies can capture a larger share of the functional beverage market and meet the diverse needs of health-conscious consumers seeking natural and functional alternatives.
Fermented Tea Market Share Analysis: Kombucha held the dominant market share in 2024
Within the Fermented Tea Market, the kombucha segment is the largest, commanding a significant share of the industry. This dominance can be attributed to several factors, including growing consumer awareness of the health benefits associated with kombucha consumption, as well as its unique flavor profile and versatility. Kombucha, a fermented tea beverage, is prized for its probiotic properties, which support gut health and digestion. Additionally, kombucha is rich in antioxidants and organic acids, offering potential immune-boosting and detoxifying effects. Further, the wide range of flavors and variations available in the kombucha market, including fruit-infused, herbal, and botanical blends, appeals to diverse consumer preferences. The increasing demand for natural and functional beverages, coupled with the rising trend of wellness-focused lifestyles, has propelled the growth of the kombucha segment in the Fermented Tea Market. As consumers continue to prioritize health-conscious choices and seek out flavorful alternatives to traditional beverages, kombucha is expected to maintain its stronghold, driving market growth and innovation in the industry.
Fermented Tea Market Share Analysis: Online Distribution Channel market is poised to register the fastest growth rae over the forecast period to 2032
Among the distribution channels in the Fermented Tea Market, the online segment stands out as the fastest-growing, experiencing significant expansion in recent years. The robust growth outlook is driven by the increasing popularity of e-commerce platforms, driven by convenience, accessibility, and changing consumer shopping habits. Online channels offer consumers a convenient way to explore and purchase a wide variety of fermented tea products from the comfort of their homes. Further, the COVID-19 pandemic has accelerated the shift towards online shopping, as consumers prioritize safety and minimize physical contact. Additionally, online retailers often provide a broader selection of fermented tea products, including unique flavors and artisanal blends, compared to traditional brick-and-mortar stores. Furthermore, the availability of subscription services, discounts, and promotions further enhances the appeal of purchasing fermented tea online. As the online distribution channel continues to evolve and innovate, offering a seamless shopping experience and a diverse range of fermented tea options, it is expected to sustain its rapid growth trajectory, reshaping the way consumers access and purchase fermented tea products.
Fermented Tea Market Segmentation
By Product
Kombucha
Pu-Erh
Others
By Distribution Channel
Online
Offline
Countries Analyzed
North America (US, Canada, Mexico)
Europe (Germany, UK, France, Spain, Italy, Russia, Rest of Europe)
Asia Pacific (China, India, Japan, South Korea, Australia, South East Asia, Rest of Asia)
South America (Brazil, Argentina, Rest of South America)
Middle East and Africa (Saudi Arabia, UAE, Rest of Middle East, South Africa, Egypt, Rest of Africa)
Fermented Tea Companies Profiled in the Study
Born Teas
Buddha Teas
GT’s Living Foods
Humm Kombucha
Hunan Provincial Baishaxi Tea Industry Co. Ltd
KeVita
Live Soda LLC
Mandala Tea
Menghai Tea Factory
*- List Not Exhaustive
Chapter 1. TABLE OF CONTENTS
Chapter 2. Introduction to Fermented Tea Market
2.1. Market Overview
2.2. Key Statistics and Report Highlights
2.3. Scope of the Comprehensive Study
2.3.1. Market Definition
2.3.2 Countries and Regions Covered
2.3.3 Research Objective
2.3.4 Units, Currency, and Conversions
2.3.5 Industry Value Chain
2.4. Key Market Segments
2.5. Key Companies
2.6. Study Period
Chapter 3. Strategic Analysis Review
3.1. Fermented Tea Pricing Analysis and Forecast
3.2. Porter’s Five Forces
3.3. Market Ecosystem
3.4. SWOT Analysis
3.5. Regulatory Scenario
3.3. Effects of Inflation, Russia-Ukraine War, moderating economic growth, and other macroeconomic factors
Chapter 4. Competitive Landscape
4.1. Market Share Analysis
4.1.1. Global Fermented Tea Market Share by Company, 2023
4.1.2. Product Offerings of Leading Fermented Tea Companies
4.2. Market Entropy
4.2.1. New Product Launches in the Industry
4.2.2. Mergers, Acquisitions, Joint ventures, and Partnerships
4.3. Key Strategies and Best Practices
Chapter 5. Global Market Projections: Best, Reference, and Low Case Scenarios
5.1. Growth Analysis- Case Scenario Definitions
5.2. Low Growth Case Scenario Forecasts
5.3. Reference Growth Case Scenario Forecasts
5.4. High Growth Case Scenario Forecasts
Chapter 6. Market Dynamics
6.1. Fermented Tea Market Drivers
6.2. Fermented Tea Market Challenges
6.6. Fermented Tea Market Opportunities
6.4. Fermented Tea Market Trends
Chapter 7. Global Fermented Tea Market Outlook Trends
7.1. Global Fermented Tea Revenue (USD Million) and CAGR (%) by Type (2021-2032)
7.2. Global Fermented Tea Revenue (USD Million) and CAGR (%) by Application (2021-2032)
7.3. Global Fermented Tea Revenue (USD Million) and CAGR (%) by Product (2021-2032)
By Product
Kombucha
Pu-Erh
Others
By Distribution Channel
Online
Offline
Chapter 8. Global Fermented Tea Regional Analysis and Outlook
8.1. Global Fermented Tea Revenue (USD Million) By Regions (2021- 2032)
8.2. North America Fermented Tea Revenue (USD Million) by Country (2021-2032)
8.2.1. United States Fermented Tea Regional Analysis and Outlook
8.2.2. Canada Fermented Tea Regional Analysis and Outlook
8.2.3. Mexico Fermented Tea Regional Analysis and Outlook
8.3. Europe Fermented Tea Revenue (USD Million), by Country (2021-2032)
8.3.1. Germany Fermented Tea Regional Analysis and Outlook
8.3.2. France Fermented Tea Regional Analysis and Outlook
8.3.3. United Kingdom Fermented Tea Regional Analysis and Outlook
8.3.4. Spain Fermented Tea Regional Analysis and Outlook
8.3.5. Italy Fermented Tea Regional Analysis and Outlook
8.3.6. Russia Fermented Tea Regional Analysis and Outlook
8.3.7. Rest of Europe Fermented Tea Regional Analysis and Outlook
8.4. Asia Pacific Fermented Tea Revenue (USD Million) by Country (2021-2032)
8.4.1. China Fermented Tea Regional Analysis and Outlook
8.4.2. Japan Fermented Tea Regional Analysis and Outlook
8.4.3. India Fermented Tea Regional Analysis and Outlook
8.4.4. South Korea Fermented Tea Regional Analysis and Outlook
8.4.5. Australia Fermented Tea Regional Analysis and Outlook
8.4.6. South East Asia Fermented Tea Regional Analysis and Outlook
8.4.7. Rest of Asia Pacific Fermented Tea Regional Analysis and Outlook
8.5. South America Fermented Tea Revenue (USD Million), by Country (2021-2032)
8.5.1. Brazil Fermented Tea Regional Analysis and Outlook
8.5.2. Argentina Fermented Tea Regional Analysis and Outlook
8.5.3. Rest of South America Fermented Tea Regional Analysis and Outlook
8.6. Middle East and Africa Fermented Tea Revenue (USD Million) by Country (2021-2032)
8.6.1. Middle East Fermented Tea Regional Analysis and Outlook
8.6.2. Africa Fermented Tea Regional Analysis and Outlook
Chapter 9. North America Fermented Tea Analysis and Outlook
9.1. North America Fermented Tea Revenue (USD Million) by Segments (2021-2032)
9.1.1. North America Fermented Tea Revenue (USD Million) by Type (2021-2032)
9.1.2. North America Fermented Tea Revenue (USD Million) by Application (2021-2032)
9.1.3. North America Fermented Tea Revenue (USD Million) by Product (2021-2032)
By Product
Kombucha
Pu-Erh
Others
By Distribution Channel
Online
Offline
Chapter 10. Europe Fermented Tea Analysis and Outlook
10.1. Europe Fermented Tea Revenue (USD Million), by Segments (USD Million) (2021-2032)
10.1.1. Europe Fermented Tea Revenue (USD Million) by Type (2021-2032)
10.1.2. Europe Fermented Tea Revenue (USD Million) by Application (2021-2032)
10.1.3. Europe Fermented Tea Revenue (USD Million) by Product (2021-2032)
By Product
Kombucha
Pu-Erh
Others
By Distribution Channel
Online
Offline
Chapter 11. Asia Pacific Fermented Tea Analysis and Outlook
11.1. Asia Pacific Fermented Tea Revenue (USD Million), and Revenue (USD Million) by Segments (2021-2032)
11.1.1. Asia Pacific Fermented Tea Revenue (USD Million) by Type (2021-2032)
11.1.2. Asia Pacific Fermented Tea Revenue (USD Million) by Application (2021-2032)
11.1.3. Asia Pacific Fermented Tea Revenue (USD Million) by Product (2021-2032)
By Product
Kombucha
Pu-Erh
Others
By Distribution Channel
Online
Offline
Chapter 12. South America Fermented Tea Analysis and Outlook
12.1. South America Fermented Tea Revenue (USD Million), by Segments (2021-2032)
12.1.1. South America Fermented Tea Revenue (USD Million) by Type (2021-2032)
12.1.2. South America Fermented Tea Revenue (USD Million) by Application (2021-2032)
12.1.3. South America Fermented Tea Revenue (USD Million) by Product (2021-2032)
By Product
Kombucha
Pu-Erh
Others
By Distribution Channel
Online
Offline
Chapter 13. Middle East and Africa Fermented Tea Analysis and Outlook
13.1. Middle East and Africa Fermented Tea Revenue (USD Million), by Segments (2021-2032)
13.1.1. Middle East and Africa Fermented Tea Revenue (USD Million) by Type (2021-2032)
13.1.2. Middle East and Africa Fermented Tea Revenue (USD Million) by Application (2021-2032)
13.1.3. Middle East and Africa Fermented Tea Revenue (USD Million) by Product (2021-2032)
By Product
Kombucha
Pu-Erh
Others
By Distribution Channel
Online
Offline
Chapter 14. Fermented Tea Company Profiles
14.1 Business Overview
14.2 Product Profiles
14.3 SWOT Profiles
14.5 Recent Developments
14.6 Financial Profile
List of Companies
Born Teas
Buddha Teas
GT’s Living Foods
Humm Kombucha
Hunan Provincial Baishaxi Tea Industry Co. Ltd
KeVita
Live Soda LLC
Mandala Tea
Menghai Tea Factory
15. Methodology and Data Sources
15.1 Customization Offerings
15.2 Subscription Services
15.3 Related Reports
15.4 Publisher Expertise
LIST OF TABLES
Table 1 Market Segmentation Analysis
Table 2 Global Fermented Tea Market Share of Leading Companies, 2023
Table 3 Product Offerings of Leading Companies
Table 4 Low Growth Scenario Forecasts
Table 5 Reference Case Growth Scenario
Table 6 High Growth Case Scenario
Table 7 Global Fermented Tea Revenue (USD Million) And CAGR (%) By Type (2021-2032)
Table 8 Global Fermented Tea Revenue (USD Million) And CAGR (%) By Application (2021-2032)
Table 9 Global Fermented Tea Revenue (USD Million) And CAGR (%) By Product (2021-2032)
Table 10 Global Fermented Tea Market Revenue (USD Million) By Regions (2021-2032)
Table 11 Global Fermented Tea Market Share (%) By Regions (2021-2032)
Table 12 North America Fermented Tea Revenue (USD Million) By Country (2021-2032)
Table 13 Europe Fermented Tea Revenue (USD Million) By Country (2021-2032)
Table 14 Asia Pacific Fermented Tea Revenue (USD Million) By Country (2021-2032)
Table 15 South America Fermented Tea Revenue (USD Million) By Country (2021-2032)
Table 16 Middle East and Africa Fermented Tea Revenue (USD Million) By Region (2021-2032)
Table 17 North America Fermented Tea Revenue (USD Million) By Type (2021-2032)
Table 18 North America Fermented Tea Revenue (USD Million) By Application (2021-2032)
Table 19 North America Fermented Tea Revenue (USD Million) By Product (2021-2032)
Table 20 Europe Fermented Tea Revenue (USD Million) By Type (2021-2032)
Table 21 Europe Fermented Tea Revenue (USD Million) By Application (2021-2032)
Table 22 Europe Fermented Tea Revenue (USD Million) By Product (2021-2032)
Table 23 Asia Pacific Fermented Tea Revenue (USD Million) By Type (2021-2032)
Table 24 Asia Pacific Fermented Tea Revenue (USD Million) By Application (2021-2032)
Table 25 Asia Pacific Fermented Tea Revenue (USD Million) By Product (2021-2032)
Table 26 South America Fermented Tea Revenue (USD Million) By Type (2021-2032)
Table 27 South America Fermented Tea Revenue (USD Million) By Application (2021-2032)
Table 28 South America Fermented Tea Revenue (USD Million) By Product (2021-2032)
Table 29 Middle East and Africa Fermented Tea Revenue (USD Million) By Type (2021-2032)
Table 30 Middle East and Africa Fermented Tea Revenue (USD Million) By Application (2021-2032)
Table 31 Middle East and Africa Fermented Tea Revenue (USD Million) By Product (2021-2032)
LIST OF FIGURES
Figure 1. Market Scope
Figure 2. Pricing Forecasts Per Unit, 2023- 2032
Figure 3. Porter’s Five Forces
Figure 4. Global Fermented Tea Market Revenue (USD Million) By Regions (2021-2032)
Figure 5. Global Fermented Tea Market Share (%) By Regions (2023)
Figure 6. North America Fermented Tea Revenue (USD Million) By Country (2021-2032)
Figure 7. United States Fermented Tea Revenue (USD Million) By Country (2021-2032)
Figure 8. Canada Fermented Tea Revenue (USD Million) By Country (2021-2032)
Figure 9. Mexico Fermented Tea Revenue (USD Million) By Country (2021-2032)
Figure 10. Europe Fermented Tea Revenue (USD Million) By Country (2021-2032)
Figure 11. Germany Fermented Tea Revenue (USD Million) By Country (2021-2032)
Figure 12. France Fermented Tea Revenue (USD Million) By Country (2021-2032)
Figure 13. United Kingdom Fermented Tea Revenue (USD Million) By Country (2021-2032)
Figure 14. Spain Fermented Tea Revenue (USD Million) By Country (2021-2032)
Figure 15. Italy Fermented Tea Revenue (USD Million) By Country (2021-2032)
Figure 16. Russia Fermented Tea Revenue (USD Million) By Country (2021-2032)
Figure 17. Rest of Europe Fermented Tea Revenue (USD Million) By Country (2021-2032)
Figure 11. Asia Pacific Fermented Tea Revenue (USD Million) By Country (2021-2032)
Figure 12. China Fermented Tea Revenue (USD Million) By Country (2021-2032)
Figure 13. Japan Fermented Tea Revenue (USD Million) By Country (2021-2032)
Figure 14. India Fermented Tea Revenue (USD Million) By Country (2021-2032)
Figure 15. South Korea Fermented Tea Revenue (USD Million) By Country (2021-2032)
Figure 16. Australia Fermented Tea Revenue (USD Million) By Country (2021-2032)
Figure 17. South East Asia Fermented Tea Revenue (USD Million) By Country (2021-2032)
Figure 18. South America Fermented Tea Revenue (USD Million) By Country (2021-2032)
Figure 19. Brazil Fermented Tea Revenue (USD Million) By Country (2021-2032)
Figure 20. Argentina Fermented Tea Revenue (USD Million) By Country (2021-2032)
Figure 21. Rest of Asia Pacific Fermented Tea Revenue (USD Million) By Country (2021-2032)
Figure 22. Middle East and Africa Fermented Tea Revenue (USD Million) By Region (2021-2032)
Figure 23. Saudi Arabia Fermented Tea Revenue (USD Million) By Region (2021-2032)
Figure 24. The UAE Fermented Tea Revenue (USD Million) By Region (2021-2032)
Figure 25. Rest of Middle East Fermented Tea Revenue (USD Million) By Region (2021-2032)
Figure 26. South Africa Fermented Tea Revenue (USD Million) By Region (2021-2032)
Figure 27. Africa Fermented Tea Revenue (USD Million) By Region (2021-2032)
Figure 28. North America Fermented Tea Revenue (USD Million) By Type (2021-2032)
Figure 29. North America Fermented Tea Revenue (USD Million) By Application (2021-2032)
Figure 30. North America Fermented Tea Revenue (USD Million) By Product (2021-2032)
Figure 31. Europe Fermented Tea Revenue (USD Million) By Type (2021-2032)
Figure 32. Europe Fermented Tea Revenue (USD Million) By Application (2021-2032)
Figure 33. Europe Fermented Tea Revenue (USD Million) By Product (2021-2032)
Figure 34. Asia Pacific Fermented Tea Revenue (USD Million) By Type (2021-2032)
Figure 35. Asia Pacific Fermented Tea Revenue (USD Million) By Application (2021-2032)
Figure 36. Asia Pacific Fermented Tea Revenue (USD Million) By Product (2021-2032)
Figure 37. South America Fermented Tea Revenue (USD Million) By Type (2021-2032)
Figure 38. South America Fermented Tea Revenue (USD Million) By Application (2021-2032)
Figure 39. South America Fermented Tea Revenue (USD Million) By Product (2021-2032)
Figure 40. Middle East and Africa Fermented Tea Revenue (USD Million) By Type (2021-2032)
Figure 41. Middle East and Africa Fermented Tea Revenue (USD Million) By Application (2021-2032)
Figure 42. Middle East and Africa Fermented Tea Revenue (USD Million) By Product (2021-2032)
By Product
Kombucha
Pu-Erh
Others
By Distribution Channel
Online
Offline
Countries Analyzed
North America (US, Canada, Mexico)
Europe (Germany, UK, France, Spain, Italy, Russia, Rest of Europe)
Asia Pacific (China, India, Japan, South Korea, Australia, South East Asia, Rest of Asia)
South America (Brazil, Argentina, Rest of South America)
Middle East and Africa (Saudi Arabia, UAE, Rest of Middle East, South Africa, Egypt, Rest of Africa)
