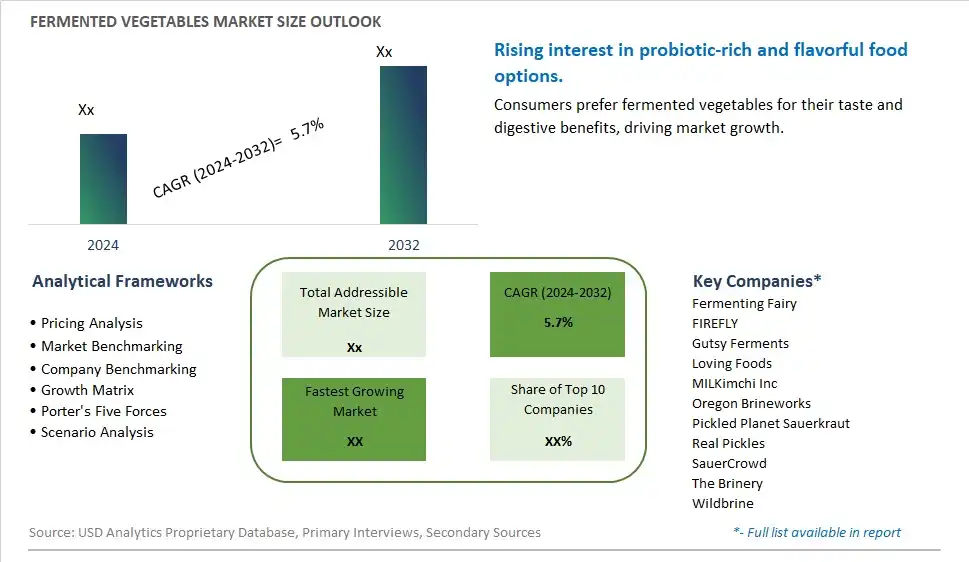
Global Fermented Vegetables Market Size is valued at $XX Million in 2024 and is forecast to register a growth rate (CAGR) of 5.7% to reach $XX Million by 2032.
The global Fermented Vegetables Market Comprehensive Study analyzes and forecasts the market size across 6 regions and 24 countries for diverse segments -By Type (Conventional, Organic), By Application (Food Service, Supermarkets/Hypermarkets, Departmental Stores, Specialty Stores, Online Retail, Others)
An Introduction to Fermented Vegetables Market
In 2024, the Fermented Vegetables market is experiencing significant growth, driven by the increasing demand for probiotic-rich and naturally preserved foods. Fermented vegetables, such as kimchi, sauerkraut, and pickles, are popular for their unique flavors and health benefits, including improved digestion and immune support. The market benefits from advancements in fermentation technologies, the growing trend of health-conscious eating, and the expansion of the functional food sector. Additionally, the rising awareness of the benefits of fermented foods for gut health and overall wellness is contributing to market growth.
Fermented Vegetables Competitive Landscape
The market report analyses the leading companies in the industry including Fermenting Fairy, FIREFLY, Gutsy Ferments, Loving Foods, MILKimchi Inc, Oregon Brineworks, Pickled Planet Sauerkraut, Real Pickles, SauerCrowd, The Brinery, Wildbrine, and Others.
Fermented Vegetables Market Dynamics
Fermented Vegetables Market Trend: Growing Popularity of Fermented Foods
The fermented vegetables market is experiencing a surge in popularity as consumers increasingly embrace fermented foods for their health benefits and unique flavors. This trend is driven by a rising awareness of the positive impact of probiotics on digestive health and overall well-being. Fermented vegetables, such as kimchi, sauerkraut, and pickles, are becoming staples in many households and restaurants. The cultural acceptance of these foods, combined with a growing interest in traditional and artisanal food preparation methods, is boosting their appeal. Additionally, the influence of social media and food bloggers in promoting the culinary versatility and health benefits of fermented vegetables is further propelling market growth.
Fermented Vegetables Market Driver: Health and Wellness Movement
The health and wellness movement is a significant driver for the fermented vegetables market. Consumers are increasingly focused on maintaining a healthy lifestyle through diet, leading to a greater demand for nutrient-dense, functional foods. Fermented vegetables are rich in vitamins, minerals, and probiotics, making them an attractive option for health-conscious individuals. The rise in lifestyle-related diseases, such as obesity, diabetes, and digestive disorders, is encouraging people to seek out foods that support gut health and overall well-being. This health-driven consumer behavior is fueling the demand for fermented vegetables, which are seen as a natural and beneficial addition to a balanced diet.
Fermented Vegetables Market Opportunity: Expansion into New Markets and Product Variations
There is a significant opportunity for growth in the fermented vegetables market through expansion into new geographic markets and the introduction of innovative product variations. Emerging markets, particularly in Asia-Pacific, Latin America, and Africa, offer substantial potential due to increasing urbanization, rising disposable incomes, and a growing middle class. Companies can tap into these markets by tailoring their products to local tastes and preferences. Additionally, there is scope for developing new fermented vegetable products that cater to specific dietary needs and health trends, such as organic, gluten-free, and low-sodium options. By diversifying their product portfolios and entering new markets, businesses can capture a larger share of the growing demand for fermented foods.
Fermented Vegetables Market Share Analysis: Organic segment generated the highest revenue share in the industry
Organic is the largest segment in the Fermented Vegetables Market. This segment's prominence is due to the growing consumer preference for products that are perceived as healthier, safer, and more environmentally friendly. Organic fermented vegetables are produced without synthetic pesticides and fertilizers, which appeals to health-conscious consumers who are concerned about the potential health impacts of chemicals in their food. Additionally, the organic label often carries with it an implication of higher quality and nutritional value, factors that are highly valued in the context of fermented products known for their probiotic benefits. This market segment is supported by an increasing number of organic farmers and producers who are responding to consumer demand with a wider variety of organic fermented vegetable products. As more people adopt healthier eating habits and seek out sustainable food options, the organic segment continues to dominate the market.
Fermented Vegetables Market Share Analysis: Online Retail is the fastest growing segment over the forecast period to 2032
The Online Retail segment is projected to be the fastest-growing application in the Fermented Vegetables Market by 2032. This growth is driven by the increasing convenience of online shopping and the expansion of e-commerce platforms that cater to niche dietary needs and preferences. Online retail allows consumers to easily access a wide array of fermented vegetable products, including unique and hard-to-find items, from the comfort of their homes. The segment benefits from the growing consumer familiarity with online purchasing, driven by broader e-commerce trends and enhanced by targeted marketing and consumer education about the benefits of fermented foods. Furthermore, online platforms often provide detailed product information, customer reviews, and competitive pricing, which are attractive to informed and health-conscious shoppers. As digital connectivity and smartphone usage continue to increase globally, online retail is set to expand rapidly, making it the fastest-growing application segment in the fermented vegetables market.
Fermented Vegetables Market Segmentation
By Type
Conventional
Organic
By Application
Food Service
Supermarkets/Hypermarkets
Departmental Stores
Specialty Stores
Online Retail
Others
Countries Analyzed
North America (US, Canada, Mexico)
Europe (Germany, UK, France, Spain, Italy, Russia, Rest of Europe)
Asia Pacific (China, India, Japan, South Korea, Australia, South East Asia, Rest of Asia)
South America (Brazil, Argentina, Rest of South America)
Middle East and Africa (Saudi Arabia, UAE, Rest of Middle East, South Africa, Egypt, Rest of Africa)
Fermented Vegetables Companies Profiled in the Study
Fermenting Fairy
FIREFLY
Gutsy Ferments
Loving Foods
MILKimchi Inc
Oregon Brineworks
Pickled Planet Sauerkraut
Real Pickles
SauerCrowd
The Brinery
Wildbrine
*- List Not Exhaustive
Chapter 1. TABLE OF CONTENTS
Chapter 2. Introduction to Fermented Vegetables Market
2.1. Market Overview
2.2. Key Statistics and Report Highlights
2.3. Scope of the Comprehensive Study
2.3.1. Market Definition
2.3.2 Countries and Regions Covered
2.3.3 Research Objective
2.3.4 Units, Currency, and Conversions
2.3.5 Industry Value Chain
2.4. Key Market Segments
2.5. Key Companies
2.6. Study Period
Chapter 3. Strategic Analysis Review
3.1. Fermented Vegetables Pricing Analysis and Forecast
3.2. Porter’s Five Forces
3.3. Market Ecosystem
3.4. SWOT Analysis
3.5. Regulatory Scenario
3.3. Effects of Inflation, Russia-Ukraine War, moderating economic growth, and other macroeconomic factors
Chapter 4. Competitive Landscape
4.1. Market Share Analysis
4.1.1. Global Fermented Vegetables Market Share by Company, 2023
4.1.2. Product Offerings of Leading Fermented Vegetables Companies
4.2. Market Entropy
4.2.1. New Product Launches in the Industry
4.2.2. Mergers, Acquisitions, Joint ventures, and Partnerships
4.3. Key Strategies and Best Practices
Chapter 5. Global Market Projections: Best, Reference, and Low Case Scenarios
5.1. Growth Analysis- Case Scenario Definitions
5.2. Low Growth Case Scenario Forecasts
5.3. Reference Growth Case Scenario Forecasts
5.4. High Growth Case Scenario Forecasts
Chapter 6. Market Dynamics
6.1. Fermented Vegetables Market Drivers
6.2. Fermented Vegetables Market Challenges
6.6. Fermented Vegetables Market Opportunities
6.4. Fermented Vegetables Market Trends
Chapter 7. Global Fermented Vegetables Market Outlook Trends
7.1. Global Fermented Vegetables Revenue (USD Million) and CAGR (%) by Type (2021-2032)
7.2. Global Fermented Vegetables Revenue (USD Million) and CAGR (%) by Application (2021-2032)
7.3. Global Fermented Vegetables Revenue (USD Million) and CAGR (%) by Product (2021-2032)
By Type
Conventional
Organic
By Application
Food Service
Supermarkets/Hypermarkets
Departmental Stores
Specialty Stores
Online Retail
Others
Chapter 8. Global Fermented Vegetables Regional Analysis and Outlook
8.1. Global Fermented Vegetables Revenue (USD Million) By Regions (2021- 2032)
8.2. North America Fermented Vegetables Revenue (USD Million) by Country (2021-2032)
8.2.1. United States Fermented Vegetables Regional Analysis and Outlook
8.2.2. Canada Fermented Vegetables Regional Analysis and Outlook
8.2.3. Mexico Fermented Vegetables Regional Analysis and Outlook
8.3. Europe Fermented Vegetables Revenue (USD Million), by Country (2021-2032)
8.3.1. Germany Fermented Vegetables Regional Analysis and Outlook
8.3.2. France Fermented Vegetables Regional Analysis and Outlook
8.3.3. United Kingdom Fermented Vegetables Regional Analysis and Outlook
8.3.4. Spain Fermented Vegetables Regional Analysis and Outlook
8.3.5. Italy Fermented Vegetables Regional Analysis and Outlook
8.3.6. Russia Fermented Vegetables Regional Analysis and Outlook
8.3.7. Rest of Europe Fermented Vegetables Regional Analysis and Outlook
8.4. Asia Pacific Fermented Vegetables Revenue (USD Million) by Country (2021-2032)
8.4.1. China Fermented Vegetables Regional Analysis and Outlook
8.4.2. Japan Fermented Vegetables Regional Analysis and Outlook
8.4.3. India Fermented Vegetables Regional Analysis and Outlook
8.4.4. South Korea Fermented Vegetables Regional Analysis and Outlook
8.4.5. Australia Fermented Vegetables Regional Analysis and Outlook
8.4.6. South East Asia Fermented Vegetables Regional Analysis and Outlook
8.4.7. Rest of Asia Pacific Fermented Vegetables Regional Analysis and Outlook
8.5. South America Fermented Vegetables Revenue (USD Million), by Country (2021-2032)
8.5.1. Brazil Fermented Vegetables Regional Analysis and Outlook
8.5.2. Argentina Fermented Vegetables Regional Analysis and Outlook
8.5.3. Rest of South America Fermented Vegetables Regional Analysis and Outlook
8.6. Middle East and Africa Fermented Vegetables Revenue (USD Million) by Country (2021-2032)
8.6.1. Middle East Fermented Vegetables Regional Analysis and Outlook
8.6.2. Africa Fermented Vegetables Regional Analysis and Outlook
Chapter 9. North America Fermented Vegetables Analysis and Outlook
9.1. North America Fermented Vegetables Revenue (USD Million) by Segments (2021-2032)
9.1.1. North America Fermented Vegetables Revenue (USD Million) by Type (2021-2032)
9.1.2. North America Fermented Vegetables Revenue (USD Million) by Application (2021-2032)
9.1.3. North America Fermented Vegetables Revenue (USD Million) by Product (2021-2032)
By Type
Conventional
Organic
By Application
Food Service
Supermarkets/Hypermarkets
Departmental Stores
Specialty Stores
Online Retail
Others
Chapter 10. Europe Fermented Vegetables Analysis and Outlook
10.1. Europe Fermented Vegetables Revenue (USD Million), by Segments (USD Million) (2021-2032)
10.1.1. Europe Fermented Vegetables Revenue (USD Million) by Type (2021-2032)
10.1.2. Europe Fermented Vegetables Revenue (USD Million) by Application (2021-2032)
10.1.3. Europe Fermented Vegetables Revenue (USD Million) by Product (2021-2032)
By Type
Conventional
Organic
By Application
Food Service
Supermarkets/Hypermarkets
Departmental Stores
Specialty Stores
Online Retail
Others
Chapter 11. Asia Pacific Fermented Vegetables Analysis and Outlook
11.1. Asia Pacific Fermented Vegetables Revenue (USD Million), and Revenue (USD Million) by Segments (2021-2032)
11.1.1. Asia Pacific Fermented Vegetables Revenue (USD Million) by Type (2021-2032)
11.1.2. Asia Pacific Fermented Vegetables Revenue (USD Million) by Application (2021-2032)
11.1.3. Asia Pacific Fermented Vegetables Revenue (USD Million) by Product (2021-2032)
By Type
Conventional
Organic
By Application
Food Service
Supermarkets/Hypermarkets
Departmental Stores
Specialty Stores
Online Retail
Others
Chapter 12. South America Fermented Vegetables Analysis and Outlook
12.1. South America Fermented Vegetables Revenue (USD Million), by Segments (2021-2032)
12.1.1. South America Fermented Vegetables Revenue (USD Million) by Type (2021-2032)
12.1.2. South America Fermented Vegetables Revenue (USD Million) by Application (2021-2032)
12.1.3. South America Fermented Vegetables Revenue (USD Million) by Product (2021-2032)
By Type
Conventional
Organic
By Application
Food Service
Supermarkets/Hypermarkets
Departmental Stores
Specialty Stores
Online Retail
Others
Chapter 13. Middle East and Africa Fermented Vegetables Analysis and Outlook
13.1. Middle East and Africa Fermented Vegetables Revenue (USD Million), by Segments (2021-2032)
13.1.1. Middle East and Africa Fermented Vegetables Revenue (USD Million) by Type (2021-2032)
13.1.2. Middle East and Africa Fermented Vegetables Revenue (USD Million) by Application (2021-2032)
13.1.3. Middle East and Africa Fermented Vegetables Revenue (USD Million) by Product (2021-2032)
By Type
Conventional
Organic
By Application
Food Service
Supermarkets/Hypermarkets
Departmental Stores
Specialty Stores
Online Retail
Others
Chapter 14. Fermented Vegetables Company Profiles
14.1 Business Overview
14.2 Product Profiles
14.3 SWOT Profiles
14.5 Recent Developments
14.6 Financial Profile
List of Companies
Fermenting Fairy
FIREFLY
Gutsy Ferments
Loving Foods
MILKimchi Inc
Oregon Brineworks
Pickled Planet Sauerkraut
Real Pickles
SauerCrowd
The Brinery
Wildbrine
15. Methodology and Data Sources
15.1 Customization Offerings
15.2 Subscription Services
15.3 Related Reports
15.4 Publisher Expertise
LIST OF TABLES
Table 1 Market Segmentation Analysis
Table 2 Global Fermented Vegetables Market Share of Leading Companies, 2023
Table 3 Product Offerings of Leading Companies
Table 4 Low Growth Scenario Forecasts
Table 5 Reference Case Growth Scenario
Table 6 High Growth Case Scenario
Table 7 Global Fermented Vegetables Revenue (USD Million) And CAGR (%) By Type (2021-2032)
Table 8 Global Fermented Vegetables Revenue (USD Million) And CAGR (%) By Application (2021-2032)
Table 9 Global Fermented Vegetables Revenue (USD Million) And CAGR (%) By Product (2021-2032)
Table 10 Global Fermented Vegetables Market Revenue (USD Million) By Regions (2021-2032)
Table 11 Global Fermented Vegetables Market Share (%) By Regions (2021-2032)
Table 12 North America Fermented Vegetables Revenue (USD Million) By Country (2021-2032)
Table 13 Europe Fermented Vegetables Revenue (USD Million) By Country (2021-2032)
Table 14 Asia Pacific Fermented Vegetables Revenue (USD Million) By Country (2021-2032)
Table 15 South America Fermented Vegetables Revenue (USD Million) By Country (2021-2032)
Table 16 Middle East and Africa Fermented Vegetables Revenue (USD Million) By Region (2021-2032)
Table 17 North America Fermented Vegetables Revenue (USD Million) By Type (2021-2032)
Table 18 North America Fermented Vegetables Revenue (USD Million) By Application (2021-2032)
Table 19 North America Fermented Vegetables Revenue (USD Million) By Product (2021-2032)
Table 20 Europe Fermented Vegetables Revenue (USD Million) By Type (2021-2032)
Table 21 Europe Fermented Vegetables Revenue (USD Million) By Application (2021-2032)
Table 22 Europe Fermented Vegetables Revenue (USD Million) By Product (2021-2032)
Table 23 Asia Pacific Fermented Vegetables Revenue (USD Million) By Type (2021-2032)
Table 24 Asia Pacific Fermented Vegetables Revenue (USD Million) By Application (2021-2032)
Table 25 Asia Pacific Fermented Vegetables Revenue (USD Million) By Product (2021-2032)
Table 26 South America Fermented Vegetables Revenue (USD Million) By Type (2021-2032)
Table 27 South America Fermented Vegetables Revenue (USD Million) By Application (2021-2032)
Table 28 South America Fermented Vegetables Revenue (USD Million) By Product (2021-2032)
Table 29 Middle East and Africa Fermented Vegetables Revenue (USD Million) By Type (2021-2032)
Table 30 Middle East and Africa Fermented Vegetables Revenue (USD Million) By Application (2021-2032)
Table 31 Middle East and Africa Fermented Vegetables Revenue (USD Million) By Product (2021-2032)
LIST OF FIGURES
Figure 1. Market Scope
Figure 2. Pricing Forecasts Per Unit, 2023- 2032
Figure 3. Porter’s Five Forces
Figure 4. Global Fermented Vegetables Market Revenue (USD Million) By Regions (2021-2032)
Figure 5. Global Fermented Vegetables Market Share (%) By Regions (2023)
Figure 6. North America Fermented Vegetables Revenue (USD Million) By Country (2021-2032)
Figure 7. United States Fermented Vegetables Revenue (USD Million) By Country (2021-2032)
Figure 8. Canada Fermented Vegetables Revenue (USD Million) By Country (2021-2032)
Figure 9. Mexico Fermented Vegetables Revenue (USD Million) By Country (2021-2032)
Figure 10. Europe Fermented Vegetables Revenue (USD Million) By Country (2021-2032)
Figure 11. Germany Fermented Vegetables Revenue (USD Million) By Country (2021-2032)
Figure 12. France Fermented Vegetables Revenue (USD Million) By Country (2021-2032)
Figure 13. United Kingdom Fermented Vegetables Revenue (USD Million) By Country (2021-2032)
Figure 14. Spain Fermented Vegetables Revenue (USD Million) By Country (2021-2032)
Figure 15. Italy Fermented Vegetables Revenue (USD Million) By Country (2021-2032)
Figure 16. Russia Fermented Vegetables Revenue (USD Million) By Country (2021-2032)
Figure 17. Rest of Europe Fermented Vegetables Revenue (USD Million) By Country (2021-2032)
Figure 11. Asia Pacific Fermented Vegetables Revenue (USD Million) By Country (2021-2032)
Figure 12. China Fermented Vegetables Revenue (USD Million) By Country (2021-2032)
Figure 13. Japan Fermented Vegetables Revenue (USD Million) By Country (2021-2032)
Figure 14. India Fermented Vegetables Revenue (USD Million) By Country (2021-2032)
Figure 15. South Korea Fermented Vegetables Revenue (USD Million) By Country (2021-2032)
Figure 16. Australia Fermented Vegetables Revenue (USD Million) By Country (2021-2032)
Figure 17. South East Asia Fermented Vegetables Revenue (USD Million) By Country (2021-2032)
Figure 18. South America Fermented Vegetables Revenue (USD Million) By Country (2021-2032)
Figure 19. Brazil Fermented Vegetables Revenue (USD Million) By Country (2021-2032)
Figure 20. Argentina Fermented Vegetables Revenue (USD Million) By Country (2021-2032)
Figure 21. Rest of Asia Pacific Fermented Vegetables Revenue (USD Million) By Country (2021-2032)
Figure 22. Middle East and Africa Fermented Vegetables Revenue (USD Million) By Region (2021-2032)
Figure 23. Saudi Arabia Fermented Vegetables Revenue (USD Million) By Region (2021-2032)
Figure 24. The UAE Fermented Vegetables Revenue (USD Million) By Region (2021-2032)
Figure 25. Rest of Middle East Fermented Vegetables Revenue (USD Million) By Region (2021-2032)
Figure 26. South Africa Fermented Vegetables Revenue (USD Million) By Region (2021-2032)
Figure 27. Africa Fermented Vegetables Revenue (USD Million) By Region (2021-2032)
Figure 28. North America Fermented Vegetables Revenue (USD Million) By Type (2021-2032)
Figure 29. North America Fermented Vegetables Revenue (USD Million) By Application (2021-2032)
Figure 30. North America Fermented Vegetables Revenue (USD Million) By Product (2021-2032)
Figure 31. Europe Fermented Vegetables Revenue (USD Million) By Type (2021-2032)
Figure 32. Europe Fermented Vegetables Revenue (USD Million) By Application (2021-2032)
Figure 33. Europe Fermented Vegetables Revenue (USD Million) By Product (2021-2032)
Figure 34. Asia Pacific Fermented Vegetables Revenue (USD Million) By Type (2021-2032)
Figure 35. Asia Pacific Fermented Vegetables Revenue (USD Million) By Application (2021-2032)
Figure 36. Asia Pacific Fermented Vegetables Revenue (USD Million) By Product (2021-2032)
Figure 37. South America Fermented Vegetables Revenue (USD Million) By Type (2021-2032)
Figure 38. South America Fermented Vegetables Revenue (USD Million) By Application (2021-2032)
Figure 39. South America Fermented Vegetables Revenue (USD Million) By Product (2021-2032)
Figure 40. Middle East and Africa Fermented Vegetables Revenue (USD Million) By Type (2021-2032)
Figure 41. Middle East and Africa Fermented Vegetables Revenue (USD Million) By Application (2021-2032)
Figure 42. Middle East and Africa Fermented Vegetables Revenue (USD Million) By Product (2021-2032)
By Type
Conventional
Organic
By Application
Food Service
Supermarkets/Hypermarkets
Departmental Stores
Specialty Stores
Online Retail
Others
Countries Analyzed
North America (US, Canada, Mexico)
Europe (Germany, UK, France, Spain, Italy, Russia, Rest of Europe)
Asia Pacific (China, India, Japan, South Korea, Australia, South East Asia, Rest of Asia)
South America (Brazil, Argentina, Rest of South America)
Middle East and Africa (Saudi Arabia, UAE, Rest of Middle East, South Africa, Egypt, Rest of Africa)
