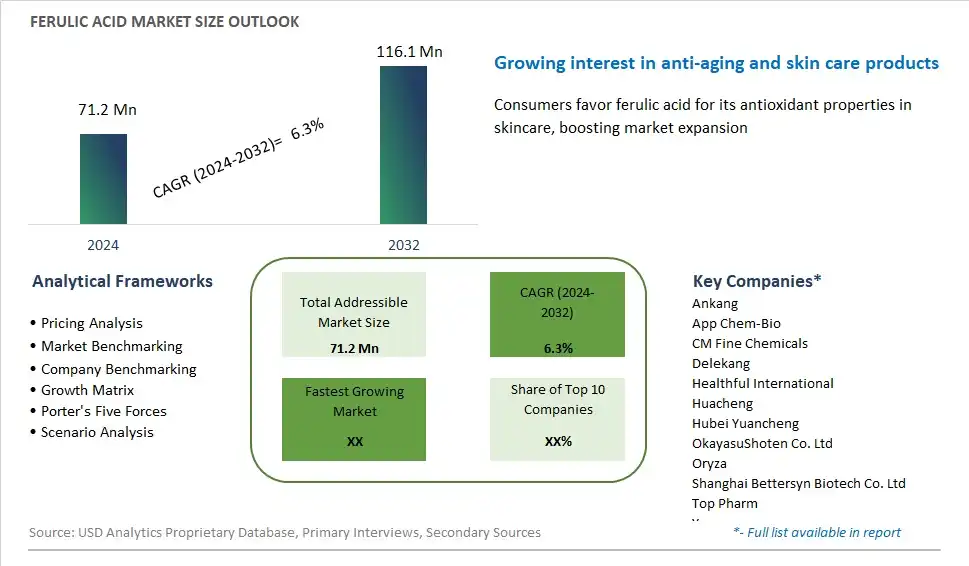
Global Ferulic Acid Market Size is valued at $71.2 Million in 2024 and is forecast to register a growth rate (CAGR) of 6.3% to reach $116.1 Million by 2032.
The global Ferulic Acid Market Comprehensive Study analyzes and forecasts the market size across 6 regions and 24 countries for diverse segments -By Type (Natural, Synthesis), By Packaging (Interior Packaging, Exterior Packaging), By Application (Pharmaceuticals Intermediates, Cosmetics, Others)
An Introduction to Ferulic Acid Market
Ferulic acid is a phytochemical compound found naturally in various plants, seeds, and grains, known for its antioxidant and anti-inflammatory properties in 2024. This organic compound belongs to the phenolic acid family and is abundant in foods such as fruits, vegetables, whole grains, and coffee. Ferulic acid is prized for its ability to scavenge free radicals, protect cells from oxidative damage, and reduce inflammation, making it beneficial for skin health, cardiovascular health, and overall well-being. In addition to its role as a dietary antioxidant, ferulic acid is used in cosmetic formulations and skincare products for its anti-aging and skin-protective effects. It helps to stabilize vitamins C and E, enhance collagen production, and protect against UV-induced skin damage, making it a popular ingredient in anti-aging serums, moisturizers, and sunscreens. With increasing consumer awareness of the health benefits of antioxidants and natural skincare ingredients, the market for ferulic acid is growing. Cosmetic companies, nutraceutical manufacturers, and food supplement producers are incorporating ferulic acid into their product formulations to offer consumers effective and science-backed solutions for maintaining youthful skin, supporting cardiovascular health, and promoting overall vitality and wellness.
Ferulic Acid Competitive Landscape
The market report analyses the leading companies in the industry including Ankang, App Chem-Bio, CM Fine Chemicals, Delekang, Healthful International, Huacheng, Hubei Yuancheng, OkayasuShoten Co. Ltd, Oryza, Shanghai Bettersyn Biotech Co. Ltd, Top Pharm, Yuansen, and Others.
Ferulic Acid Market Dynamics
Ferulic Acid Market Trend: Increasing Demand for Natural Ingredients in Skincare
A significant trend in the ferulic acid market is the rising demand for natural ingredients in skincare products. As consumers become more conscious of the ingredients they apply to their skin, there is a growing preference for skincare formulations that contain natural, plant-derived compounds like ferulic acid. Ferulic acid is renowned for its antioxidant properties, which can help protect the skin from environmental stressors such as UV radiation and pollution, and its ability to enhance the stability and efficacy of other skincare ingredients like vitamins C and E. This trend is driving the incorporation of ferulic acid into various skincare formulations, including serums, creams, and lotions, as consumers seek out products that offer both efficacy and safety, aligning with their desire for clean and green beauty solutions.
Market Driver: Growing Awareness of Antioxidant Benefits
A key driver of the ferulic acid market is the increasing awareness of the antioxidant benefits associated with its use in skincare products. Antioxidants play a crucial role in neutralizing free radicals and preventing oxidative damage to the skin, which can lead to premature aging, hyperpigmentation, and other skin concerns. Ferulic acid, in particular, has been shown to exhibit potent antioxidant activity, making it a sought-after ingredient in anti-aging and sun protection formulations. As consumers seek out skincare products that offer comprehensive protection against environmental aggressors and promote skin health and vitality, there is a growing demand for products containing ferulic acid and other antioxidants. This heightened awareness of the importance of antioxidants in skincare is driving market growth and stimulating innovation in product development to meet consumer needs and preferences for effective and science-backed skincare solutions.
Market Opportunity: Expansion into Cosmeceutical Formulations
An opportunity for the ferulic acid market lies in the expansion into cosmeceutical formulations, where there is a growing demand for skincare products that bridge the gap between cosmetics and pharmaceuticals, offering both cosmetic and therapeutic benefits. Ferulic acid's antioxidant properties and potential anti-inflammatory and photoprotective effects make it an ideal ingredient for cosmeceutical formulations designed to address specific skin concerns, such as aging, hyperpigmentation, and sun damage. By incorporating ferulic acid into cosmeceutical products such as anti-aging serums, brightening treatments, and sunscreens, manufacturers can capitalize on the increasing consumer interest in advanced skincare solutions that deliver visible results. Additionally, there is an opportunity to leverage scientific research and clinical studies to substantiate the efficacy and safety of ferulic acid-based cosmeceutical formulations, further enhancing consumer confidence and driving market penetration in the rapidly expanding cosmeceutical segment.
Ferulic Acid Market Share Analysis: Natural Ferulic Acid held the dominant market share in 2024
In the Ferulic Acid Market categorized by Type, the Natural segment is the largest and most dominant. This prominence can be attributed to several factors. Firstly, natural ferulic acid is derived from sources such as rice bran, oats, and fruits, offering a sustainable and eco-friendly alternative to synthetic counterparts. Consumers increasingly prefer natural ingredients due to their perceived health benefits, safety profile, and environmental sustainability, driving the demand for natural ferulic acid in various industries, including cosmetics, pharmaceuticals, and food additives. Further, natural ferulic acid exhibits higher bioavailability and antioxidant activity compared to synthetic forms, making it highly sought after for its potential health-promoting properties. Additionally, regulatory initiatives promoting the use of natural ingredients in consumer products further bolster the market demand for natural ferulic acid. As a result, the Natural segment within the Ferulic Acid Market maintains its leadership position, driven by growing consumer awareness, regulatory support, and the inherent advantages of natural sources in meeting diverse industry needs and preferences.
Ferulic Acid Market Share Analysis: Exterior Packaging market is poised to register the fastest growth rae over the forecast period to 2032
Within the Ferulic Acid Market segmented by Packaging, the Exterior Packaging category is the fastest growing segment. This growth can be attributed to several key factors. Firstly, exterior packaging plays a critical role in safeguarding ferulic acid products during transportation, storage, and display, protecting them from external factors such as moisture, light, and physical damage. As consumer awareness regarding product safety and quality increases, there is a growing emphasis on robust and visually appealing packaging solutions that enhance product integrity and shelf appeal. Further, stringent regulatory requirements and industry standards mandate the use of durable and tamper-evident exterior packaging to ensure product authenticity and compliance with labeling regulations. Additionally, the rise of e-commerce and online retail channels has spurred the demand for innovative packaging designs that offer both logistical efficiency and aesthetic appeal, driving the adoption of advanced exterior packaging solutions in the ferulic acid market. As a result, the Exterior Packaging segment is experiencing rapid growth, fueled by evolving consumer preferences, regulatory mandates, and the need for effective product protection and branding strategies in a competitive marketplace.
Ferulic Acid Market Share Analysis: Cosmetics held the dominant market share in 2024
In the Ferulic Acid Market segmented by Application, the Cosmetics category is the largest and most dominant segment. This prominence can be attributed to several factors. Firstly, ferulic acid has gained widespread recognition in the cosmetics industry for its potent antioxidant properties, which help combat free radical damage and oxidative stress, thereby promoting skin health and vitality. As consumers increasingly prioritize skincare products that offer anti-aging and protective benefits, the demand for ferulic acid-infused cosmetics, such as serums, moisturizers, and sunscreens, continues to surge. Further, ferulic acid is known to enhance the stability and efficacy of other active ingredients, such as vitamin C and vitamin E, in cosmetic formulations, further augmenting its appeal to skincare manufacturers and consumers alike. Additionally, the growing trend towards natural and plant-based beauty solutions drives the preference for ferulic acid derived from botanical sources, aligning with the clean beauty movement. As a result, the Cosmetics segment within the Ferulic Acid Market maintains its leadership position, propelled by the increasing consumer demand for effective and natural skincare solutions enriched with the benefits of ferulic acid.
Ferulic Acid Market Segmentation
By Type
Natural
Synthesis
By Packaging
Interior Packaging
Exterior Packaging
By Application
Pharmaceuticals Intermediates
Cosmetics
Others
Countries Analyzed
North America (US, Canada, Mexico)
Europe (Germany, UK, France, Spain, Italy, Russia, Rest of Europe)
Asia Pacific (China, India, Japan, South Korea, Australia, South East Asia, Rest of Asia)
South America (Brazil, Argentina, Rest of South America)
Middle East and Africa (Saudi Arabia, UAE, Rest of Middle East, South Africa, Egypt, Rest of Africa)
Ferulic Acid Companies Profiled in the Study
Ankang
App Chem-Bio
CM Fine Chemicals
Delekang
Healthful International
Huacheng
Hubei Yuancheng
OkayasuShoten Co. Ltd
Oryza
Shanghai Bettersyn Biotech Co. Ltd
Top Pharm
Yuansen
*- List Not Exhaustive
Chapter 1. TABLE OF CONTENTS
Chapter 2. Introduction to Ferulic Acid Market
2.1. Market Overview
2.2. Key Statistics and Report Highlights
2.3. Scope of the Comprehensive Study
2.3.1. Market Definition
2.3.2 Countries and Regions Covered
2.3.3 Research Objective
2.3.4 Units, Currency, and Conversions
2.3.5 Industry Value Chain
2.4. Key Market Segments
2.5. Key Companies
2.6. Study Period
Chapter 3. Strategic Analysis Review
3.1. Ferulic Acid Pricing Analysis and Forecast
3.2. Porter’s Five Forces
3.3. Market Ecosystem
3.4. SWOT Analysis
3.5. Regulatory Scenario
3.3. Effects of Inflation, Russia-Ukraine War, moderating economic growth, and other macroeconomic factors
Chapter 4. Competitive Landscape
4.1. Market Share Analysis
4.1.1. Global Ferulic Acid Market Share by Company, 2023
4.1.2. Product Offerings of Leading Ferulic Acid Companies
4.2. Market Entropy
4.2.1. New Product Launches in the Industry
4.2.2. Mergers, Acquisitions, Joint ventures, and Partnerships
4.3. Key Strategies and Best Practices
Chapter 5. Global Market Projections: Best, Reference, and Low Case Scenarios
5.1. Growth Analysis- Case Scenario Definitions
5.2. Low Growth Case Scenario Forecasts
5.3. Reference Growth Case Scenario Forecasts
5.4. High Growth Case Scenario Forecasts
Chapter 6. Market Dynamics
6.1. Ferulic Acid Market Drivers
6.2. Ferulic Acid Market Challenges
6.6. Ferulic Acid Market Opportunities
6.4. Ferulic Acid Market Trends
Chapter 7. Global Ferulic Acid Market Outlook Trends
7.1. Global Ferulic Acid Revenue (USD Million) and CAGR (%) by Type (2021-2032)
7.2. Global Ferulic Acid Revenue (USD Million) and CAGR (%) by Application (2021-2032)
7.3. Global Ferulic Acid Revenue (USD Million) and CAGR (%) by Product (2021-2032)
By Type
Natural
Synthesis
By Packaging
Interior Packaging
Exterior Packaging
By Application
Pharmaceuticals Intermediates
Cosmetics
Others
Chapter 8. Global Ferulic Acid Regional Analysis and Outlook
8.1. Global Ferulic Acid Revenue (USD Million) By Regions (2021- 2032)
8.2. North America Ferulic Acid Revenue (USD Million) by Country (2021-2032)
8.2.1. United States Ferulic Acid Regional Analysis and Outlook
8.2.2. Canada Ferulic Acid Regional Analysis and Outlook
8.2.3. Mexico Ferulic Acid Regional Analysis and Outlook
8.3. Europe Ferulic Acid Revenue (USD Million), by Country (2021-2032)
8.3.1. Germany Ferulic Acid Regional Analysis and Outlook
8.3.2. France Ferulic Acid Regional Analysis and Outlook
8.3.3. United Kingdom Ferulic Acid Regional Analysis and Outlook
8.3.4. Spain Ferulic Acid Regional Analysis and Outlook
8.3.5. Italy Ferulic Acid Regional Analysis and Outlook
8.3.6. Russia Ferulic Acid Regional Analysis and Outlook
8.3.7. Rest of Europe Ferulic Acid Regional Analysis and Outlook
8.4. Asia Pacific Ferulic Acid Revenue (USD Million) by Country (2021-2032)
8.4.1. China Ferulic Acid Regional Analysis and Outlook
8.4.2. Japan Ferulic Acid Regional Analysis and Outlook
8.4.3. India Ferulic Acid Regional Analysis and Outlook
8.4.4. South Korea Ferulic Acid Regional Analysis and Outlook
8.4.5. Australia Ferulic Acid Regional Analysis and Outlook
8.4.6. South East Asia Ferulic Acid Regional Analysis and Outlook
8.4.7. Rest of Asia Pacific Ferulic Acid Regional Analysis and Outlook
8.5. South America Ferulic Acid Revenue (USD Million), by Country (2021-2032)
8.5.1. Brazil Ferulic Acid Regional Analysis and Outlook
8.5.2. Argentina Ferulic Acid Regional Analysis and Outlook
8.5.3. Rest of South America Ferulic Acid Regional Analysis and Outlook
8.6. Middle East and Africa Ferulic Acid Revenue (USD Million) by Country (2021-2032)
8.6.1. Middle East Ferulic Acid Regional Analysis and Outlook
8.6.2. Africa Ferulic Acid Regional Analysis and Outlook
Chapter 9. North America Ferulic Acid Analysis and Outlook
9.1. North America Ferulic Acid Revenue (USD Million) by Segments (2021-2032)
9.1.1. North America Ferulic Acid Revenue (USD Million) by Type (2021-2032)
9.1.2. North America Ferulic Acid Revenue (USD Million) by Application (2021-2032)
9.1.3. North America Ferulic Acid Revenue (USD Million) by Product (2021-2032)
By Type
Natural
Synthesis
By Packaging
Interior Packaging
Exterior Packaging
By Application
Pharmaceuticals Intermediates
Cosmetics
Others
Chapter 10. Europe Ferulic Acid Analysis and Outlook
10.1. Europe Ferulic Acid Revenue (USD Million), by Segments (USD Million) (2021-2032)
10.1.1. Europe Ferulic Acid Revenue (USD Million) by Type (2021-2032)
10.1.2. Europe Ferulic Acid Revenue (USD Million) by Application (2021-2032)
10.1.3. Europe Ferulic Acid Revenue (USD Million) by Product (2021-2032)
By Type
Natural
Synthesis
By Packaging
Interior Packaging
Exterior Packaging
By Application
Pharmaceuticals Intermediates
Cosmetics
Others
Chapter 11. Asia Pacific Ferulic Acid Analysis and Outlook
11.1. Asia Pacific Ferulic Acid Revenue (USD Million), and Revenue (USD Million) by Segments (2021-2032)
11.1.1. Asia Pacific Ferulic Acid Revenue (USD Million) by Type (2021-2032)
11.1.2. Asia Pacific Ferulic Acid Revenue (USD Million) by Application (2021-2032)
11.1.3. Asia Pacific Ferulic Acid Revenue (USD Million) by Product (2021-2032)
By Type
Natural
Synthesis
By Packaging
Interior Packaging
Exterior Packaging
By Application
Pharmaceuticals Intermediates
Cosmetics
Others
Chapter 12. South America Ferulic Acid Analysis and Outlook
12.1. South America Ferulic Acid Revenue (USD Million), by Segments (2021-2032)
12.1.1. South America Ferulic Acid Revenue (USD Million) by Type (2021-2032)
12.1.2. South America Ferulic Acid Revenue (USD Million) by Application (2021-2032)
12.1.3. South America Ferulic Acid Revenue (USD Million) by Product (2021-2032)
By Type
Natural
Synthesis
By Packaging
Interior Packaging
Exterior Packaging
By Application
Pharmaceuticals Intermediates
Cosmetics
Others
Chapter 13. Middle East and Africa Ferulic Acid Analysis and Outlook
13.1. Middle East and Africa Ferulic Acid Revenue (USD Million), by Segments (2021-2032)
13.1.1. Middle East and Africa Ferulic Acid Revenue (USD Million) by Type (2021-2032)
13.1.2. Middle East and Africa Ferulic Acid Revenue (USD Million) by Application (2021-2032)
13.1.3. Middle East and Africa Ferulic Acid Revenue (USD Million) by Product (2021-2032)
By Type
Natural
Synthesis
By Packaging
Interior Packaging
Exterior Packaging
By Application
Pharmaceuticals Intermediates
Cosmetics
Others
Chapter 14. Ferulic Acid Company Profiles
14.1 Business Overview
14.2 Product Profiles
14.3 SWOT Profiles
14.5 Recent Developments
14.6 Financial Profile
List of Companies
Ankang
App Chem-Bio
CM Fine Chemicals
Delekang
Healthful International
Huacheng
Hubei Yuancheng
OkayasuShoten Co. Ltd
Oryza
Shanghai Bettersyn Biotech Co. Ltd
Top Pharm
Yuansen
15. Methodology and Data Sources
15.1 Customization Offerings
15.2 Subscription Services
15.3 Related Reports
15.4 Publisher Expertise
LIST OF TABLES
Table 1 Market Segmentation Analysis
Table 2 Global Ferulic Acid Market Share of Leading Companies, 2023
Table 3 Product Offerings of Leading Companies
Table 4 Low Growth Scenario Forecasts
Table 5 Reference Case Growth Scenario
Table 6 High Growth Case Scenario
Table 7 Global Ferulic Acid Revenue (USD Million) And CAGR (%) By Type (2021-2032)
Table 8 Global Ferulic Acid Revenue (USD Million) And CAGR (%) By Application (2021-2032)
Table 9 Global Ferulic Acid Revenue (USD Million) And CAGR (%) By Product (2021-2032)
Table 10 Global Ferulic Acid Market Revenue (USD Million) By Regions (2021-2032)
Table 11 Global Ferulic Acid Market Share (%) By Regions (2021-2032)
Table 12 North America Ferulic Acid Revenue (USD Million) By Country (2021-2032)
Table 13 Europe Ferulic Acid Revenue (USD Million) By Country (2021-2032)
Table 14 Asia Pacific Ferulic Acid Revenue (USD Million) By Country (2021-2032)
Table 15 South America Ferulic Acid Revenue (USD Million) By Country (2021-2032)
Table 16 Middle East and Africa Ferulic Acid Revenue (USD Million) By Region (2021-2032)
Table 17 North America Ferulic Acid Revenue (USD Million) By Type (2021-2032)
Table 18 North America Ferulic Acid Revenue (USD Million) By Application (2021-2032)
Table 19 North America Ferulic Acid Revenue (USD Million) By Product (2021-2032)
Table 20 Europe Ferulic Acid Revenue (USD Million) By Type (2021-2032)
Table 21 Europe Ferulic Acid Revenue (USD Million) By Application (2021-2032)
Table 22 Europe Ferulic Acid Revenue (USD Million) By Product (2021-2032)
Table 23 Asia Pacific Ferulic Acid Revenue (USD Million) By Type (2021-2032)
Table 24 Asia Pacific Ferulic Acid Revenue (USD Million) By Application (2021-2032)
Table 25 Asia Pacific Ferulic Acid Revenue (USD Million) By Product (2021-2032)
Table 26 South America Ferulic Acid Revenue (USD Million) By Type (2021-2032)
Table 27 South America Ferulic Acid Revenue (USD Million) By Application (2021-2032)
Table 28 South America Ferulic Acid Revenue (USD Million) By Product (2021-2032)
Table 29 Middle East and Africa Ferulic Acid Revenue (USD Million) By Type (2021-2032)
Table 30 Middle East and Africa Ferulic Acid Revenue (USD Million) By Application (2021-2032)
Table 31 Middle East and Africa Ferulic Acid Revenue (USD Million) By Product (2021-2032)
LIST OF FIGURES
Figure 1. Market Scope
Figure 2. Pricing Forecasts Per Unit, 2023- 2032
Figure 3. Porter’s Five Forces
Figure 4. Global Ferulic Acid Market Revenue (USD Million) By Regions (2021-2032)
Figure 5. Global Ferulic Acid Market Share (%) By Regions (2023)
Figure 6. North America Ferulic Acid Revenue (USD Million) By Country (2021-2032)
Figure 7. United States Ferulic Acid Revenue (USD Million) By Country (2021-2032)
Figure 8. Canada Ferulic Acid Revenue (USD Million) By Country (2021-2032)
Figure 9. Mexico Ferulic Acid Revenue (USD Million) By Country (2021-2032)
Figure 10. Europe Ferulic Acid Revenue (USD Million) By Country (2021-2032)
Figure 11. Germany Ferulic Acid Revenue (USD Million) By Country (2021-2032)
Figure 12. France Ferulic Acid Revenue (USD Million) By Country (2021-2032)
Figure 13. United Kingdom Ferulic Acid Revenue (USD Million) By Country (2021-2032)
Figure 14. Spain Ferulic Acid Revenue (USD Million) By Country (2021-2032)
Figure 15. Italy Ferulic Acid Revenue (USD Million) By Country (2021-2032)
Figure 16. Russia Ferulic Acid Revenue (USD Million) By Country (2021-2032)
Figure 17. Rest of Europe Ferulic Acid Revenue (USD Million) By Country (2021-2032)
Figure 11. Asia Pacific Ferulic Acid Revenue (USD Million) By Country (2021-2032)
Figure 12. China Ferulic Acid Revenue (USD Million) By Country (2021-2032)
Figure 13. Japan Ferulic Acid Revenue (USD Million) By Country (2021-2032)
Figure 14. India Ferulic Acid Revenue (USD Million) By Country (2021-2032)
Figure 15. South Korea Ferulic Acid Revenue (USD Million) By Country (2021-2032)
Figure 16. Australia Ferulic Acid Revenue (USD Million) By Country (2021-2032)
Figure 17. South East Asia Ferulic Acid Revenue (USD Million) By Country (2021-2032)
Figure 18. South America Ferulic Acid Revenue (USD Million) By Country (2021-2032)
Figure 19. Brazil Ferulic Acid Revenue (USD Million) By Country (2021-2032)
Figure 20. Argentina Ferulic Acid Revenue (USD Million) By Country (2021-2032)
Figure 21. Rest of Asia Pacific Ferulic Acid Revenue (USD Million) By Country (2021-2032)
Figure 22. Middle East and Africa Ferulic Acid Revenue (USD Million) By Region (2021-2032)
Figure 23. Saudi Arabia Ferulic Acid Revenue (USD Million) By Region (2021-2032)
Figure 24. The UAE Ferulic Acid Revenue (USD Million) By Region (2021-2032)
Figure 25. Rest of Middle East Ferulic Acid Revenue (USD Million) By Region (2021-2032)
Figure 26. South Africa Ferulic Acid Revenue (USD Million) By Region (2021-2032)
Figure 27. Africa Ferulic Acid Revenue (USD Million) By Region (2021-2032)
Figure 28. North America Ferulic Acid Revenue (USD Million) By Type (2021-2032)
Figure 29. North America Ferulic Acid Revenue (USD Million) By Application (2021-2032)
Figure 30. North America Ferulic Acid Revenue (USD Million) By Product (2021-2032)
Figure 31. Europe Ferulic Acid Revenue (USD Million) By Type (2021-2032)
Figure 32. Europe Ferulic Acid Revenue (USD Million) By Application (2021-2032)
Figure 33. Europe Ferulic Acid Revenue (USD Million) By Product (2021-2032)
Figure 34. Asia Pacific Ferulic Acid Revenue (USD Million) By Type (2021-2032)
Figure 35. Asia Pacific Ferulic Acid Revenue (USD Million) By Application (2021-2032)
Figure 36. Asia Pacific Ferulic Acid Revenue (USD Million) By Product (2021-2032)
Figure 37. South America Ferulic Acid Revenue (USD Million) By Type (2021-2032)
Figure 38. South America Ferulic Acid Revenue (USD Million) By Application (2021-2032)
Figure 39. South America Ferulic Acid Revenue (USD Million) By Product (2021-2032)
Figure 40. Middle East and Africa Ferulic Acid Revenue (USD Million) By Type (2021-2032)
Figure 41. Middle East and Africa Ferulic Acid Revenue (USD Million) By Application (2021-2032)
Figure 42. Middle East and Africa Ferulic Acid Revenue (USD Million) By Product (2021-2032)
By Type
Natural
Synthesis
By Packaging
Interior Packaging
Exterior Packaging
By Application
Pharmaceuticals Intermediates
Cosmetics
Others
Countries Analyzed
North America (US, Canada, Mexico)
Europe (Germany, UK, France, Spain, Italy, Russia, Rest of Europe)
Asia Pacific (China, India, Japan, South Korea, Australia, South East Asia, Rest of Asia)
South America (Brazil, Argentina, Rest of South America)
Middle East and Africa (Saudi Arabia, UAE, Rest of Middle East, South Africa, Egypt, Rest of Africa)
