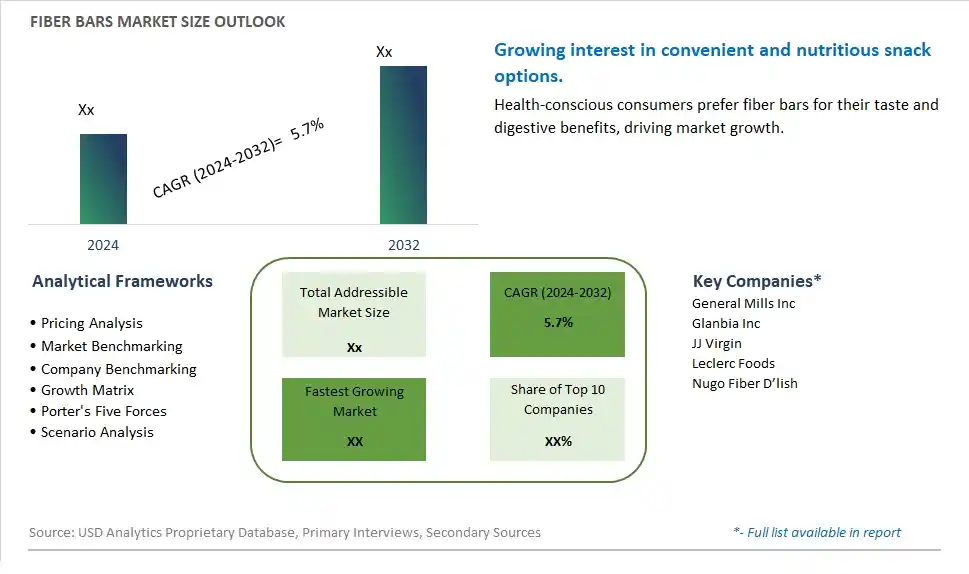
Global Fiber Bars Market Size is valued at $XX Million in 2024 and is forecast to register a growth rate (CAGR) of 5.7% to reach $XX Million by 2032.
The global Fiber Bars Market Comprehensive Study analyzes and forecasts the market size across 6 regions and 24 countries for diverse segments -By Type (Gluten Free, Non-GMO Free, Others), By Distribution Channel (Supermarkets/Hypermarkets, Convenience Stores, Specialty Stores, Online Sales Channel, Others)
An Introduction to Fiber Bars Market
In 2024, the Fiber Bars market is thriving, fueled by the rising demand for convenient and nutritious snack options. Fiber bars, known for their high fiber content and health benefits, are popular among busy professionals, athletes, and health-conscious consumers. The market benefits from advancements in food formulation technologies, the growing trend of functional and clean label foods, and the expansion of the health and wellness sector. Additionally, the increasing awareness of the benefits of dietary fiber for digestive health and weight management is driving market growth.
Fiber Bars Competitive Landscape
The market report analyses the leading companies in the industry including General Mills Inc, Glanbia Inc, JJ Virgin, Leclerc Foods, Nugo Fiber D’lish, and Others.
Fiber Bars Market Dynamics
Fiber Bars Market Trend: Rising Demand for Convenient and Healthy Snacks
The fiber bars market is witnessing a prominent trend towards the rising demand for convenient and healthy snacks. Consumers are increasingly looking for on-the-go snack options that not only satisfy hunger but also provide nutritional benefits. Fiber bars, known for their high fiber content and ability to aid in digestion and weight management, are becoming a popular choice. This trend is driven by busy lifestyles, where individuals seek quick, nutritious snacks that fit into their health-conscious routines. The market is seeing a proliferation of new flavors and formulations, catering to a variety of dietary preferences such as vegan, gluten-free, and low-sugar options.
Fiber Bars Market Driver: Increasing Health Awareness
The increasing health awareness among consumers is a significant driver for the fiber bars market. With a growing understanding of the importance of dietary fiber in maintaining digestive health, controlling blood sugar levels, and aiding weight loss, more people are incorporating fiber-rich foods into their diets. Fiber bars offer a convenient way to meet daily fiber intake requirements, especially for those with busy schedules. The rising prevalence of lifestyle-related diseases, such as obesity and diabetes, is also encouraging consumers to choose healthier snack options. This heightened health consciousness is fueling the demand for fiber bars as part of a balanced diet.
Fiber Bars Market Opportunity: Expansion into Functional Ingredients
There is a considerable opportunity for growth in the fiber bars market through the expansion into functional ingredients. Manufacturers can enhance the nutritional profile of fiber bars by incorporating additional functional ingredients such as probiotics, prebiotics, protein, and superfoods. These ingredients can provide added health benefits, making the bars more appealing to health-conscious consumers. There is also potential for innovation in flavors and textures to attract a broader audience. By focusing on functional ingredients and product differentiation, companies can capture new consumer segments and drive growth in the fiber bars market. Additionally, marketing these enhanced products as part of a healthy lifestyle can further boost their appeal.
Fiber Bars Market Share Analysis: Gluten Free segment generated the highest revenue share in the industry
Gluten Free is the largest segment in the Fiber Bars Market. This prominence stems from the growing consumer awareness and concern regarding gluten-related disorders, such as celiac disease and gluten sensitivity, which have led many to adopt a gluten-free diet. Gluten-free fiber bars cater to this need by providing a convenient, portable snack that fits into various dietary restrictions while still offering the benefits of high dietary fiber, such as improved digestion and prolonged satiety. These bars are particularly popular among health-conscious consumers who are not only looking to avoid gluten but also seeking out snacks that contribute to a healthier lifestyle. Manufacturers have responded to this demand by expanding their product ranges to include a variety of flavors and ingredients that appeal to a broad consumer base, further solidifying the dominance of the gluten-free segment in the fiber bars market.
Fiber Bars Market Share Analysis: Online Sales Channel is the fastest growing segment over the forecast period to 2032
The Online Sales Channel is projected to be the fastest-growing distribution channel in the Fiber Bars Market by 2032. The growth of this segment is driven by the increasing consumer preference for the convenience of online shopping, which offers easy access to a wide array of products from different brands and regions without the need to visit physical stores. The online platform's appeal is enhanced by the ability to quickly compare prices, read customer reviews, and find detailed product information, which is particularly advantageous for dietary-specific products like fiber bars. Furthermore, the expansion of e-commerce has been accompanied by improved logistics and faster delivery options, making online purchases even more attractive. The rising penetration of internet and mobile device usage continues to boost online sales, with more consumers turning to e-commerce platforms for their regular shopping needs, including health-focused products like fiber bars. This trend is expected to accelerate, making online sales the fastest-growing distribution channel in the market.
Fiber Bars Market Segmentation
By Type
Gluten Free
Non-GMO Free
Others
By Distribution Channel
Supermarkets/Hypermarkets
Convenience Stores
Specialty Stores
Online Sales Channel
Others
Countries Analyzed
North America (US, Canada, Mexico)
Europe (Germany, UK, France, Spain, Italy, Russia, Rest of Europe)
Asia Pacific (China, India, Japan, South Korea, Australia, South East Asia, Rest of Asia)
South America (Brazil, Argentina, Rest of South America)
Middle East and Africa (Saudi Arabia, UAE, Rest of Middle East, South Africa, Egypt, Rest of Africa)
Fiber Bars Companies Profiled in the Study
General Mills Inc
Glanbia Inc
JJ Virgin
Leclerc Foods
Nugo Fiber D’lish
*- List Not Exhaustive
Chapter 1. TABLE OF CONTENTS
Chapter 2. Introduction to Fiber Bars Market
2.1. Market Overview
2.2. Key Statistics and Report Highlights
2.3. Scope of the Comprehensive Study
2.3.1. Market Definition
2.3.2 Countries and Regions Covered
2.3.3 Research Objective
2.3.4 Units, Currency, and Conversions
2.3.5 Industry Value Chain
2.4. Key Market Segments
2.5. Key Companies
2.6. Study Period
Chapter 3. Strategic Analysis Review
3.1. Fiber Bars Pricing Analysis and Forecast
3.2. Porter’s Five Forces
3.3. Market Ecosystem
3.4. SWOT Analysis
3.5. Regulatory Scenario
3.3. Effects of Inflation, Russia-Ukraine War, moderating economic growth, and other macroeconomic factors
Chapter 4. Competitive Landscape
4.1. Market Share Analysis
4.1.1. Global Fiber Bars Market Share by Company, 2023
4.1.2. Product Offerings of Leading Fiber Bars Companies
4.2. Market Entropy
4.2.1. New Product Launches in the Industry
4.2.2. Mergers, Acquisitions, Joint ventures, and Partnerships
4.3. Key Strategies and Best Practices
Chapter 5. Global Market Projections: Best, Reference, and Low Case Scenarios
5.1. Growth Analysis- Case Scenario Definitions
5.2. Low Growth Case Scenario Forecasts
5.3. Reference Growth Case Scenario Forecasts
5.4. High Growth Case Scenario Forecasts
Chapter 6. Market Dynamics
6.1. Fiber Bars Market Drivers
6.2. Fiber Bars Market Challenges
6.6. Fiber Bars Market Opportunities
6.4. Fiber Bars Market Trends
Chapter 7. Global Fiber Bars Market Outlook Trends
7.1. Global Fiber Bars Revenue (USD Million) and CAGR (%) by Type (2021-2032)
7.2. Global Fiber Bars Revenue (USD Million) and CAGR (%) by Application (2021-2032)
7.3. Global Fiber Bars Revenue (USD Million) and CAGR (%) by Product (2021-2032)
By Type
Gluten Free
Non-GMO Free
Others
By Distribution Channel
Supermarkets/Hypermarkets
Convenience Stores
Specialty Stores
Online Sales Channel
Others
Chapter 8. Global Fiber Bars Regional Analysis and Outlook
8.1. Global Fiber Bars Revenue (USD Million) By Regions (2021- 2032)
8.2. North America Fiber Bars Revenue (USD Million) by Country (2021-2032)
8.2.1. United States Fiber Bars Regional Analysis and Outlook
8.2.2. Canada Fiber Bars Regional Analysis and Outlook
8.2.3. Mexico Fiber Bars Regional Analysis and Outlook
8.3. Europe Fiber Bars Revenue (USD Million), by Country (2021-2032)
8.3.1. Germany Fiber Bars Regional Analysis and Outlook
8.3.2. France Fiber Bars Regional Analysis and Outlook
8.3.3. United Kingdom Fiber Bars Regional Analysis and Outlook
8.3.4. Spain Fiber Bars Regional Analysis and Outlook
8.3.5. Italy Fiber Bars Regional Analysis and Outlook
8.3.6. Russia Fiber Bars Regional Analysis and Outlook
8.3.7. Rest of Europe Fiber Bars Regional Analysis and Outlook
8.4. Asia Pacific Fiber Bars Revenue (USD Million) by Country (2021-2032)
8.4.1. China Fiber Bars Regional Analysis and Outlook
8.4.2. Japan Fiber Bars Regional Analysis and Outlook
8.4.3. India Fiber Bars Regional Analysis and Outlook
8.4.4. South Korea Fiber Bars Regional Analysis and Outlook
8.4.5. Australia Fiber Bars Regional Analysis and Outlook
8.4.6. South East Asia Fiber Bars Regional Analysis and Outlook
8.4.7. Rest of Asia Pacific Fiber Bars Regional Analysis and Outlook
8.5. South America Fiber Bars Revenue (USD Million), by Country (2021-2032)
8.5.1. Brazil Fiber Bars Regional Analysis and Outlook
8.5.2. Argentina Fiber Bars Regional Analysis and Outlook
8.5.3. Rest of South America Fiber Bars Regional Analysis and Outlook
8.6. Middle East and Africa Fiber Bars Revenue (USD Million) by Country (2021-2032)
8.6.1. Middle East Fiber Bars Regional Analysis and Outlook
8.6.2. Africa Fiber Bars Regional Analysis and Outlook
Chapter 9. North America Fiber Bars Analysis and Outlook
9.1. North America Fiber Bars Revenue (USD Million) by Segments (2021-2032)
9.1.1. North America Fiber Bars Revenue (USD Million) by Type (2021-2032)
9.1.2. North America Fiber Bars Revenue (USD Million) by Application (2021-2032)
9.1.3. North America Fiber Bars Revenue (USD Million) by Product (2021-2032)
By Type
Gluten Free
Non-GMO Free
Others
By Distribution Channel
Supermarkets/Hypermarkets
Convenience Stores
Specialty Stores
Online Sales Channel
Others
Chapter 10. Europe Fiber Bars Analysis and Outlook
10.1. Europe Fiber Bars Revenue (USD Million), by Segments (USD Million) (2021-2032)
10.1.1. Europe Fiber Bars Revenue (USD Million) by Type (2021-2032)
10.1.2. Europe Fiber Bars Revenue (USD Million) by Application (2021-2032)
10.1.3. Europe Fiber Bars Revenue (USD Million) by Product (2021-2032)
By Type
Gluten Free
Non-GMO Free
Others
By Distribution Channel
Supermarkets/Hypermarkets
Convenience Stores
Specialty Stores
Online Sales Channel
Others
Chapter 11. Asia Pacific Fiber Bars Analysis and Outlook
11.1. Asia Pacific Fiber Bars Revenue (USD Million), and Revenue (USD Million) by Segments (2021-2032)
11.1.1. Asia Pacific Fiber Bars Revenue (USD Million) by Type (2021-2032)
11.1.2. Asia Pacific Fiber Bars Revenue (USD Million) by Application (2021-2032)
11.1.3. Asia Pacific Fiber Bars Revenue (USD Million) by Product (2021-2032)
By Type
Gluten Free
Non-GMO Free
Others
By Distribution Channel
Supermarkets/Hypermarkets
Convenience Stores
Specialty Stores
Online Sales Channel
Others
Chapter 12. South America Fiber Bars Analysis and Outlook
12.1. South America Fiber Bars Revenue (USD Million), by Segments (2021-2032)
12.1.1. South America Fiber Bars Revenue (USD Million) by Type (2021-2032)
12.1.2. South America Fiber Bars Revenue (USD Million) by Application (2021-2032)
12.1.3. South America Fiber Bars Revenue (USD Million) by Product (2021-2032)
By Type
Gluten Free
Non-GMO Free
Others
By Distribution Channel
Supermarkets/Hypermarkets
Convenience Stores
Specialty Stores
Online Sales Channel
Others
Chapter 13. Middle East and Africa Fiber Bars Analysis and Outlook
13.1. Middle East and Africa Fiber Bars Revenue (USD Million), by Segments (2021-2032)
13.1.1. Middle East and Africa Fiber Bars Revenue (USD Million) by Type (2021-2032)
13.1.2. Middle East and Africa Fiber Bars Revenue (USD Million) by Application (2021-2032)
13.1.3. Middle East and Africa Fiber Bars Revenue (USD Million) by Product (2021-2032)
By Type
Gluten Free
Non-GMO Free
Others
By Distribution Channel
Supermarkets/Hypermarkets
Convenience Stores
Specialty Stores
Online Sales Channel
Others
Chapter 14. Fiber Bars Company Profiles
14.1 Business Overview
14.2 Product Profiles
14.3 SWOT Profiles
14.5 Recent Developments
14.6 Financial Profile
List of Companies
General Mills Inc
Glanbia Inc
JJ Virgin
Leclerc Foods
Nugo Fiber D’lish
15. Methodology and Data Sources
15.1 Customization Offerings
15.2 Subscription Services
15.3 Related Reports
15.4 Publisher Expertise
LIST OF TABLES
Table 1 Market Segmentation Analysis
Table 2 Global Fiber Bars Market Share of Leading Companies, 2023
Table 3 Product Offerings of Leading Companies
Table 4 Low Growth Scenario Forecasts
Table 5 Reference Case Growth Scenario
Table 6 High Growth Case Scenario
Table 7 Global Fiber Bars Revenue (USD Million) And CAGR (%) By Type (2021-2032)
Table 8 Global Fiber Bars Revenue (USD Million) And CAGR (%) By Application (2021-2032)
Table 9 Global Fiber Bars Revenue (USD Million) And CAGR (%) By Product (2021-2032)
Table 10 Global Fiber Bars Market Revenue (USD Million) By Regions (2021-2032)
Table 11 Global Fiber Bars Market Share (%) By Regions (2021-2032)
Table 12 North America Fiber Bars Revenue (USD Million) By Country (2021-2032)
Table 13 Europe Fiber Bars Revenue (USD Million) By Country (2021-2032)
Table 14 Asia Pacific Fiber Bars Revenue (USD Million) By Country (2021-2032)
Table 15 South America Fiber Bars Revenue (USD Million) By Country (2021-2032)
Table 16 Middle East and Africa Fiber Bars Revenue (USD Million) By Region (2021-2032)
Table 17 North America Fiber Bars Revenue (USD Million) By Type (2021-2032)
Table 18 North America Fiber Bars Revenue (USD Million) By Application (2021-2032)
Table 19 North America Fiber Bars Revenue (USD Million) By Product (2021-2032)
Table 20 Europe Fiber Bars Revenue (USD Million) By Type (2021-2032)
Table 21 Europe Fiber Bars Revenue (USD Million) By Application (2021-2032)
Table 22 Europe Fiber Bars Revenue (USD Million) By Product (2021-2032)
Table 23 Asia Pacific Fiber Bars Revenue (USD Million) By Type (2021-2032)
Table 24 Asia Pacific Fiber Bars Revenue (USD Million) By Application (2021-2032)
Table 25 Asia Pacific Fiber Bars Revenue (USD Million) By Product (2021-2032)
Table 26 South America Fiber Bars Revenue (USD Million) By Type (2021-2032)
Table 27 South America Fiber Bars Revenue (USD Million) By Application (2021-2032)
Table 28 South America Fiber Bars Revenue (USD Million) By Product (2021-2032)
Table 29 Middle East and Africa Fiber Bars Revenue (USD Million) By Type (2021-2032)
Table 30 Middle East and Africa Fiber Bars Revenue (USD Million) By Application (2021-2032)
Table 31 Middle East and Africa Fiber Bars Revenue (USD Million) By Product (2021-2032)
LIST OF FIGURES
Figure 1. Market Scope
Figure 2. Pricing Forecasts Per Unit, 2023- 2032
Figure 3. Porter’s Five Forces
Figure 4. Global Fiber Bars Market Revenue (USD Million) By Regions (2021-2032)
Figure 5. Global Fiber Bars Market Share (%) By Regions (2023)
Figure 6. North America Fiber Bars Revenue (USD Million) By Country (2021-2032)
Figure 7. United States Fiber Bars Revenue (USD Million) By Country (2021-2032)
Figure 8. Canada Fiber Bars Revenue (USD Million) By Country (2021-2032)
Figure 9. Mexico Fiber Bars Revenue (USD Million) By Country (2021-2032)
Figure 10. Europe Fiber Bars Revenue (USD Million) By Country (2021-2032)
Figure 11. Germany Fiber Bars Revenue (USD Million) By Country (2021-2032)
Figure 12. France Fiber Bars Revenue (USD Million) By Country (2021-2032)
Figure 13. United Kingdom Fiber Bars Revenue (USD Million) By Country (2021-2032)
Figure 14. Spain Fiber Bars Revenue (USD Million) By Country (2021-2032)
Figure 15. Italy Fiber Bars Revenue (USD Million) By Country (2021-2032)
Figure 16. Russia Fiber Bars Revenue (USD Million) By Country (2021-2032)
Figure 17. Rest of Europe Fiber Bars Revenue (USD Million) By Country (2021-2032)
Figure 11. Asia Pacific Fiber Bars Revenue (USD Million) By Country (2021-2032)
Figure 12. China Fiber Bars Revenue (USD Million) By Country (2021-2032)
Figure 13. Japan Fiber Bars Revenue (USD Million) By Country (2021-2032)
Figure 14. India Fiber Bars Revenue (USD Million) By Country (2021-2032)
Figure 15. South Korea Fiber Bars Revenue (USD Million) By Country (2021-2032)
Figure 16. Australia Fiber Bars Revenue (USD Million) By Country (2021-2032)
Figure 17. South East Asia Fiber Bars Revenue (USD Million) By Country (2021-2032)
Figure 18. South America Fiber Bars Revenue (USD Million) By Country (2021-2032)
Figure 19. Brazil Fiber Bars Revenue (USD Million) By Country (2021-2032)
Figure 20. Argentina Fiber Bars Revenue (USD Million) By Country (2021-2032)
Figure 21. Rest of Asia Pacific Fiber Bars Revenue (USD Million) By Country (2021-2032)
Figure 22. Middle East and Africa Fiber Bars Revenue (USD Million) By Region (2021-2032)
Figure 23. Saudi Arabia Fiber Bars Revenue (USD Million) By Region (2021-2032)
Figure 24. The UAE Fiber Bars Revenue (USD Million) By Region (2021-2032)
Figure 25. Rest of Middle East Fiber Bars Revenue (USD Million) By Region (2021-2032)
Figure 26. South Africa Fiber Bars Revenue (USD Million) By Region (2021-2032)
Figure 27. Africa Fiber Bars Revenue (USD Million) By Region (2021-2032)
Figure 28. North America Fiber Bars Revenue (USD Million) By Type (2021-2032)
Figure 29. North America Fiber Bars Revenue (USD Million) By Application (2021-2032)
Figure 30. North America Fiber Bars Revenue (USD Million) By Product (2021-2032)
Figure 31. Europe Fiber Bars Revenue (USD Million) By Type (2021-2032)
Figure 32. Europe Fiber Bars Revenue (USD Million) By Application (2021-2032)
Figure 33. Europe Fiber Bars Revenue (USD Million) By Product (2021-2032)
Figure 34. Asia Pacific Fiber Bars Revenue (USD Million) By Type (2021-2032)
Figure 35. Asia Pacific Fiber Bars Revenue (USD Million) By Application (2021-2032)
Figure 36. Asia Pacific Fiber Bars Revenue (USD Million) By Product (2021-2032)
Figure 37. South America Fiber Bars Revenue (USD Million) By Type (2021-2032)
Figure 38. South America Fiber Bars Revenue (USD Million) By Application (2021-2032)
Figure 39. South America Fiber Bars Revenue (USD Million) By Product (2021-2032)
Figure 40. Middle East and Africa Fiber Bars Revenue (USD Million) By Type (2021-2032)
Figure 41. Middle East and Africa Fiber Bars Revenue (USD Million) By Application (2021-2032)
Figure 42. Middle East and Africa Fiber Bars Revenue (USD Million) By Product (2021-2032)
By Type
Gluten Free
Non-GMO Free
Others
By Distribution Channel
Supermarkets/Hypermarkets
Convenience Stores
Specialty Stores
Online Sales Channel
Others
Countries Analyzed
North America (US, Canada, Mexico)
Europe (Germany, UK, France, Spain, Italy, Russia, Rest of Europe)
Asia Pacific (China, India, Japan, South Korea, Australia, South East Asia, Rest of Asia)
South America (Brazil, Argentina, Rest of South America)
Middle East and Africa (Saudi Arabia, UAE, Rest of Middle East, South Africa, Egypt, Rest of Africa)
