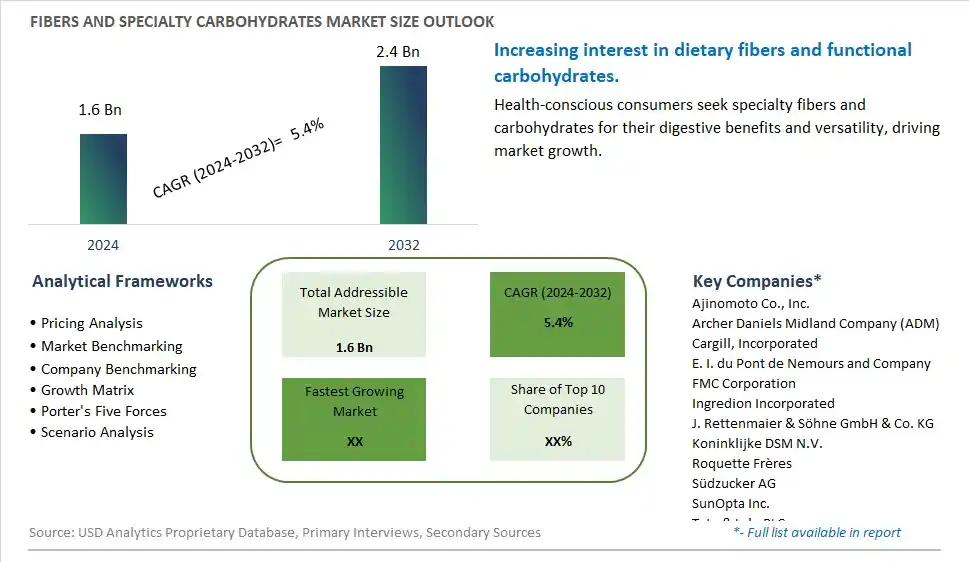
Global Fibers and Specialty Carbohydrates Market Size is valued at $1.6 Billion in 2024 and is forecast to register a growth rate (CAGR) of 5.4% to reach $2.4 Billion by 2032.
The global Fibers and Specialty Carbohydrates Market Comprehensive Study analyzes and forecasts the market size across 6 regions and 24 countries for diverse segments -By Type (Fibers, Specialty Carbohydrates), By Application (Functional Food, Functional Beverage, Dietary Supplements, Animal Nutrition, Personal Care)
An Introduction to Fibers and Specialty Carbohydrates Market
In 2024, the fibers and specialty carbohydrates market is thriving, fueled by the demand for functional ingredients that support digestive health and provide energy. Specialty fibers and carbohydrates, such as inulin, fructooligosaccharides, and resistant starch, are used in food and beverage products to enhance texture, sweetness, and nutritional profile. The market benefits from advancements in extraction and formulation technologies that preserve the functional properties of these ingredients. The trend towards clean label and natural ingredients is influencing product development. Increasing consumer interest in gut health and the popularity of functional foods are further propelling market growth.
Fibers and Specialty Carbohydrates Competitive Landscape
The market report analyses the leading companies in the industry including Ajinomoto Co., Inc., Archer Daniels Midland Company (ADM), Cargill, Incorporated, E. I. du Pont de Nemours and Company, FMC Corporation, Ingredion Incorporated, J. Rettenmaier & Söhne GmbH & Co. KG, Koninklijke DSM N.V., Roquette Frères, Südzucker AG, SunOpta Inc., Tate & Lyle PLC, and Others.
Fibers and Specialty Carbohydrates Market Dynamics
Fibers and Specialty Carbohydrates Market Trend: Growing Demand for Functional Foods and Dietary Supplements
The most prominent trend in the Fibers and Specialty Carbohydrates Market is the growing demand for functional foods and dietary supplements. Consumers are increasingly seeking products that offer specific health benefits, such as improved digestion and sustained energy, driving the demand for fibers and specialty carbohydrates. This trend is driven by the desire for convenient and health-enhancing food options.
Fibers and Specialty Carbohydrates Market Driver: Health Consciousness and Nutritional Benefits
A key driver in the Fibers and Specialty Carbohydrates Market is health consciousness and the recognized nutritional benefits of fibers and specialty carbohydrates. As more individuals focus on improving their diet and incorporating beneficial nutrients, there is a rising demand for products that provide dietary fiber and complex carbohydrates. This demand supports market growth as consumers seek functional and health-focused food ingredients.
Fibers and Specialty Carbohydrates Market Opportunity: Innovation in Food and Beverage Applications
One significant opportunity in the Fibers and Specialty Carbohydrates Market lies in innovation in food and beverage applications. Companies can develop new products that incorporate fibers and specialty carbohydrates into various formulations, such as snacks, beverages, and meal replacements, offering consumers convenient and health-focused options. By highlighting the benefits and versatility of these ingredients, manufacturers can attract a broader consumer base and drive market growth.
Fibers and Specialty Carbohydrates Market Share Analysis- Largest Segment by Type
In the Fibers and Specialty Carbohydrates Market, Fibers is the largest segment. Fibers, including soluble and insoluble types, are crucial for various applications in the food and beverage industry due to their health benefits and functional properties. They play a key role in digestive health, weight management, and blood sugar regulation, making them highly sought after in dietary supplements and functional foods. The widespread incorporation of fibers into everyday food products and their established health benefits drive their dominance in the market. Additionally, the growing consumer awareness of health and wellness further supports the large market share of fibers.
Fibers and Specialty Carbohydrates Market Share Analysis- Poised to Grow Fastest Over the Next Five Years by Application
The Functional Beverage application segment in the Fibers and Specialty Carbohydrates Market is poised to grow the fastest over the next five years. This growth is driven by the increasing consumer demand for health and wellness products, particularly beverages that offer functional benefits. Functional beverages, which include energy drinks, fortified waters, and enhanced teas, are gaining popularity for their added health benefits such as improved digestion, enhanced immunity, and better nutrient absorption. Specialty carbohydrates and fibers are integral in these formulations for their prebiotic effects and their ability to improve the texture and stability of the beverages. The rise in health-conscious consumers and the trend towards incorporating functional ingredients in daily diets further fuel this segment's rapid growth.
Fibers and Specialty Carbohydrates Market Segmentation
By Type
Fibers
Specialty Carbohydrates
By Application
Functional Food
Functional Beverage
Dietary Supplements
Animal Nutrition
Personal Care
Countries Analyzed
North America (US, Canada, Mexico)
Europe (Germany, UK, France, Spain, Italy, Russia, Rest of Europe)
Asia Pacific (China, India, Japan, South Korea, Australia, South East Asia, Rest of Asia)
South America (Brazil, Argentina, Rest of South America)
Middle East and Africa (Saudi Arabia, UAE, Rest of Middle East, South Africa, Egypt, Rest of Africa)
Fibers and Specialty Carbohydrates Companies Profiled in the Study
Ajinomoto Co., Inc.
Archer Daniels Midland Company (ADM)
Cargill, Incorporated
E. I. du Pont de Nemours and Company
FMC Corporation
Ingredion Incorporated
J. Rettenmaier & Söhne GmbH & Co. KG
Koninklijke DSM N.V.
Roquette Frères
Südzucker AG
SunOpta Inc.
Tate & Lyle PLC
*- List Not Exhaustive
Chapter 1. TABLE OF CONTENTS
Chapter 2. Introduction to Fibers and Specialty Carbohydrates Market
2.1. Market Overview
2.2. Key Statistics and Report Highlights
2.3. Scope of the Comprehensive Study
2.3.1. Market Definition
2.3.2 Countries and Regions Covered
2.3.3 Research Objective
2.3.4 Units, Currency, and Conversions
2.3.5 Industry Value Chain
2.4. Key Market Segments
2.5. Key Companies
2.6. Study Period
Chapter 3. Strategic Analysis Review
3.1. Fibers and Specialty Carbohydrates Pricing Analysis and Forecast
3.2. Porter’s Five Forces
3.3. Market Ecosystem
3.4. SWOT Analysis
3.5. Regulatory Scenario
3.3. Effects of Inflation, Russia-Ukraine War, moderating economic growth, and other macroeconomic factors
Chapter 4. Competitive Landscape
4.1. Market Share Analysis
4.1.1. Global Fibers and Specialty Carbohydrates Market Share by Company, 2023
4.1.2. Product Offerings of Leading Fibers and Specialty Carbohydrates Companies
4.2. Market Entropy
4.2.1. New Product Launches in the Industry
4.2.2. Mergers, Acquisitions, Joint ventures, and Partnerships
4.3. Key Strategies and Best Practices
Chapter 5. Global Market Projections: Best, Reference, and Low Case Scenarios
5.1. Growth Analysis- Case Scenario Definitions
5.2. Low Growth Case Scenario Forecasts
5.3. Reference Growth Case Scenario Forecasts
5.4. High Growth Case Scenario Forecasts
Chapter 6. Market Dynamics
6.1. Fibers and Specialty Carbohydrates Market Drivers
6.2. Fibers and Specialty Carbohydrates Market Challenges
6.6. Fibers and Specialty Carbohydrates Market Opportunities
6.4. Fibers and Specialty Carbohydrates Market Trends
Chapter 7. Global Fibers and Specialty Carbohydrates Market Outlook Trends
7.1. Global Fibers and Specialty Carbohydrates Revenue (USD Million) and CAGR (%) by Type (2021-2032)
7.2. Global Fibers and Specialty Carbohydrates Revenue (USD Million) and CAGR (%) by Application (2021-2032)
7.3. Global Fibers and Specialty Carbohydrates Revenue (USD Million) and CAGR (%) by Product (2021-2032)
By Type
Fibers
Specialty Carbohydrates
By Application
Functional Food
Functional Beverage
Dietary Supplements
Animal Nutrition
Personal Care
Chapter 8. Global Fibers and Specialty Carbohydrates Regional Analysis and Outlook
8.1. Global Fibers and Specialty Carbohydrates Revenue (USD Million) By Regions (2021- 2032)
8.2. North America Fibers and Specialty Carbohydrates Revenue (USD Million) by Country (2021-2032)
8.2.1. United States Fibers and Specialty Carbohydrates Regional Analysis and Outlook
8.2.2. Canada Fibers and Specialty Carbohydrates Regional Analysis and Outlook
8.2.3. Mexico Fibers and Specialty Carbohydrates Regional Analysis and Outlook
8.3. Europe Fibers and Specialty Carbohydrates Revenue (USD Million), by Country (2021-2032)
8.3.1. Germany Fibers and Specialty Carbohydrates Regional Analysis and Outlook
8.3.2. France Fibers and Specialty Carbohydrates Regional Analysis and Outlook
8.3.3. United Kingdom Fibers and Specialty Carbohydrates Regional Analysis and Outlook
8.3.4. Spain Fibers and Specialty Carbohydrates Regional Analysis and Outlook
8.3.5. Italy Fibers and Specialty Carbohydrates Regional Analysis and Outlook
8.3.6. Russia Fibers and Specialty Carbohydrates Regional Analysis and Outlook
8.3.7. Rest of Europe Fibers and Specialty Carbohydrates Regional Analysis and Outlook
8.4. Asia Pacific Fibers and Specialty Carbohydrates Revenue (USD Million) by Country (2021-2032)
8.4.1. China Fibers and Specialty Carbohydrates Regional Analysis and Outlook
8.4.2. Japan Fibers and Specialty Carbohydrates Regional Analysis and Outlook
8.4.3. India Fibers and Specialty Carbohydrates Regional Analysis and Outlook
8.4.4. South Korea Fibers and Specialty Carbohydrates Regional Analysis and Outlook
8.4.5. Australia Fibers and Specialty Carbohydrates Regional Analysis and Outlook
8.4.6. South East Asia Fibers and Specialty Carbohydrates Regional Analysis and Outlook
8.4.7. Rest of Asia Pacific Fibers and Specialty Carbohydrates Regional Analysis and Outlook
8.5. South America Fibers and Specialty Carbohydrates Revenue (USD Million), by Country (2021-2032)
8.5.1. Brazil Fibers and Specialty Carbohydrates Regional Analysis and Outlook
8.5.2. Argentina Fibers and Specialty Carbohydrates Regional Analysis and Outlook
8.5.3. Rest of South America Fibers and Specialty Carbohydrates Regional Analysis and Outlook
8.6. Middle East and Africa Fibers and Specialty Carbohydrates Revenue (USD Million) by Country (2021-2032)
8.6.1. Middle East Fibers and Specialty Carbohydrates Regional Analysis and Outlook
8.6.2. Africa Fibers and Specialty Carbohydrates Regional Analysis and Outlook
Chapter 9. North America Fibers and Specialty Carbohydrates Analysis and Outlook
9.1. North America Fibers and Specialty Carbohydrates Revenue (USD Million) by Segments (2021-2032)
9.1.1. North America Fibers and Specialty Carbohydrates Revenue (USD Million) by Type (2021-2032)
9.1.2. North America Fibers and Specialty Carbohydrates Revenue (USD Million) by Application (2021-2032)
9.1.3. North America Fibers and Specialty Carbohydrates Revenue (USD Million) by Product (2021-2032)
By Type
Fibers
Specialty Carbohydrates
By Application
Functional Food
Functional Beverage
Dietary Supplements
Animal Nutrition
Personal Care
Chapter 10. Europe Fibers and Specialty Carbohydrates Analysis and Outlook
10.1. Europe Fibers and Specialty Carbohydrates Revenue (USD Million), by Segments (USD Million) (2021-2032)
10.1.1. Europe Fibers and Specialty Carbohydrates Revenue (USD Million) by Type (2021-2032)
10.1.2. Europe Fibers and Specialty Carbohydrates Revenue (USD Million) by Application (2021-2032)
10.1.3. Europe Fibers and Specialty Carbohydrates Revenue (USD Million) by Product (2021-2032)
By Type
Fibers
Specialty Carbohydrates
By Application
Functional Food
Functional Beverage
Dietary Supplements
Animal Nutrition
Personal Care
Chapter 11. Asia Pacific Fibers and Specialty Carbohydrates Analysis and Outlook
11.1. Asia Pacific Fibers and Specialty Carbohydrates Revenue (USD Million), and Revenue (USD Million) by Segments (2021-2032)
11.1.1. Asia Pacific Fibers and Specialty Carbohydrates Revenue (USD Million) by Type (2021-2032)
11.1.2. Asia Pacific Fibers and Specialty Carbohydrates Revenue (USD Million) by Application (2021-2032)
11.1.3. Asia Pacific Fibers and Specialty Carbohydrates Revenue (USD Million) by Product (2021-2032)
By Type
Fibers
Specialty Carbohydrates
By Application
Functional Food
Functional Beverage
Dietary Supplements
Animal Nutrition
Personal Care
Chapter 12. South America Fibers and Specialty Carbohydrates Analysis and Outlook
12.1. South America Fibers and Specialty Carbohydrates Revenue (USD Million), by Segments (2021-2032)
12.1.1. South America Fibers and Specialty Carbohydrates Revenue (USD Million) by Type (2021-2032)
12.1.2. South America Fibers and Specialty Carbohydrates Revenue (USD Million) by Application (2021-2032)
12.1.3. South America Fibers and Specialty Carbohydrates Revenue (USD Million) by Product (2021-2032)
By Type
Fibers
Specialty Carbohydrates
By Application
Functional Food
Functional Beverage
Dietary Supplements
Animal Nutrition
Personal Care
Chapter 13. Middle East and Africa Fibers and Specialty Carbohydrates Analysis and Outlook
13.1. Middle East and Africa Fibers and Specialty Carbohydrates Revenue (USD Million), by Segments (2021-2032)
13.1.1. Middle East and Africa Fibers and Specialty Carbohydrates Revenue (USD Million) by Type (2021-2032)
13.1.2. Middle East and Africa Fibers and Specialty Carbohydrates Revenue (USD Million) by Application (2021-2032)
13.1.3. Middle East and Africa Fibers and Specialty Carbohydrates Revenue (USD Million) by Product (2021-2032)
By Type
Fibers
Specialty Carbohydrates
By Application
Functional Food
Functional Beverage
Dietary Supplements
Animal Nutrition
Personal Care
Chapter 14. Fibers and Specialty Carbohydrates Company Profiles
14.1 Business Overview
14.2 Product Profiles
14.3 SWOT Profiles
14.5 Recent Developments
14.6 Financial Profile
List of Companies
Ajinomoto Co., Inc.
Archer Daniels Midland Company (ADM)
Cargill, Incorporated
E. I. du Pont de Nemours and Company
FMC Corporation
Ingredion Incorporated
J. Rettenmaier & Söhne GmbH & Co. KG
Koninklijke DSM N.V.
Roquette Frères
Südzucker AG
SunOpta Inc.
Tate & Lyle PLC
15. Methodology and Data Sources
15.1 Customization Offerings
15.2 Subscription Services
15.3 Related Reports
15.4 Publisher Expertise
LIST OF TABLES
Table 1 Market Segmentation Analysis
Table 2 Global Fibers and Specialty Carbohydrates Market Share of Leading Companies, 2023
Table 3 Product Offerings of Leading Companies
Table 4 Low Growth Scenario Forecasts
Table 5 Reference Case Growth Scenario
Table 6 High Growth Case Scenario
Table 7 Global Fibers and Specialty Carbohydrates Revenue (USD Million) And CAGR (%) By Type (2021-2032)
Table 8 Global Fibers and Specialty Carbohydrates Revenue (USD Million) And CAGR (%) By Application (2021-2032)
Table 9 Global Fibers and Specialty Carbohydrates Revenue (USD Million) And CAGR (%) By Product (2021-2032)
Table 10 Global Fibers and Specialty Carbohydrates Market Revenue (USD Million) By Regions (2021-2032)
Table 11 Global Fibers and Specialty Carbohydrates Market Share (%) By Regions (2021-2032)
Table 12 North America Fibers and Specialty Carbohydrates Revenue (USD Million) By Country (2021-2032)
Table 13 Europe Fibers and Specialty Carbohydrates Revenue (USD Million) By Country (2021-2032)
Table 14 Asia Pacific Fibers and Specialty Carbohydrates Revenue (USD Million) By Country (2021-2032)
Table 15 South America Fibers and Specialty Carbohydrates Revenue (USD Million) By Country (2021-2032)
Table 16 Middle East and Africa Fibers and Specialty Carbohydrates Revenue (USD Million) By Region (2021-2032)
Table 17 North America Fibers and Specialty Carbohydrates Revenue (USD Million) By Type (2021-2032)
Table 18 North America Fibers and Specialty Carbohydrates Revenue (USD Million) By Application (2021-2032)
Table 19 North America Fibers and Specialty Carbohydrates Revenue (USD Million) By Product (2021-2032)
Table 20 Europe Fibers and Specialty Carbohydrates Revenue (USD Million) By Type (2021-2032)
Table 21 Europe Fibers and Specialty Carbohydrates Revenue (USD Million) By Application (2021-2032)
Table 22 Europe Fibers and Specialty Carbohydrates Revenue (USD Million) By Product (2021-2032)
Table 23 Asia Pacific Fibers and Specialty Carbohydrates Revenue (USD Million) By Type (2021-2032)
Table 24 Asia Pacific Fibers and Specialty Carbohydrates Revenue (USD Million) By Application (2021-2032)
Table 25 Asia Pacific Fibers and Specialty Carbohydrates Revenue (USD Million) By Product (2021-2032)
Table 26 South America Fibers and Specialty Carbohydrates Revenue (USD Million) By Type (2021-2032)
Table 27 South America Fibers and Specialty Carbohydrates Revenue (USD Million) By Application (2021-2032)
Table 28 South America Fibers and Specialty Carbohydrates Revenue (USD Million) By Product (2021-2032)
Table 29 Middle East and Africa Fibers and Specialty Carbohydrates Revenue (USD Million) By Type (2021-2032)
Table 30 Middle East and Africa Fibers and Specialty Carbohydrates Revenue (USD Million) By Application (2021-2032)
Table 31 Middle East and Africa Fibers and Specialty Carbohydrates Revenue (USD Million) By Product (2021-2032)
LIST OF FIGURES
Figure 1. Market Scope
Figure 2. Pricing Forecasts Per Unit, 2023- 2032
Figure 3. Porter’s Five Forces
Figure 4. Global Fibers and Specialty Carbohydrates Market Revenue (USD Million) By Regions (2021-2032)
Figure 5. Global Fibers and Specialty Carbohydrates Market Share (%) By Regions (2023)
Figure 6. North America Fibers and Specialty Carbohydrates Revenue (USD Million) By Country (2021-2032)
Figure 7. United States Fibers and Specialty Carbohydrates Revenue (USD Million) By Country (2021-2032)
Figure 8. Canada Fibers and Specialty Carbohydrates Revenue (USD Million) By Country (2021-2032)
Figure 9. Mexico Fibers and Specialty Carbohydrates Revenue (USD Million) By Country (2021-2032)
Figure 10. Europe Fibers and Specialty Carbohydrates Revenue (USD Million) By Country (2021-2032)
Figure 11. Germany Fibers and Specialty Carbohydrates Revenue (USD Million) By Country (2021-2032)
Figure 12. France Fibers and Specialty Carbohydrates Revenue (USD Million) By Country (2021-2032)
Figure 13. United Kingdom Fibers and Specialty Carbohydrates Revenue (USD Million) By Country (2021-2032)
Figure 14. Spain Fibers and Specialty Carbohydrates Revenue (USD Million) By Country (2021-2032)
Figure 15. Italy Fibers and Specialty Carbohydrates Revenue (USD Million) By Country (2021-2032)
Figure 16. Russia Fibers and Specialty Carbohydrates Revenue (USD Million) By Country (2021-2032)
Figure 17. Rest of Europe Fibers and Specialty Carbohydrates Revenue (USD Million) By Country (2021-2032)
Figure 11. Asia Pacific Fibers and Specialty Carbohydrates Revenue (USD Million) By Country (2021-2032)
Figure 12. China Fibers and Specialty Carbohydrates Revenue (USD Million) By Country (2021-2032)
Figure 13. Japan Fibers and Specialty Carbohydrates Revenue (USD Million) By Country (2021-2032)
Figure 14. India Fibers and Specialty Carbohydrates Revenue (USD Million) By Country (2021-2032)
Figure 15. South Korea Fibers and Specialty Carbohydrates Revenue (USD Million) By Country (2021-2032)
Figure 16. Australia Fibers and Specialty Carbohydrates Revenue (USD Million) By Country (2021-2032)
Figure 17. South East Asia Fibers and Specialty Carbohydrates Revenue (USD Million) By Country (2021-2032)
Figure 18. South America Fibers and Specialty Carbohydrates Revenue (USD Million) By Country (2021-2032)
Figure 19. Brazil Fibers and Specialty Carbohydrates Revenue (USD Million) By Country (2021-2032)
Figure 20. Argentina Fibers and Specialty Carbohydrates Revenue (USD Million) By Country (2021-2032)
Figure 21. Rest of Asia Pacific Fibers and Specialty Carbohydrates Revenue (USD Million) By Country (2021-2032)
Figure 22. Middle East and Africa Fibers and Specialty Carbohydrates Revenue (USD Million) By Region (2021-2032)
Figure 23. Saudi Arabia Fibers and Specialty Carbohydrates Revenue (USD Million) By Region (2021-2032)
Figure 24. The UAE Fibers and Specialty Carbohydrates Revenue (USD Million) By Region (2021-2032)
Figure 25. Rest of Middle East Fibers and Specialty Carbohydrates Revenue (USD Million) By Region (2021-2032)
Figure 26. South Africa Fibers and Specialty Carbohydrates Revenue (USD Million) By Region (2021-2032)
Figure 27. Africa Fibers and Specialty Carbohydrates Revenue (USD Million) By Region (2021-2032)
Figure 28. North America Fibers and Specialty Carbohydrates Revenue (USD Million) By Type (2021-2032)
Figure 29. North America Fibers and Specialty Carbohydrates Revenue (USD Million) By Application (2021-2032)
Figure 30. North America Fibers and Specialty Carbohydrates Revenue (USD Million) By Product (2021-2032)
Figure 31. Europe Fibers and Specialty Carbohydrates Revenue (USD Million) By Type (2021-2032)
Figure 32. Europe Fibers and Specialty Carbohydrates Revenue (USD Million) By Application (2021-2032)
Figure 33. Europe Fibers and Specialty Carbohydrates Revenue (USD Million) By Product (2021-2032)
Figure 34. Asia Pacific Fibers and Specialty Carbohydrates Revenue (USD Million) By Type (2021-2032)
Figure 35. Asia Pacific Fibers and Specialty Carbohydrates Revenue (USD Million) By Application (2021-2032)
Figure 36. Asia Pacific Fibers and Specialty Carbohydrates Revenue (USD Million) By Product (2021-2032)
Figure 37. South America Fibers and Specialty Carbohydrates Revenue (USD Million) By Type (2021-2032)
Figure 38. South America Fibers and Specialty Carbohydrates Revenue (USD Million) By Application (2021-2032)
Figure 39. South America Fibers and Specialty Carbohydrates Revenue (USD Million) By Product (2021-2032)
Figure 40. Middle East and Africa Fibers and Specialty Carbohydrates Revenue (USD Million) By Type (2021-2032)
Figure 41. Middle East and Africa Fibers and Specialty Carbohydrates Revenue (USD Million) By Application (2021-2032)
Figure 42. Middle East and Africa Fibers and Specialty Carbohydrates Revenue (USD Million) By Product (2021-2032)
By Type
Fibers
Specialty Carbohydrates
By Application
Functional Food
Functional Beverage
Dietary Supplements
Animal Nutrition
Personal Care
Countries Analyzed
North America (US, Canada, Mexico)
Europe (Germany, UK, France, Spain, Italy, Russia, Rest of Europe)
Asia Pacific (China, India, Japan, South Korea, Australia, South East Asia, Rest of Asia)
South America (Brazil, Argentina, Rest of South America)
Middle East and Africa (Saudi Arabia, UAE, Rest of Middle East, South Africa, Egypt, Rest of Africa)
