Global Fig Ingredient Market Size is valued at $186.3 Million in 2024 and is forecast to register a growth rate (CAGR) of 7.9% to reach $342.3 Million by 2032.
The global Fig Ingredient Market Comprehensive Study analyzes and forecasts the market size across 6 regions and 24 countries for diverse segments -By Form (Powder, Liquid), By End-User (Pharmaceuticals, Food And Beverage, Dietary Supplements, Cosmetics, Bakery and Confectionary, Dairy Products, Others)
An Introduction to Fig Ingredient Market
In 2024, the Fig Ingredient market is witnessing robust growth, fueled by the rising demand for natural and nutritious food ingredients. Fig ingredients, including fig pastes, powders, and extracts, are popular for their sweet flavor and health benefits, such as high fiber and antioxidant content. The market benefits from advancements in food processing and preservation technologies, the growing trend of clean label and natural ingredients, and the expansion of the functional food and beverage sectors. Additionally, the increasing awareness of the health benefits of figs is contributing to market growth.
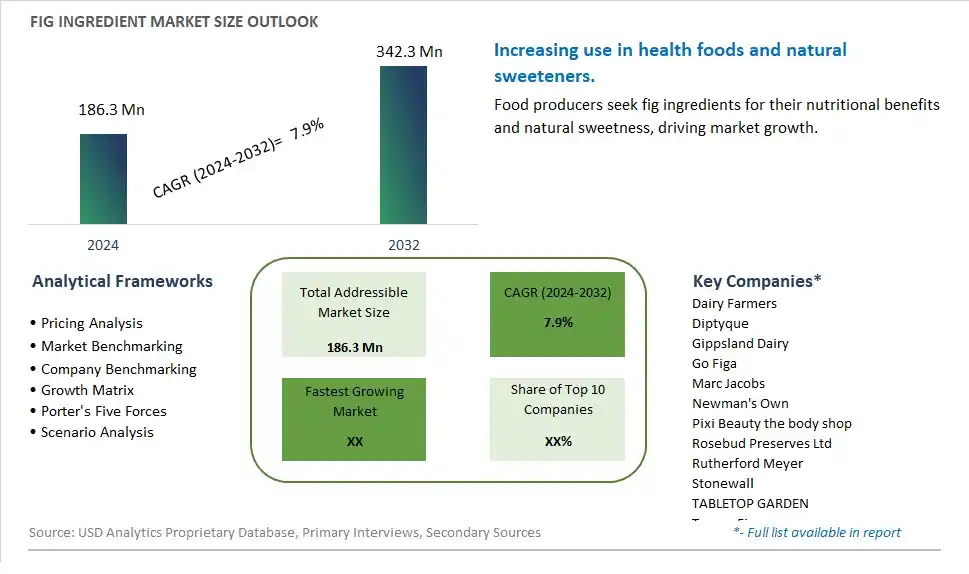
Fig Ingredient Competitive Landscape
The market report analyses the leading companies in the industry including Dairy Farmers, Diptyque, Gippsland Dairy, Go Figa, Marc Jacobs, Newman's Own, Pixi Beauty the body shop, Rosebud Preserves Ltd, Rutherford Meyer, Stonewall, TABLETOP GARDEN, Tuscan Fig, and Others.
Fig Ingredient Market Dynamics
Fig Ingredient Market Trend: Increasing Demand for Natural and Organic Ingredients
The fig ingredient market is experiencing a significant trend towards the increasing demand for natural and organic ingredients. Consumers are becoming more health-conscious and are actively seeking out products made from natural and minimally processed ingredients. Figs, known for their rich nutritional profile and health benefits, are gaining popularity in various food and beverage applications. This trend is driven by a broader movement towards clean eating and transparency in food sourcing. The versatility of fig ingredients in products such as snacks, bakery items, and health foods further enhances their appeal, making them a preferred choice for both manufacturers and consumers.
Fig Ingredient Market Driver: Rising Popularity of Functional Foods
The rising popularity of functional foods is a major driver for the fig ingredient market. As consumers increasingly look for foods that offer health benefits beyond basic nutrition, figs, with their high fiber content, antioxidants, and essential vitamins and minerals, are being incorporated into a variety of functional food products. The growing awareness of the role of diet in managing health and preventing diseases is encouraging the consumption of fig-based products. This driver is further supported by scientific research and marketing efforts highlighting the health benefits of figs, including improved digestion, heart health, and energy levels.
Fig Ingredient Market Opportunity: Innovation in Product Development
There is a significant opportunity for growth in the fig ingredient market through innovation in product development. Companies can explore new and creative ways to incorporate fig ingredients into a wide range of products, such as energy bars, smoothies, dairy alternatives, and plant-based snacks. Additionally, developing fig-based products that cater to specific dietary needs, such as gluten-free, vegan, and low-sugar options, can attract health-conscious consumers and those with dietary restrictions. By investing in research and development to create unique and appealing fig ingredient products, businesses can differentiate themselves in the market and capture a larger share of the growing demand for natural and functional foods.
Fig Ingredient Market Share Analysis: Powder segment generated the highest revenue share in the industry
Powder is the largest segment in the Fig Ingredient Market by Form. This segment's prominence is driven by the versatility and ease of use that powdered fig ingredients offer across various industries. Fig powder is a concentrated form of the fruit that retains its nutritional benefits, including high fiber content, vitamins, and minerals, making it a popular choice for health-focused applications. It can be easily incorporated into a wide range of products, from bakery items and confectionery to dietary supplements and functional foods. The long shelf life and stability of fig powder compared to liquid forms make it more convenient for storage and transportation, further enhancing its appeal. Additionally, fig powder's ability to blend seamlessly with other ingredients without altering the texture of the final product makes it an essential ingredient in many formulations, supporting its dominance in the market.
Fig Ingredient Market Share Analysis: Food and Beverage is the fastest growing segment over the forecast period to 2032
The Food and Beverage segment is projected to be the fastest-growing end-user in the Fig Ingredient Market by 2032. This rapid growth is fueled by the increasing consumer demand for natural and healthy ingredients in their diets. Figs are prized for their rich nutritional profile, including high levels of dietary fiber, antioxidants, and essential vitamins and minerals, making them an attractive addition to a variety of food and beverage products. The trend towards clean-label and plant-based foods is encouraging manufacturers to incorporate fig ingredients into their offerings, such as energy bars, smoothies, cereals, and health drinks. Further, the versatility of figs in both sweet and savory applications allows for innovative product development across different food categories. As consumers become more health-conscious and seek functional foods that provide added health benefits, the incorporation of fig ingredients in the food and beverage industry is expected to grow significantly, driving the rapid expansion of this segment.
Fig Ingredient Market Segmentation
By Form
Powder
Liquid
By End-User
Pharmaceuticals
Food And Beverage
Dietary Supplements
Cosmetics
Bakery and Confectionary
Dairy Products
Others
Countries Analyzed
North America (US, Canada, Mexico)
Europe (Germany, UK, France, Spain, Italy, Russia, Rest of Europe)
Asia Pacific (China, India, Japan, South Korea, Australia, South East Asia, Rest of Asia)
South America (Brazil, Argentina, Rest of South America)
Middle East and Africa (Saudi Arabia, UAE, Rest of Middle East, South Africa, Egypt, Rest of Africa)
Fig Ingredient Companies Profiled in the Study
Dairy Farmers
Diptyque
Gippsland Dairy
Go Figa
Marc Jacobs
Newman's Own
Pixi Beauty the body shop
Rosebud Preserves Ltd
Rutherford Meyer
Stonewall
TABLETOP GARDEN
Tuscan Fig
*- List Not Exhaustive
Chapter 1. TABLE OF CONTENTS
Chapter 2. Introduction to Fig Ingredient Market
2.1. Market Overview
2.2. Key Statistics and Report Highlights
2.3. Scope of the Comprehensive Study
2.3.1. Market Definition
2.3.2 Countries and Regions Covered
2.3.3 Research Objective
2.3.4 Units, Currency, and Conversions
2.3.5 Industry Value Chain
2.4. Key Market Segments
2.5. Key Companies
2.6. Study Period
Chapter 3. Strategic Analysis Review
3.1. Fig Ingredient Pricing Analysis and Forecast
3.2. Porter’s Five Forces
3.3. Market Ecosystem
3.4. SWOT Analysis
3.5. Regulatory Scenario
3.3. Effects of Inflation, Russia-Ukraine War, moderating economic growth, and other macroeconomic factors
Chapter 4. Competitive Landscape
4.1. Market Share Analysis
4.1.1. Global Fig Ingredient Market Share by Company, 2023
4.1.2. Product Offerings of Leading Fig Ingredient Companies
4.2. Market Entropy
4.2.1. New Product Launches in the Industry
4.2.2. Mergers, Acquisitions, Joint ventures, and Partnerships
4.3. Key Strategies and Best Practices
Chapter 5. Global Market Projections: Best, Reference, and Low Case Scenarios
5.1. Growth Analysis- Case Scenario Definitions
5.2. Low Growth Case Scenario Forecasts
5.3. Reference Growth Case Scenario Forecasts
5.4. High Growth Case Scenario Forecasts
Chapter 6. Market Dynamics
6.1. Fig Ingredient Market Drivers
6.2. Fig Ingredient Market Challenges
6.6. Fig Ingredient Market Opportunities
6.4. Fig Ingredient Market Trends
Chapter 7. Global Fig Ingredient Market Outlook Trends
7.1. Global Fig Ingredient Revenue (USD Million) and CAGR (%) by Type (2021-2032)
7.2. Global Fig Ingredient Revenue (USD Million) and CAGR (%) by Application (2021-2032)
7.3. Global Fig Ingredient Revenue (USD Million) and CAGR (%) by Product (2021-2032)
By Form
Powder
Liquid
By End-User
Pharmaceuticals
Food And Beverage
Dietary Supplements
Cosmetics
Bakery and Confectionary
Dairy Products
Others
Chapter 8. Global Fig Ingredient Regional Analysis and Outlook
8.1. Global Fig Ingredient Revenue (USD Million) By Regions (2021- 2032)
8.2. North America Fig Ingredient Revenue (USD Million) by Country (2021-2032)
8.2.1. United States Fig Ingredient Regional Analysis and Outlook
8.2.2. Canada Fig Ingredient Regional Analysis and Outlook
8.2.3. Mexico Fig Ingredient Regional Analysis and Outlook
8.3. Europe Fig Ingredient Revenue (USD Million), by Country (2021-2032)
8.3.1. Germany Fig Ingredient Regional Analysis and Outlook
8.3.2. France Fig Ingredient Regional Analysis and Outlook
8.3.3. United Kingdom Fig Ingredient Regional Analysis and Outlook
8.3.4. Spain Fig Ingredient Regional Analysis and Outlook
8.3.5. Italy Fig Ingredient Regional Analysis and Outlook
8.3.6. Russia Fig Ingredient Regional Analysis and Outlook
8.3.7. Rest of Europe Fig Ingredient Regional Analysis and Outlook
8.4. Asia Pacific Fig Ingredient Revenue (USD Million) by Country (2021-2032)
8.4.1. China Fig Ingredient Regional Analysis and Outlook
8.4.2. Japan Fig Ingredient Regional Analysis and Outlook
8.4.3. India Fig Ingredient Regional Analysis and Outlook
8.4.4. South Korea Fig Ingredient Regional Analysis and Outlook
8.4.5. Australia Fig Ingredient Regional Analysis and Outlook
8.4.6. South East Asia Fig Ingredient Regional Analysis and Outlook
8.4.7. Rest of Asia Pacific Fig Ingredient Regional Analysis and Outlook
8.5. South America Fig Ingredient Revenue (USD Million), by Country (2021-2032)
8.5.1. Brazil Fig Ingredient Regional Analysis and Outlook
8.5.2. Argentina Fig Ingredient Regional Analysis and Outlook
8.5.3. Rest of South America Fig Ingredient Regional Analysis and Outlook
8.6. Middle East and Africa Fig Ingredient Revenue (USD Million) by Country (2021-2032)
8.6.1. Middle East Fig Ingredient Regional Analysis and Outlook
8.6.2. Africa Fig Ingredient Regional Analysis and Outlook
Chapter 9. North America Fig Ingredient Analysis and Outlook
9.1. North America Fig Ingredient Revenue (USD Million) by Segments (2021-2032)
9.1.1. North America Fig Ingredient Revenue (USD Million) by Type (2021-2032)
9.1.2. North America Fig Ingredient Revenue (USD Million) by Application (2021-2032)
9.1.3. North America Fig Ingredient Revenue (USD Million) by Product (2021-2032)
By Form
Powder
Liquid
By End-User
Pharmaceuticals
Food And Beverage
Dietary Supplements
Cosmetics
Bakery and Confectionary
Dairy Products
Others
Chapter 10. Europe Fig Ingredient Analysis and Outlook
10.1. Europe Fig Ingredient Revenue (USD Million), by Segments (USD Million) (2021-2032)
10.1.1. Europe Fig Ingredient Revenue (USD Million) by Type (2021-2032)
10.1.2. Europe Fig Ingredient Revenue (USD Million) by Application (2021-2032)
10.1.3. Europe Fig Ingredient Revenue (USD Million) by Product (2021-2032)
By Form
Powder
Liquid
By End-User
Pharmaceuticals
Food And Beverage
Dietary Supplements
Cosmetics
Bakery and Confectionary
Dairy Products
Others
Chapter 11. Asia Pacific Fig Ingredient Analysis and Outlook
11.1. Asia Pacific Fig Ingredient Revenue (USD Million), and Revenue (USD Million) by Segments (2021-2032)
11.1.1. Asia Pacific Fig Ingredient Revenue (USD Million) by Type (2021-2032)
11.1.2. Asia Pacific Fig Ingredient Revenue (USD Million) by Application (2021-2032)
11.1.3. Asia Pacific Fig Ingredient Revenue (USD Million) by Product (2021-2032)
By Form
Powder
Liquid
By End-User
Pharmaceuticals
Food And Beverage
Dietary Supplements
Cosmetics
Bakery and Confectionary
Dairy Products
Others
Chapter 12. South America Fig Ingredient Analysis and Outlook
12.1. South America Fig Ingredient Revenue (USD Million), by Segments (2021-2032)
12.1.1. South America Fig Ingredient Revenue (USD Million) by Type (2021-2032)
12.1.2. South America Fig Ingredient Revenue (USD Million) by Application (2021-2032)
12.1.3. South America Fig Ingredient Revenue (USD Million) by Product (2021-2032)
By Form
Powder
Liquid
By End-User
Pharmaceuticals
Food And Beverage
Dietary Supplements
Cosmetics
Bakery and Confectionary
Dairy Products
Others
Chapter 13. Middle East and Africa Fig Ingredient Analysis and Outlook
13.1. Middle East and Africa Fig Ingredient Revenue (USD Million), by Segments (2021-2032)
13.1.1. Middle East and Africa Fig Ingredient Revenue (USD Million) by Type (2021-2032)
13.1.2. Middle East and Africa Fig Ingredient Revenue (USD Million) by Application (2021-2032)
13.1.3. Middle East and Africa Fig Ingredient Revenue (USD Million) by Product (2021-2032)
By Form
Powder
Liquid
By End-User
Pharmaceuticals
Food And Beverage
Dietary Supplements
Cosmetics
Bakery and Confectionary
Dairy Products
Others
Chapter 14. Fig Ingredient Company Profiles
14.1 Business Overview
14.2 Product Profiles
14.3 SWOT Profiles
14.5 Recent Developments
14.6 Financial Profile
List of Companies
Dairy Farmers
Diptyque
Gippsland Dairy
Go Figa
Marc Jacobs
Newman's Own
Pixi Beauty the body shop
Rosebud Preserves Ltd
Rutherford Meyer
Stonewall
TABLETOP GARDEN
Tuscan Fig
15. Methodology and Data Sources
15.1 Customization Offerings
15.2 Subscription Services
15.3 Related Reports
15.4 Publisher Expertise
LIST OF TABLES
Table 1 Market Segmentation Analysis
Table 2 Global Fig Ingredient Market Share of Leading Companies, 2023
Table 3 Product Offerings of Leading Companies
Table 4 Low Growth Scenario Forecasts
Table 5 Reference Case Growth Scenario
Table 6 High Growth Case Scenario
Table 7 Global Fig Ingredient Revenue (USD Million) And CAGR (%) By Type (2021-2032)
Table 8 Global Fig Ingredient Revenue (USD Million) And CAGR (%) By Application (2021-2032)
Table 9 Global Fig Ingredient Revenue (USD Million) And CAGR (%) By Product (2021-2032)
Table 10 Global Fig Ingredient Market Revenue (USD Million) By Regions (2021-2032)
Table 11 Global Fig Ingredient Market Share (%) By Regions (2021-2032)
Table 12 North America Fig Ingredient Revenue (USD Million) By Country (2021-2032)
Table 13 Europe Fig Ingredient Revenue (USD Million) By Country (2021-2032)
Table 14 Asia Pacific Fig Ingredient Revenue (USD Million) By Country (2021-2032)
Table 15 South America Fig Ingredient Revenue (USD Million) By Country (2021-2032)
Table 16 Middle East and Africa Fig Ingredient Revenue (USD Million) By Region (2021-2032)
Table 17 North America Fig Ingredient Revenue (USD Million) By Type (2021-2032)
Table 18 North America Fig Ingredient Revenue (USD Million) By Application (2021-2032)
Table 19 North America Fig Ingredient Revenue (USD Million) By Product (2021-2032)
Table 20 Europe Fig Ingredient Revenue (USD Million) By Type (2021-2032)
Table 21 Europe Fig Ingredient Revenue (USD Million) By Application (2021-2032)
Table 22 Europe Fig Ingredient Revenue (USD Million) By Product (2021-2032)
Table 23 Asia Pacific Fig Ingredient Revenue (USD Million) By Type (2021-2032)
Table 24 Asia Pacific Fig Ingredient Revenue (USD Million) By Application (2021-2032)
Table 25 Asia Pacific Fig Ingredient Revenue (USD Million) By Product (2021-2032)
Table 26 South America Fig Ingredient Revenue (USD Million) By Type (2021-2032)
Table 27 South America Fig Ingredient Revenue (USD Million) By Application (2021-2032)
Table 28 South America Fig Ingredient Revenue (USD Million) By Product (2021-2032)
Table 29 Middle East and Africa Fig Ingredient Revenue (USD Million) By Type (2021-2032)
Table 30 Middle East and Africa Fig Ingredient Revenue (USD Million) By Application (2021-2032)
Table 31 Middle East and Africa Fig Ingredient Revenue (USD Million) By Product (2021-2032)
LIST OF FIGURES
Figure 1. Market Scope
Figure 2. Pricing Forecasts Per Unit, 2023- 2032
Figure 3. Porter’s Five Forces
Figure 4. Global Fig Ingredient Market Revenue (USD Million) By Regions (2021-2032)
Figure 5. Global Fig Ingredient Market Share (%) By Regions (2023)
Figure 6. North America Fig Ingredient Revenue (USD Million) By Country (2021-2032)
Figure 7. United States Fig Ingredient Revenue (USD Million) By Country (2021-2032)
Figure 8. Canada Fig Ingredient Revenue (USD Million) By Country (2021-2032)
Figure 9. Mexico Fig Ingredient Revenue (USD Million) By Country (2021-2032)
Figure 10. Europe Fig Ingredient Revenue (USD Million) By Country (2021-2032)
Figure 11. Germany Fig Ingredient Revenue (USD Million) By Country (2021-2032)
Figure 12. France Fig Ingredient Revenue (USD Million) By Country (2021-2032)
Figure 13. United Kingdom Fig Ingredient Revenue (USD Million) By Country (2021-2032)
Figure 14. Spain Fig Ingredient Revenue (USD Million) By Country (2021-2032)
Figure 15. Italy Fig Ingredient Revenue (USD Million) By Country (2021-2032)
Figure 16. Russia Fig Ingredient Revenue (USD Million) By Country (2021-2032)
Figure 17. Rest of Europe Fig Ingredient Revenue (USD Million) By Country (2021-2032)
Figure 11. Asia Pacific Fig Ingredient Revenue (USD Million) By Country (2021-2032)
Figure 12. China Fig Ingredient Revenue (USD Million) By Country (2021-2032)
Figure 13. Japan Fig Ingredient Revenue (USD Million) By Country (2021-2032)
Figure 14. India Fig Ingredient Revenue (USD Million) By Country (2021-2032)
Figure 15. South Korea Fig Ingredient Revenue (USD Million) By Country (2021-2032)
Figure 16. Australia Fig Ingredient Revenue (USD Million) By Country (2021-2032)
Figure 17. South East Asia Fig Ingredient Revenue (USD Million) By Country (2021-2032)
Figure 18. South America Fig Ingredient Revenue (USD Million) By Country (2021-2032)
Figure 19. Brazil Fig Ingredient Revenue (USD Million) By Country (2021-2032)
Figure 20. Argentina Fig Ingredient Revenue (USD Million) By Country (2021-2032)
Figure 21. Rest of Asia Pacific Fig Ingredient Revenue (USD Million) By Country (2021-2032)
Figure 22. Middle East and Africa Fig Ingredient Revenue (USD Million) By Region (2021-2032)
Figure 23. Saudi Arabia Fig Ingredient Revenue (USD Million) By Region (2021-2032)
Figure 24. The UAE Fig Ingredient Revenue (USD Million) By Region (2021-2032)
Figure 25. Rest of Middle East Fig Ingredient Revenue (USD Million) By Region (2021-2032)
Figure 26. South Africa Fig Ingredient Revenue (USD Million) By Region (2021-2032)
Figure 27. Africa Fig Ingredient Revenue (USD Million) By Region (2021-2032)
Figure 28. North America Fig Ingredient Revenue (USD Million) By Type (2021-2032)
Figure 29. North America Fig Ingredient Revenue (USD Million) By Application (2021-2032)
Figure 30. North America Fig Ingredient Revenue (USD Million) By Product (2021-2032)
Figure 31. Europe Fig Ingredient Revenue (USD Million) By Type (2021-2032)
Figure 32. Europe Fig Ingredient Revenue (USD Million) By Application (2021-2032)
Figure 33. Europe Fig Ingredient Revenue (USD Million) By Product (2021-2032)
Figure 34. Asia Pacific Fig Ingredient Revenue (USD Million) By Type (2021-2032)
Figure 35. Asia Pacific Fig Ingredient Revenue (USD Million) By Application (2021-2032)
Figure 36. Asia Pacific Fig Ingredient Revenue (USD Million) By Product (2021-2032)
Figure 37. South America Fig Ingredient Revenue (USD Million) By Type (2021-2032)
Figure 38. South America Fig Ingredient Revenue (USD Million) By Application (2021-2032)
Figure 39. South America Fig Ingredient Revenue (USD Million) By Product (2021-2032)
Figure 40. Middle East and Africa Fig Ingredient Revenue (USD Million) By Type (2021-2032)
Figure 41. Middle East and Africa Fig Ingredient Revenue (USD Million) By Application (2021-2032)
Figure 42. Middle East and Africa Fig Ingredient Revenue (USD Million) By Product (2021-2032)
By Form
Powder
Liquid
By End-User
Pharmaceuticals
Food And Beverage
Dietary Supplements
Cosmetics
Bakery and Confectionary
Dairy Products
Others
Countries Analyzed
North America (US, Canada, Mexico)
Europe (Germany, UK, France, Spain, Italy, Russia, Rest of Europe)
Asia Pacific (China, India, Japan, South Korea, Australia, South East Asia, Rest of Asia)
South America (Brazil, Argentina, Rest of South America)
Middle East and Africa (Saudi Arabia, UAE, Rest of Middle East, South Africa, Egypt, Rest of Africa)
