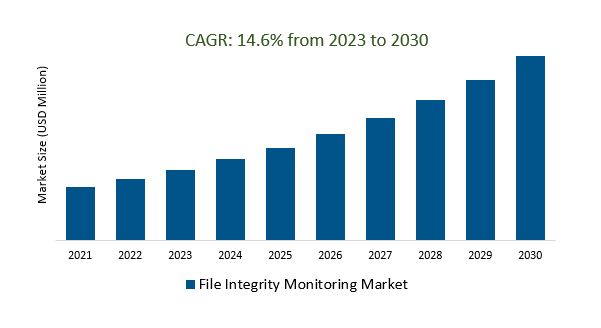
The Global File Integrity Monitoring Market Size is estimated to register 14.6% growth over the forecast period from 2023 to 2030.
The market growth is driven by the increasing the growing number of cyber threats, data breaches, and cyberattacks driving the demand for FIM solutions as organizations seek to protect their critical assets. Leading Companies that are focusing on Continuous Growth, Increased Adoption, Cloud-Native Solutions, Integration with SIEM and SOAR, Advanced Analytics, Zero Trust Architecture, Managed FIM Services, and others to boost market shares in the industry.
Market Overview
The File Integrity Monitoring (FIM) market is a cybersecurity segment focused on monitoring and ensuring the integrity of files and systems within organizations. It's driven by the need to combat cybersecurity threats, meet regulatory compliance, and protect sensitive data. Key players include SolarWinds, Tripwire, McAfee, and Splunk. FIM solutions offer real-time monitoring, and automated responses, and play a critical role in detecting insider threats, preventing data breaches, and ensuring software and firmware integrity. Challenges include alert management and scalability. The future outlook of the FIM market is positive, with continued growth expected as organizations prioritize cybersecurity and compliance, along with potential advancements in integration and machine learning.
Market Dynamics
Market Trends - File integrity monitoring (FIM) can be integrated with DevOps practices to improve security, accelerate digital transformation, and reduce risk
Integrating File Integrity Monitoring (FIM) into DevOps practices streamlines security measures by ensuring the integrity of files and configurations throughout the development lifecycle. This integration not only enhances security and compliance efforts but also enables rapid detection of unauthorized changes, automated responses to potential threats, and the establishment of a DevSecOps culture that proactively addresses security concerns. By reducing downtime, improving risk management, and securing the software supply chain, FIM within DevOps aligns security with agile development, promoting digital transformation while effectively managing security risks in a dynamic environment.
Market Driver- The growth of the IoT is driving demand for file integrity monitoring (FIM) solutions
The rapid growth of the Internet of Things (IoT) is driving a significant demand for File Integrity Monitoring (FIM) solutions. With IoT devices proliferating across various industries, the need to maintain the security and integrity of the software and firmware on these devices is paramount. FIM solutions are increasingly essential as they enable continuous monitoring and verification of file integrity, configurations, and software on IoT devices, helping organizations detect and respond to unauthorized changes and vulnerabilities. As the IoT ecosystem continues to expand, FIM emerges as a critical component in safeguarding against IoT-related security risks and is thus experiencing increasing demand to ensure the robust security of these interconnected devices.
Market Opportunity-Introduction of Machine Learning and AI
Machine Learning (ML) and Artificial Intelligence (AI) are revolutionizing the File Integrity Monitoring (FIM) market by bolstering threat detection, minimizing false alarms, and automating incident response. These technologies enable FIM solutions to analyze vast datasets for pattern recognition, uncovering both known and emerging threats. They excel in identifying anomalies, user and entity behavior deviations, and predicting potential security incidents, contributing to proactive risk mitigation. Integrated with threat intelligence, ML and AI-driven FIM systems offer context-aware prioritization of threats.
Market Share Analysis- Software File Integrity Monitoring Market will register the Significant growth
The Global File Integrity Monitoring Market is analyzed across Software, Services, and others. Software is poised to register significant growth. The File Integrity Monitoring (FIM) software market encompasses a range of solutions from various vendors. Prominent players like SolarWinds, Tripwire, McAfee, Trustwave, and IBM offer comprehensive FIM tools that provide real-time monitoring, alerting, and compliance reporting capabilities. Open-source options like Ossec and AIDE offer flexibility and extensibility for those seeking cost-effective solutions. Splunk integrates FIM within its broader security analytics platform, while NNT Change Tracker focuses on change and configuration management.
Market Share Analysis- Agentless held a significant market share in 2023
The Global File Integrity Monitoring Market is analyzed across various Installation Mode including Agent-Based, Agentless, and others. Of these, Agentless held a significant market share in 2023. The Agentless File Integrity Monitoring (FIM) market offers solutions that monitor file integrity without the need for dedicated software agents on monitored endpoints, prioritizing resource efficiency and simplifying deployment. These solutions employ network-based methods for remote file analysis, making them suitable for cloud environments, IoT ecosystems, and heterogeneous IT infrastructures. Agentless FIM solutions are valued for their scalability and compatibility with various operating systems, making them versatile options for organizations with dynamic and expanding IT environments.
File Integrity Monitoring Market Segmentation
By Component
By Installation Mode
By Organization Size
- Small and Medium Enterprises
- Large Enterprises
By Deployment Type
By End-User
- Retail
- BFSI
- Hospitality
- Healthcare
- Government
- Entertainment
- Others
By Region
- North America (United States, Canada, Mexico)
- Europe (Germany, France, United Kingdom, Spain, Italy, Others)
- Asia Pacific (China, India, Japan, South Korea, Australia, Others)
- Latin America (Brazil, Argentina, Others)
- Middle East and Africa (Saudi Arabia, UAE, Kuwait, Other Middle East, South Africa, Nigeria, Other Africa)
File Integrity Monitoring Market companies
- AlienVault Inc
- IBM Corporation
- McAfee, LLC
- Cimcor Inc
- Qualys Inc
- AT&T
- SolarWinds Worldwide LLC
- LogRhythm Inc
- Securonix Inc
- New Net Technologies LLC
- Trend Micro Inc.
- Ionx Solutions LLP
- Software Diversified Services
- TrustWave Holdings, Inc
- Splunk Technology
*List not exhaustive
File Integrity Monitoring Market Outlook 2023
1 Market Overview
1.1 Introduction to the File Integrity Monitoring Market
1.2 Scope of the Study
1.3 Research Objective
1.3.1 Key Market Scope and Segments
1.3.2 Players Covered
1.3.3 Years Considered
2 Executive Summary
2.1 2023 File Integrity Monitoring Industry- Market Statistics
3 Market Dynamics
3.1 Market Drivers
3.2 Market Challenges
3.3 Market Opportunities
3.4 Market Trends
4 Market Factor Analysis
4.1 Porter’s Five Forces
4.2 Market Entropy
4.2.1 Global File Integrity Monitoring Market Companies with Area Served
4.2.2 Products Offerings Global File Integrity Monitoring Market
5 COVID-19 Impact Analysis and Outlook Scenarios
5.1.1 Covid-19 Impact Analysis
5.1.2 Post-COVID-19 Scenario- Low Growth Case
5.1.3 Post-COVID-19 Scenario- Reference Growth Case
5.1.4 Post-COVID-19 Scenario- Low Growth Case
6 Global File Integrity Monitoring Market Trends
6.1 Global File Integrity Monitoring Revenue (USD Million) and CAGR (%) by Type (2018-2030)
6.2 Global File Integrity Monitoring Revenue (USD Million) and CAGR (%) by Applications (2018-2030)
6.3 Global File Integrity Monitoring Revenue (USD Million) and CAGR (%) by Regions (2018-2030)
7 Global File Integrity Monitoring Market Revenue (USD Million) by Type, and Applications (2018-2022)
7.1 Global File Integrity Monitoring Revenue (USD Million) by Type (2018-2022)
7.1.1 Global File Integrity Monitoring Revenue (USD Million), Market Share (%) by Type (2018-2022)
7.2 Global File Integrity Monitoring Revenue (USD Million) by Applications (2018-2022)
7.2.1 Global File Integrity Monitoring Revenue (USD Million), Market Share (%) by Applications (2018-2022)
8 Global File Integrity Monitoring Development Regional Status and Outlook
8.1 Global File Integrity Monitoring Revenue (USD Million) By Regions (2018-2022)
8.2 North America File Integrity Monitoring Revenue (USD Million) by Type, and Application (2018-2022)
8.2.1 North America File Integrity Monitoring Revenue (USD Million) by Country (2018-2022)
8.2.2 North America File Integrity Monitoring Revenue (USD Million) by Type (2018-2022)
8.2.3 North America File Integrity Monitoring Revenue (USD Million) by Applications (2018-2022)
8.3 Europe File Integrity Monitoring Revenue (USD Million), by Type, and Applications (USD Million) (2018-2022)
8.3.1 Europe File Integrity Monitoring Revenue (USD Million), by Country (2018-2022)
8.3.2 Europe File Integrity Monitoring Revenue (USD Million) by Type (2018-2022)
8.3.3 Europe File Integrity Monitoring Revenue (USD Million) by Applications (2018-2022)
8.4 Asia Pacific File Integrity Monitoring Revenue (USD Million), and Revenue (USD Million) by Type, and Applications (2018-2022)
8.4.1 Asia Pacific File Integrity Monitoring Revenue (USD Million) by Country (2018-2022)
8.4.2 Asia Pacific File Integrity Monitoring Revenue (USD Million) by Type (2018-2022)
8.4.3 Asia Pacific File Integrity Monitoring Revenue (USD Million) by Applications (2018-2022)
8.5 South America File Integrity Monitoring Revenue (USD Million), by Type, and Applications (2018-2022)
8.5.1 South America File Integrity Monitoring Revenue (USD Million), by Country (2018-2022)
8.5.2 South America File Integrity Monitoring Revenue (USD Million) by Type (2018-2022)
8.5.3 South America File Integrity Monitoring Revenue (USD Million) by Applications (2018-2022)
8.6 Middle East and Africa File Integrity Monitoring Revenue (USD Million), by Type, Technology, Application, Thickness (2018-2022)
8.6.1 Middle East and Africa File Integrity Monitoring Revenue (USD Million) by Country (2018-2022)
8.6.2 Middle East and Africa File Integrity Monitoring Revenue (USD Million) by Type (2018-2022)
8.6.3 Middle East and Africa File Integrity Monitoring Revenue (USD Million) by Applications (2018-2022)
9 Company Profiles
10 Global File Integrity Monitoring Market Revenue (USD Million), by Type, and Applications (2023-2030)
10.1 Global File Integrity Monitoring Revenue (USD Million) and Market Share (%) by Type (2023-2030)
10.1.1 Global File Integrity Monitoring Revenue (USD Million), and Market Share (%) by Type (2023-2030)
10.2 Global File Integrity Monitoring Revenue (USD Million) and Market Share (%) by Applications (2023-2030)
10.2.1 Global File Integrity Monitoring Revenue (USD Million), and Market Share (%) by Applications (2023-2030)
11 Global File Integrity Monitoring Development Regional Status and Outlook Forecast
11.1 Global File Integrity Monitoring Revenue (USD Million) By Regions (2023-2030)
11.2 North America File Integrity Monitoring Revenue (USD Million) by Type, and Applications (2023-2030)
11.2.1 North America File Integrity Monitoring Revenue (USD) Million by Country (2023-2030)
11.2.2 North America File Integrity Monitoring Revenue (USD Million), by Type (2023-2030)
11.2.3 North America File Integrity Monitoring Revenue (USD Million), Market Share (%) by Applications (2023-2030)
11.3 Europe File Integrity Monitoring Revenue (USD Million), by Type, and Applications (2023-2030)
11.3.1 Europe File Integrity Monitoring Revenue (USD Million), by Country (2023-2030)
11.3.2 Europe File Integrity Monitoring Revenue (USD Million), by Type (2023-2030)
11.3.3 Europe File Integrity Monitoring Revenue (USD Million), by Applications (2023-2030)
11.4 Asia Pacific File Integrity Monitoring Revenue (USD Million) by Type, and Applications (2023-2030)
11.4.1 Asia Pacific File Integrity Monitoring Revenue (USD Million), by Country (2023-2030)
11.4.2 Asia Pacific File Integrity Monitoring Revenue (USD Million), by Type (2023-2030)
11.4.3 Asia Pacific File Integrity Monitoring Revenue (USD Million), by Applications (2023-2030)
11.5 South America File Integrity Monitoring Revenue (USD Million), by Type, and Applications (2023-2030)
11.5.1 South America File Integrity Monitoring Revenue (USD Million), by Country (2023-2030)
11.5.2 South America File Integrity Monitoring Revenue (USD Million), by Type (2023-2030)
11.5.3 South America File Integrity Monitoring Revenue (USD Million), by Applications (2023-2030)
11.6 Middle East and Africa File Integrity Monitoring Revenue (USD Million), by Type, and Applications (2023-2030)
11.6.1 Middle East and Africa File Integrity Monitoring Revenue (USD Million), by Region (2023-2030)
11.6.2 Middle East and Africa File Integrity Monitoring Revenue (USD Million), by Type (2023-2030)
11.6.3 Middle East and Africa File Integrity Monitoring Revenue (USD Million), by Applications (2023-2030)
12 Methodology and Data Sources
12.1 Methodology/Research Approach
12.1.1 Research Programs/Design
12.1.2 Market Size Estimation
12.1.3 Market Breakdown and Data Triangulation
12.2 Data Sources
12.2.1 Secondary Sources
12.2.2 Primary Sources
12.3 Disclaimer
List of Tables
Table 1 Market Segmentation Analysis
Table 2 Global File Integrity Monitoring Market Companies with Areas Served
Table 3 Products Offerings Global File Integrity Monitoring Market
Table 4 Low Growth Scenario Forecasts
Table 5 Reference Case Growth Scenario
Table 6 High Growth Case Scenario
Table 7 Global File Integrity Monitoring Revenue (USD Million) And CAGR (%) By Type (2018-2030)
Table 8 Global File Integrity Monitoring Revenue (USD Million) And CAGR (%) By Applications (2018-2030)
Table 9 Global File Integrity Monitoring Revenue (USD Million) And CAGR (%) By Regions (2018-2030)
Table 10 Global File Integrity Monitoring Revenue (USD Million) By Type (2018-2022)
Table 11 Global File Integrity Monitoring Revenue Market Share (%) By Type (2018-2022)
Table 12 Global File Integrity Monitoring Revenue (USD Million) By Applications (2018-2022)
Table 13 Global File Integrity Monitoring Revenue Market Share (%) By Applications (2018-2022)
Table 14 Global File Integrity Monitoring Market Revenue (USD Million) By Regions (2018-2022)
Table 15 Global File Integrity Monitoring Market Share (%) By Regions (2018-2022)
Table 16 North America File Integrity Monitoring Revenue (USD Million) By Country (2018-2022)
Table 17 North America File Integrity Monitoring Revenue (USD Million) By Type (2018-2022)
Table 18 North America File Integrity Monitoring Revenue (USD Million) By Applications (2018-2022)
Table 19 Europe File Integrity Monitoring Revenue (USD Million) By Country (2018-2022)
Table 20 Europe File Integrity Monitoring Revenue (USD Million) By Type (2018-2022)
Table 21 Europe File Integrity Monitoring Revenue (USD Million) By Applications (2018-2022)
Table 22 Asia Pacific File Integrity Monitoring Revenue (USD Million) By Country (2018-2022)
Table 23 Asia Pacific File Integrity Monitoring Revenue (USD Million) By Type (2018-2022)
Table 24 Asia Pacific File Integrity Monitoring Revenue (USD Million) By Applications (2018-2022)
Table 25 South America File Integrity Monitoring Revenue (USD Million) By Country (2018-2022)
Table 26 South America File Integrity Monitoring Revenue (USD Million) By Type (2018-2022)
Table 27 South America File Integrity Monitoring Revenue (USD Million) By Applications (2018-2022)
Table 28 Middle East and Africa File Integrity Monitoring Revenue (USD Million) By Region (2018-2022)
Table 29 Middle East and Africa File Integrity Monitoring Revenue (USD Million) By Type (2018-2022)
Table 30 Middle East and Africa File Integrity Monitoring Revenue (USD Million) By Applications (2018-2022)
Table 31 Financial Analysis
Table 32 Global File Integrity Monitoring Revenue (USD Million) By Type (2023-2030)
Table 33 Global File Integrity Monitoring Revenue Market Share (%) By Type (2023-2030)
Table 34 Global File Integrity Monitoring Revenue (USD Million) By Applications (2023-2030)
Table 35 Global File Integrity Monitoring Revenue Market Share (%) By Applications (2023-2030)
Table 36 Global File Integrity Monitoring Market Revenue (USD Million), And Revenue (USD Million) By Regions (2023-2030)
Table 37 North America File Integrity Monitoring Revenue (USD)By Country (2023-2030)
Table 38 North America File Integrity Monitoring Revenue (USD Million) By Type (2023-2030)
Table 39 North America File Integrity Monitoring Revenue (USD Million) By Applications (2023-2030)
Table 40 Europe File Integrity Monitoring Revenue (USD Million) By Country (2023-2030)
Table 41 Europe File Integrity Monitoring Revenue (USD Million) By Type (2023-2030)
Table 42 Europe File Integrity Monitoring Revenue (USD Million) By Applications (2023-2030)
Table 43 Asia Pacific File Integrity Monitoring Revenue (USD Million) By Country (2023-2030)
Table 44 Asia Pacific File Integrity Monitoring Revenue (USD Million) By Type (2023-2030)
Table 45 Asia Pacific File Integrity Monitoring Revenue (USD Million) By Applications (2023-2030)
Table 46 South America File Integrity Monitoring Revenue (USD Million) By Country (2023-2030)
Table 47 South America File Integrity Monitoring Revenue (USD Million) By Type (2023-2030)
Table 48 South America File Integrity Monitoring Revenue (USD Million) By Applications (2023-2030)
Table 49 Middle East and Africa File Integrity Monitoring Revenue (USD Million) By Region (2023-2030)
Table 50 Middle East and Africa File Integrity Monitoring Revenue (USD Million) By Region (2023-2030)
Table 51 Middle East and Africa File Integrity Monitoring Revenue (USD Million) By Type (2023-2030)
Table 52 Middle East and Africa File Integrity Monitoring Revenue (USD Million) By Applications (2023-2030)
Table 53 Research Programs/Design for This Report
Table 54 Key Data Information from Secondary Sources
Table 55 Key Data Information from Primary Sources
List of Figures
Figure 1 Market Scope
Figure 2 Porter’s Five Forces
Figure 3 Global File Integrity Monitoring Revenue (USD Million) By Type (2018-2022)
Figure 4 Global File Integrity Monitoring Revenue Market Share (%) By Type (2022)
Figure 5 Global File Integrity Monitoring Revenue (USD Million) By Applications (2018-2022)
Figure 6 Global File Integrity Monitoring Revenue Market Share (%) By Applications (2022)
Figure 7 Global File Integrity Monitoring Market Revenue (USD Million) By Regions (2018-2022)
Figure 8 Global File Integrity Monitoring Market Share (%) By Regions (2022)
Figure 9 North America File Integrity Monitoring Revenue (USD Million) By Country (2018-2022)
Figure 10 North America File Integrity Monitoring Revenue (USD Million) By Type (2018-2022)
Figure 11 North America File Integrity Monitoring Revenue (USD Million) By Applications (2018-2022)
Figure 12 Europe File Integrity Monitoring Revenue (USD Million) By Country (2018-2022)
Figure 13 Europe File Integrity Monitoring Revenue (USD Million) By Type (2018-2022)
Figure 14 Europe File Integrity Monitoring Revenue (USD Million) By Applications (2018-2022)
Figure 15 Asia Pacific File Integrity Monitoring Revenue (USD Million) By Country (2018-2022)
Figure 16 Asia Pacific File Integrity Monitoring Revenue (USD Million) By Type (2018-2022)
Figure 17 Asia Pacific File Integrity Monitoring Revenue (USD Million) By Applications (2018-2022)
Figure 18 South America File Integrity Monitoring Revenue (USD Million) By Country (2018-2022)
Figure 19 South America File Integrity Monitoring Revenue (USD Million) By Type (2018-2022)
Figure 20 South America File Integrity Monitoring Revenue (USD Million) By Applications (2018-2022)
Figure 21 Middle East and Africa File Integrity Monitoring Revenue (USD Million) By Region (2018-2022)
Figure 22 Middle East and Africa File Integrity Monitoring Revenue (USD Million) By Type (2018-2022)
Figure 23 Middle East and Africa File Integrity Monitoring Revenue (USD Million) By Applications (2018-2022)
Figure 24 Global File Integrity Monitoring Revenue (USD Million) By Type (2023-2030)
Figure 25 Global File Integrity Monitoring Revenue Market Share (%) By Type (2030)
Figure 26 Global File Integrity Monitoring Revenue (USD Million) By Applications (2023-2030)
Figure 27 Global File Integrity Monitoring Revenue Market Share (%) By Applications (2030)
Figure 28 Global File Integrity Monitoring Market Revenue (USD Million) By Regions (2023-2030)
Figure 29 North America File Integrity Monitoring Revenue (USD Million) By Country (2023-2030)
Figure 30 North America File Integrity Monitoring Revenue (USD Million) By Type (2023-2030)
Figure 31 North America File Integrity Monitoring Revenue (USD Million) By Applications (2023-2030)
Figure 32 Europe File Integrity Monitoring Revenue (USD Million) By Country (2023-2030)
Figure 33 Europe File Integrity Monitoring Revenue (USD Million) By Type (2023-2030)
Figure 34 Europe File Integrity Monitoring Revenue (USD Million) By Applications (2023-2030)
Figure 35 Asia Pacific File Integrity Monitoring Revenue (USD Million) By Country (2023-2030)
Figure 36 Asia Pacific File Integrity Monitoring Revenue (USD Million) By Type (2023-2030)
Figure 37 Asia Pacific File Integrity Monitoring Revenue (USD Million) By Applications (2023-2030)
Figure 38 South America File Integrity Monitoring Revenue (USD Million) By Country (2023-2030)
Figure 39 South America File Integrity Monitoring Revenue (USD Million) By Type (2023-2030)
Figure 40 South America File Integrity Monitoring Revenue (USD Million) By Applications (2023-2030)
Figure 41 Middle East and Africa File Integrity Monitoring Revenue (USD Million) By Region (2023-2030)
Figure 42 Middle East and Africa File Integrity Monitoring Revenue (USD Million) By Region (2023-2030)
Figure 43 Middle East and Africa File Integrity Monitoring Revenue (USD Million) By Type (2023-2030)
Figure 44 Middle East and Africa File Integrity Monitoring Revenue (USD Million) By Applications (2023-2030)
Figure 45 Bottom-Up and Top-Down Approaches For This Report
Figure 46 Data Triangulation
