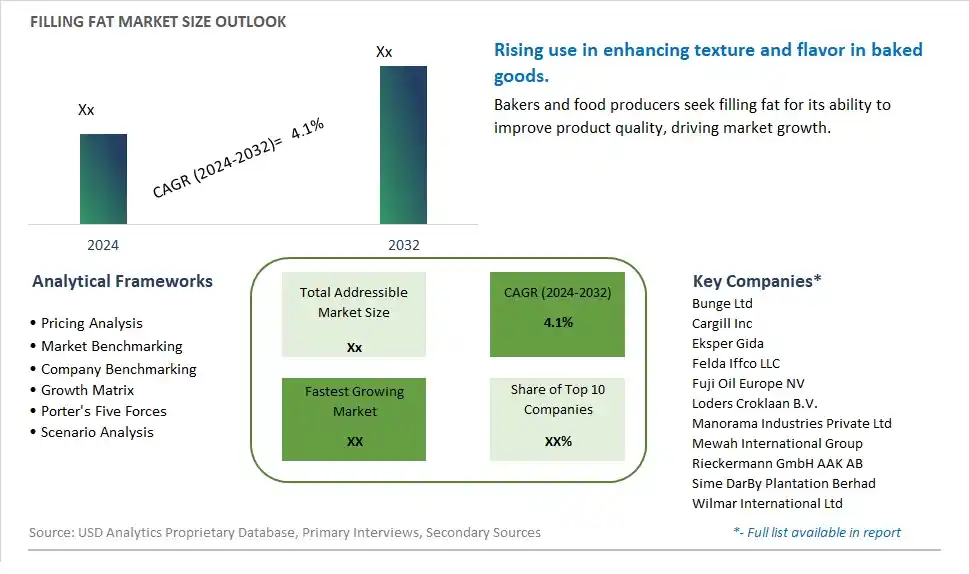
Global Filling Fat Market Size is valued at $XX Million in 2024 and is forecast to register a growth rate (CAGR) of 4.1% to reach $XX Million by 2032.
The global Filling Fat Market Comprehensive Study analyzes and forecasts the market size across 6 regions and 24 countries for diverse segments -By Type (Lauric, Non-lauric), By End-User (Confectionery, Toffee Filling, Confectionery spreads, Chocolate compounding, Confectionery bars, Pralines, Others, Bakery & Snacks, Frozen desserts, Spreads & Dressings), By Fat Content (High Fat, Low Fat)
An Introduction to Filling Fat Market
The Filling Fat market in 2024 is witnessing robust growth, driven by the increasing demand for specialized fats and oils in the confectionery and bakery industries. Filling fats, used to create smooth and stable fillings for chocolates, pastries, and other baked goods, are essential for product quality and shelf life. The market benefits from advancements in fat processing technologies, the growing trend of premium and indulgent foods, and the expansion of the global confectionery and bakery markets. Additionally, the rising focus on clean label and sustainable fat sources is contributing to market growth.
Filling Fat Competitive Landscape
The market report analyses the leading companies in the industry including Bunge Ltd, Cargill Inc, Eksper Gida, Felda Iffco LLC, Fuji Oil Europe NV, Loders Croklaan B.V., Manorama Industries Private Ltd, Mewah International Group, Rieckermann GmbH AAK AB, Sime DarBy Plantation Berhad, Wilmar International Ltd, and Others.
Filling Fat Market Dynamics
Filling Fat Market Trend: Increasing Demand for Clean Label and Natural Ingredients
The filling fat market is witnessing a significant trend towards the increasing demand for clean label and natural ingredients. Consumers are becoming more health-conscious and are scrutinizing food labels for artificial additives, trans fats, and other unhealthy components. This shift is driving manufacturers to use natural, minimally processed fats in their fillings. The trend towards clean eating and transparency in ingredient sourcing is pushing companies to innovate with healthier fat options, such as those derived from plants and animals raised without synthetic inputs. This movement aligns with the broader consumer preference for food products that promote well-being and sustainability.
Filling Fat Market Driver: Growing Popularity of Plant-Based and Alternative Fats
The growing popularity of plant-based and alternative fats is a major driver for the filling fat market. As more consumers adopt vegetarian, vegan, and flexitarian diets, the demand for plant-based ingredients, including fats, is rising. This is fueled by health concerns, ethical considerations, and environmental awareness. Manufacturers are increasingly incorporating fats from sources such as coconut, avocado, and nuts into their filling products to meet this demand. These alternative fats not only cater to specific dietary preferences but also offer unique flavors and textures, enhancing the appeal of various filled food products.
Filling Fat Market Opportunity: Innovation in Functional and Specialty Fats
There is a significant opportunity for growth in the filling fat market through innovation in functional and specialty fats. Manufacturers can develop fats that provide specific health benefits, such as omega-3 enriched oils, which can appeal to health-conscious consumers. Additionally, creating fats tailored for specialized applications, like those that maintain stability at high temperatures or improve the texture of frozen desserts, can open new market segments. By focusing on the functional properties and health benefits of filling fats, companies can differentiate their products and meet the evolving demands of both consumers and food manufacturers, driving market expansion.
Filling Fat Market Share Analysis: Lauric segment generated the highest revenue share in the industry
Lauric is the largest segment in the Filling Fat Market by Type. Lauric fats, derived primarily from coconut oil and palm kernel oil, are widely used in the food industry due to their unique properties, including a high melting point and excellent stability. These fats are particularly popular in confectionery applications, such as chocolates and fillings, because they provide a smooth texture and desirable mouthfeel. Lauric fats are also known for their antimicrobial properties, which extend the shelf life of products containing them. The versatility and functional benefits of lauric fats make them a preferred choice for manufacturers, driving their dominance in the filling fat market. Additionally, the increasing consumer preference for natural and plant-based ingredients further supports the widespread use of lauric fats in various food products.
Filling Fat Market Share Analysis: Confectionery Bars is the fastest growing segment over the forecast period to 2032
The Confectionery Bars segment is projected to be the fastest-growing end-user in the Filling Fat Market by 2032. This growth is fueled by the rising consumer demand for convenient, indulgent snacks that can be enjoyed on the go. Confectionery bars, which include a variety of products such as chocolate bars, energy bars, and granola bars, often use filling fats to enhance flavor, texture, and shelf stability. The trend towards premium and artisanal confectionery products, which often feature rich and creamy fillings, is driving innovation and demand in this segment. Additionally, the increasing popularity of functional and fortified confectionery bars, which provide added health benefits alongside indulgence, is contributing to the segment's rapid growth. As consumers continue to seek out novel and satisfying snack options, the confectionery bars segment is expected to see significant expansion.
Filling Fat Market Share Analysis: High Fat segment generated the highest revenue share in the industry
High Fat is the largest segment in the Filling Fat Market by Fat Content. This segment's dominance is due to the essential role that high-fat content plays in delivering the desired taste, texture, and mouthfeel in a wide range of confectionery and bakery products. High-fat fillings are particularly favored in the production of rich, creamy chocolates, pastries, and desserts, where they contribute to the overall indulgent experience that consumers seek. The sensory qualities provided by high-fat content are crucial for achieving the right consistency and flavor profile in premium and luxury food items. Furthermore, high-fat products often have better shelf stability, which is important for maintaining the quality and freshness of filled products over time. The preference for high-fat fillings is also driven by the ongoing trend of premiumization in the food industry, where consumers are willing to pay more for superior taste and quality.
Filling Fat Market Segmentation
By Type
Lauric
Non-lauric
By End-User
Confectionery
Toffee Filling
Confectionery spreads
Chocolate compounding
Confectionery bars
Pralines
Others
Bakery & Snacks
Frozen desserts
Spreads & Dressings
By Fat Content
High Fat
Low Fat
Countries Analyzed
North America (US, Canada, Mexico)
Europe (Germany, UK, France, Spain, Italy, Russia, Rest of Europe)
Asia Pacific (China, India, Japan, South Korea, Australia, South East Asia, Rest of Asia)
South America (Brazil, Argentina, Rest of South America)
Middle East and Africa (Saudi Arabia, UAE, Rest of Middle East, South Africa, Egypt, Rest of Africa)
Filling Fat Companies Profiled in the Study
Bunge Ltd
Cargill Inc
Eksper Gida
Felda Iffco LLC
Fuji Oil Europe NV
Loders Croklaan B.V.
Manorama Industries Private Ltd
Mewah International Group
Rieckermann GmbH AAK AB
Sime DarBy Plantation Berhad
Wilmar International Ltd
*- List Not Exhaustive
Chapter 1. TABLE OF CONTENTS
Chapter 2. Introduction to Filling Fat Market
2.1. Market Overview
2.2. Key Statistics and Report Highlights
2.3. Scope of the Comprehensive Study
2.3.1. Market Definition
2.3.2 Countries and Regions Covered
2.3.3 Research Objective
2.3.4 Units, Currency, and Conversions
2.3.5 Industry Value Chain
2.4. Key Market Segments
2.5. Key Companies
2.6. Study Period
Chapter 3. Strategic Analysis Review
3.1. Filling Fat Pricing Analysis and Forecast
3.2. Porter’s Five Forces
3.3. Market Ecosystem
3.4. SWOT Analysis
3.5. Regulatory Scenario
3.3. Effects of Inflation, Russia-Ukraine War, moderating economic growth, and other macroeconomic factors
Chapter 4. Competitive Landscape
4.1. Market Share Analysis
4.1.1. Global Filling Fat Market Share by Company, 2023
4.1.2. Product Offerings of Leading Filling Fat Companies
4.2. Market Entropy
4.2.1. New Product Launches in the Industry
4.2.2. Mergers, Acquisitions, Joint ventures, and Partnerships
4.3. Key Strategies and Best Practices
Chapter 5. Global Market Projections: Best, Reference, and Low Case Scenarios
5.1. Growth Analysis- Case Scenario Definitions
5.2. Low Growth Case Scenario Forecasts
5.3. Reference Growth Case Scenario Forecasts
5.4. High Growth Case Scenario Forecasts
Chapter 6. Market Dynamics
6.1. Filling Fat Market Drivers
6.2. Filling Fat Market Challenges
6.6. Filling Fat Market Opportunities
6.4. Filling Fat Market Trends
Chapter 7. Global Filling Fat Market Outlook Trends
7.1. Global Filling Fat Revenue (USD Million) and CAGR (%) by Type (2021-2032)
7.2. Global Filling Fat Revenue (USD Million) and CAGR (%) by Application (2021-2032)
7.3. Global Filling Fat Revenue (USD Million) and CAGR (%) by Product (2021-2032)
By Type
Lauric
Non-lauric
By End-User
Confectionery
Toffee Filling
Confectionery spreads
Chocolate compounding
Confectionery bars
Pralines
Others
Bakery & Snacks
Frozen desserts
Spreads & Dressings
By Fat Content
High Fat
Low Fat
Chapter 8. Global Filling Fat Regional Analysis and Outlook
8.1. Global Filling Fat Revenue (USD Million) By Regions (2021- 2032)
8.2. North America Filling Fat Revenue (USD Million) by Country (2021-2032)
8.2.1. United States Filling Fat Regional Analysis and Outlook
8.2.2. Canada Filling Fat Regional Analysis and Outlook
8.2.3. Mexico Filling Fat Regional Analysis and Outlook
8.3. Europe Filling Fat Revenue (USD Million), by Country (2021-2032)
8.3.1. Germany Filling Fat Regional Analysis and Outlook
8.3.2. France Filling Fat Regional Analysis and Outlook
8.3.3. United Kingdom Filling Fat Regional Analysis and Outlook
8.3.4. Spain Filling Fat Regional Analysis and Outlook
8.3.5. Italy Filling Fat Regional Analysis and Outlook
8.3.6. Russia Filling Fat Regional Analysis and Outlook
8.3.7. Rest of Europe Filling Fat Regional Analysis and Outlook
8.4. Asia Pacific Filling Fat Revenue (USD Million) by Country (2021-2032)
8.4.1. China Filling Fat Regional Analysis and Outlook
8.4.2. Japan Filling Fat Regional Analysis and Outlook
8.4.3. India Filling Fat Regional Analysis and Outlook
8.4.4. South Korea Filling Fat Regional Analysis and Outlook
8.4.5. Australia Filling Fat Regional Analysis and Outlook
8.4.6. South East Asia Filling Fat Regional Analysis and Outlook
8.4.7. Rest of Asia Pacific Filling Fat Regional Analysis and Outlook
8.5. South America Filling Fat Revenue (USD Million), by Country (2021-2032)
8.5.1. Brazil Filling Fat Regional Analysis and Outlook
8.5.2. Argentina Filling Fat Regional Analysis and Outlook
8.5.3. Rest of South America Filling Fat Regional Analysis and Outlook
8.6. Middle East and Africa Filling Fat Revenue (USD Million) by Country (2021-2032)
8.6.1. Middle East Filling Fat Regional Analysis and Outlook
8.6.2. Africa Filling Fat Regional Analysis and Outlook
Chapter 9. North America Filling Fat Analysis and Outlook
9.1. North America Filling Fat Revenue (USD Million) by Segments (2021-2032)
9.1.1. North America Filling Fat Revenue (USD Million) by Type (2021-2032)
9.1.2. North America Filling Fat Revenue (USD Million) by Application (2021-2032)
9.1.3. North America Filling Fat Revenue (USD Million) by Product (2021-2032)
By Type
Lauric
Non-lauric
By End-User
Confectionery
Toffee Filling
Confectionery spreads
Chocolate compounding
Confectionery bars
Pralines
Others
Bakery & Snacks
Frozen desserts
Spreads & Dressings
By Fat Content
High Fat
Low Fat
Chapter 10. Europe Filling Fat Analysis and Outlook
10.1. Europe Filling Fat Revenue (USD Million), by Segments (USD Million) (2021-2032)
10.1.1. Europe Filling Fat Revenue (USD Million) by Type (2021-2032)
10.1.2. Europe Filling Fat Revenue (USD Million) by Application (2021-2032)
10.1.3. Europe Filling Fat Revenue (USD Million) by Product (2021-2032)
By Type
Lauric
Non-lauric
By End-User
Confectionery
Toffee Filling
Confectionery spreads
Chocolate compounding
Confectionery bars
Pralines
Others
Bakery & Snacks
Frozen desserts
Spreads & Dressings
By Fat Content
High Fat
Low Fat
Chapter 11. Asia Pacific Filling Fat Analysis and Outlook
11.1. Asia Pacific Filling Fat Revenue (USD Million), and Revenue (USD Million) by Segments (2021-2032)
11.1.1. Asia Pacific Filling Fat Revenue (USD Million) by Type (2021-2032)
11.1.2. Asia Pacific Filling Fat Revenue (USD Million) by Application (2021-2032)
11.1.3. Asia Pacific Filling Fat Revenue (USD Million) by Product (2021-2032)
By Type
Lauric
Non-lauric
By End-User
Confectionery
Toffee Filling
Confectionery spreads
Chocolate compounding
Confectionery bars
Pralines
Others
Bakery & Snacks
Frozen desserts
Spreads & Dressings
By Fat Content
High Fat
Low Fat
Chapter 12. South America Filling Fat Analysis and Outlook
12.1. South America Filling Fat Revenue (USD Million), by Segments (2021-2032)
12.1.1. South America Filling Fat Revenue (USD Million) by Type (2021-2032)
12.1.2. South America Filling Fat Revenue (USD Million) by Application (2021-2032)
12.1.3. South America Filling Fat Revenue (USD Million) by Product (2021-2032)
By Type
Lauric
Non-lauric
By End-User
Confectionery
Toffee Filling
Confectionery spreads
Chocolate compounding
Confectionery bars
Pralines
Others
Bakery & Snacks
Frozen desserts
Spreads & Dressings
By Fat Content
High Fat
Low Fat
Chapter 13. Middle East and Africa Filling Fat Analysis and Outlook
13.1. Middle East and Africa Filling Fat Revenue (USD Million), by Segments (2021-2032)
13.1.1. Middle East and Africa Filling Fat Revenue (USD Million) by Type (2021-2032)
13.1.2. Middle East and Africa Filling Fat Revenue (USD Million) by Application (2021-2032)
13.1.3. Middle East and Africa Filling Fat Revenue (USD Million) by Product (2021-2032)
By Type
Lauric
Non-lauric
By End-User
Confectionery
Toffee Filling
Confectionery spreads
Chocolate compounding
Confectionery bars
Pralines
Others
Bakery & Snacks
Frozen desserts
Spreads & Dressings
By Fat Content
High Fat
Low Fat
Chapter 14. Filling Fat Company Profiles
14.1 Business Overview
14.2 Product Profiles
14.3 SWOT Profiles
14.5 Recent Developments
14.6 Financial Profile
List of Companies
Bunge Ltd
Cargill Inc
Eksper Gida
Felda Iffco LLC
Fuji Oil Europe NV
Loders Croklaan B.V.
Manorama Industries Private Ltd
Mewah International Group
Rieckermann GmbH AAK AB
Sime DarBy Plantation Berhad
Wilmar International Ltd
15. Methodology and Data Sources
15.1 Customization Offerings
15.2 Subscription Services
15.3 Related Reports
15.4 Publisher Expertise
LIST OF TABLES
Table 1 Market Segmentation Analysis
Table 2 Global Filling Fat Market Share of Leading Companies, 2023
Table 3 Product Offerings of Leading Companies
Table 4 Low Growth Scenario Forecasts
Table 5 Reference Case Growth Scenario
Table 6 High Growth Case Scenario
Table 7 Global Filling Fat Revenue (USD Million) And CAGR (%) By Type (2021-2032)
Table 8 Global Filling Fat Revenue (USD Million) And CAGR (%) By Application (2021-2032)
Table 9 Global Filling Fat Revenue (USD Million) And CAGR (%) By Product (2021-2032)
Table 10 Global Filling Fat Market Revenue (USD Million) By Regions (2021-2032)
Table 11 Global Filling Fat Market Share (%) By Regions (2021-2032)
Table 12 North America Filling Fat Revenue (USD Million) By Country (2021-2032)
Table 13 Europe Filling Fat Revenue (USD Million) By Country (2021-2032)
Table 14 Asia Pacific Filling Fat Revenue (USD Million) By Country (2021-2032)
Table 15 South America Filling Fat Revenue (USD Million) By Country (2021-2032)
Table 16 Middle East and Africa Filling Fat Revenue (USD Million) By Region (2021-2032)
Table 17 North America Filling Fat Revenue (USD Million) By Type (2021-2032)
Table 18 North America Filling Fat Revenue (USD Million) By Application (2021-2032)
Table 19 North America Filling Fat Revenue (USD Million) By Product (2021-2032)
Table 20 Europe Filling Fat Revenue (USD Million) By Type (2021-2032)
Table 21 Europe Filling Fat Revenue (USD Million) By Application (2021-2032)
Table 22 Europe Filling Fat Revenue (USD Million) By Product (2021-2032)
Table 23 Asia Pacific Filling Fat Revenue (USD Million) By Type (2021-2032)
Table 24 Asia Pacific Filling Fat Revenue (USD Million) By Application (2021-2032)
Table 25 Asia Pacific Filling Fat Revenue (USD Million) By Product (2021-2032)
Table 26 South America Filling Fat Revenue (USD Million) By Type (2021-2032)
Table 27 South America Filling Fat Revenue (USD Million) By Application (2021-2032)
Table 28 South America Filling Fat Revenue (USD Million) By Product (2021-2032)
Table 29 Middle East and Africa Filling Fat Revenue (USD Million) By Type (2021-2032)
Table 30 Middle East and Africa Filling Fat Revenue (USD Million) By Application (2021-2032)
Table 31 Middle East and Africa Filling Fat Revenue (USD Million) By Product (2021-2032)
LIST OF FIGURES
Figure 1. Market Scope
Figure 2. Pricing Forecasts Per Unit, 2023- 2032
Figure 3. Porter’s Five Forces
Figure 4. Global Filling Fat Market Revenue (USD Million) By Regions (2021-2032)
Figure 5. Global Filling Fat Market Share (%) By Regions (2023)
Figure 6. North America Filling Fat Revenue (USD Million) By Country (2021-2032)
Figure 7. United States Filling Fat Revenue (USD Million) By Country (2021-2032)
Figure 8. Canada Filling Fat Revenue (USD Million) By Country (2021-2032)
Figure 9. Mexico Filling Fat Revenue (USD Million) By Country (2021-2032)
Figure 10. Europe Filling Fat Revenue (USD Million) By Country (2021-2032)
Figure 11. Germany Filling Fat Revenue (USD Million) By Country (2021-2032)
Figure 12. France Filling Fat Revenue (USD Million) By Country (2021-2032)
Figure 13. United Kingdom Filling Fat Revenue (USD Million) By Country (2021-2032)
Figure 14. Spain Filling Fat Revenue (USD Million) By Country (2021-2032)
Figure 15. Italy Filling Fat Revenue (USD Million) By Country (2021-2032)
Figure 16. Russia Filling Fat Revenue (USD Million) By Country (2021-2032)
Figure 17. Rest of Europe Filling Fat Revenue (USD Million) By Country (2021-2032)
Figure 11. Asia Pacific Filling Fat Revenue (USD Million) By Country (2021-2032)
Figure 12. China Filling Fat Revenue (USD Million) By Country (2021-2032)
Figure 13. Japan Filling Fat Revenue (USD Million) By Country (2021-2032)
Figure 14. India Filling Fat Revenue (USD Million) By Country (2021-2032)
Figure 15. South Korea Filling Fat Revenue (USD Million) By Country (2021-2032)
Figure 16. Australia Filling Fat Revenue (USD Million) By Country (2021-2032)
Figure 17. South East Asia Filling Fat Revenue (USD Million) By Country (2021-2032)
Figure 18. South America Filling Fat Revenue (USD Million) By Country (2021-2032)
Figure 19. Brazil Filling Fat Revenue (USD Million) By Country (2021-2032)
Figure 20. Argentina Filling Fat Revenue (USD Million) By Country (2021-2032)
Figure 21. Rest of Asia Pacific Filling Fat Revenue (USD Million) By Country (2021-2032)
Figure 22. Middle East and Africa Filling Fat Revenue (USD Million) By Region (2021-2032)
Figure 23. Saudi Arabia Filling Fat Revenue (USD Million) By Region (2021-2032)
Figure 24. The UAE Filling Fat Revenue (USD Million) By Region (2021-2032)
Figure 25. Rest of Middle East Filling Fat Revenue (USD Million) By Region (2021-2032)
Figure 26. South Africa Filling Fat Revenue (USD Million) By Region (2021-2032)
Figure 27. Africa Filling Fat Revenue (USD Million) By Region (2021-2032)
Figure 28. North America Filling Fat Revenue (USD Million) By Type (2021-2032)
Figure 29. North America Filling Fat Revenue (USD Million) By Application (2021-2032)
Figure 30. North America Filling Fat Revenue (USD Million) By Product (2021-2032)
Figure 31. Europe Filling Fat Revenue (USD Million) By Type (2021-2032)
Figure 32. Europe Filling Fat Revenue (USD Million) By Application (2021-2032)
Figure 33. Europe Filling Fat Revenue (USD Million) By Product (2021-2032)
Figure 34. Asia Pacific Filling Fat Revenue (USD Million) By Type (2021-2032)
Figure 35. Asia Pacific Filling Fat Revenue (USD Million) By Application (2021-2032)
Figure 36. Asia Pacific Filling Fat Revenue (USD Million) By Product (2021-2032)
Figure 37. South America Filling Fat Revenue (USD Million) By Type (2021-2032)
Figure 38. South America Filling Fat Revenue (USD Million) By Application (2021-2032)
Figure 39. South America Filling Fat Revenue (USD Million) By Product (2021-2032)
Figure 40. Middle East and Africa Filling Fat Revenue (USD Million) By Type (2021-2032)
Figure 41. Middle East and Africa Filling Fat Revenue (USD Million) By Application (2021-2032)
Figure 42. Middle East and Africa Filling Fat Revenue (USD Million) By Product (2021-2032)
By Type
Lauric
Non-lauric
By End-User
Confectionery
Toffee Filling
Confectionery spreads
Chocolate compounding
Confectionery bars
Pralines
Others
Bakery & Snacks
Frozen desserts
Spreads & Dressings
By Fat Content
High Fat
Low Fat
Countries Analyzed
North America (US, Canada, Mexico)
Europe (Germany, UK, France, Spain, Italy, Russia, Rest of Europe)
Asia Pacific (China, India, Japan, South Korea, Australia, South East Asia, Rest of Asia)
South America (Brazil, Argentina, Rest of South America)
Middle East and Africa (Saudi Arabia, UAE, Rest of Middle East, South Africa, Egypt, Rest of Africa)
