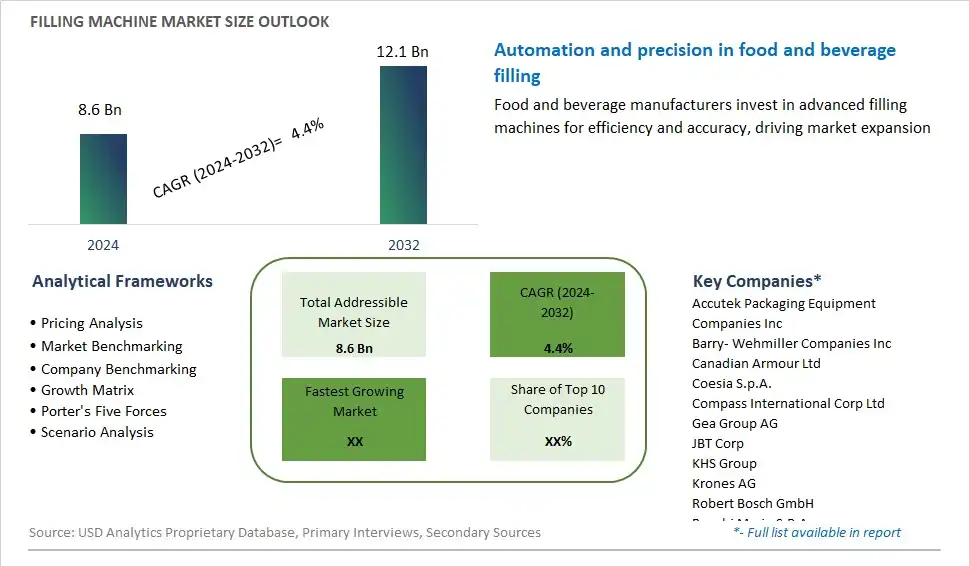
Global Filling Machine Market Size is valued at $8.6 Billion in 2024 and is forecast to register a growth rate (CAGR) of 4.4% to reach $12.1 Billion by 2032.
The global Filling Machine Market Comprehensive Study analyzes and forecasts the market size across 6 regions and 24 countries for diverse segments -By Product (Aseptic, Rotary, Net Weight, Volumetric, Others), By Mode of Operation (Automatic, Semi-automatic), By Application (Beverages, Food, Chemicals, Personal Care, Pharmaceuticals, Others)
An Introduction to Filling Machine Market
Filling machines are specialized equipment used in the packaging industry to fill containers with liquid, semi-liquid, or powdered products in 2024. These machines come in various configurations, including volumetric, gravimetric, and piston fillers, to accommodate different product viscosities, container sizes, and production speeds. Filling machines are widely used in food and beverage packaging operations, including bottling plants, dairy processing facilities, and snack manufacturing plants, to automate the filling process and improve productivity, accuracy, and hygiene. With advancements in automation, robotics, and digital controls, filling machines offer precise control over fill volumes, container handling, and sealing processes, ensuring product integrity and minimizing product loss and waste. Whether filling bottles, cans, pouches, or jars, filling machines play a critical role in meeting consumer demand for convenient, safe, and shelf-stable packaged products. As consumer preferences for convenience and on-the-go consumption grow, the market for filling machines is expected to expand, driven by investments in technology, customization, and sustainability initiatives that enhance performance, flexibility, and efficiency in filling operations.
Filling Machine Competitive Landscape
The market report analyses the leading companies in the industry including Accutek Packaging Equipment Companies Inc, Barry- Wehmiller Companies Inc, Canadian Armour Ltd, Coesia S.p.A., Compass International Corp Ltd, Gea Group AG, JBT Corp, KHS Group, Krones AG, Robert Bosch GmbH, Ronchi Mario S.P.A., Tetra Laval International S.A., and Others.
Filling Machine Market Dynamics
Filling Machine Market Trend: Automation and Integration in Filling Processes
One prominent trend in the filling machine market is the increasing adoption of automation and integration solutions in filling processes. As manufacturing facilities strive for greater efficiency, accuracy, and speed in their production lines, there is a growing demand for filling machines equipped with advanced automation features such as robotics, programmable logic controllers (PLCs), and human-machine interface (HMI) systems. Automated filling systems not only streamline the production process but also minimize human error, reduce product wastage, and enhance overall productivity. Furthermore, there is a rising trend towards integrating filling machines with other packaging equipment such as capping machines, labeling machines, and conveyors to create fully automated packaging lines. This trend towards automation and integration is driven by the need for cost-effective manufacturing solutions, consistent product quality, and faster time-to-market, shaping the evolution of the filling machine market.
Market Driver: Growing Demand for Packaged Food and Beverages
A key driver fueling the growth of the filling machine market is the increasing demand for packaged food and beverages globally. With changing consumer lifestyles, urbanization, and rising disposable incomes, there is a growing preference for convenience foods, ready-to-drink beverages, and packaged snacks. This surge in demand for packaged products has led to a corresponding increase in the need for efficient and high-speed filling machines across various industries including food and beverage, pharmaceuticals, cosmetics, and household chemicals. Filling machines play a crucial role in accurately filling liquid, semi-liquid, and viscous products into containers of various shapes and sizes, meeting the packaging requirements of diverse product categories. As manufacturers strive to meet consumer demand for a wide range of packaged products while ensuring product integrity and safety, the demand for filling machines continues to rise, driving market growth.
Market Opportunity: Innovation in Sustainable Packaging Solutions
An opportunity within the filling machine market lies in the innovation and adoption of sustainable packaging solutions. With growing awareness of environmental concerns and increasing regulations on plastic usage and waste management, there is a rising demand for eco-friendly packaging materials and processes. Manufacturers of filling machines have the opportunity to capitalize on this trend by developing solutions that enable the efficient filling of sustainable packaging formats such as bio-based plastics, recyclable materials, and compostable packaging. Additionally, there is a growing emphasis on reducing packaging waste and optimizing packaging material usage through technologies such as lightweighting and smart packaging design. By innovating in sustainable packaging solutions and offering filling machines that support the production of eco-friendly packaging formats, manufacturers can address market demand for environmentally responsible packaging solutions and differentiate themselves in the competitive filling machine market.
Filling Machine Market Share Analysis: Aseptic Filling Machines held the dominant market share in 2024
In the Filling Machine market segmented by Product, the Aseptic filling machines emerge as the largest segment. This dominance is attributed to the critical role aseptic filling plays in preserving product integrity, extending shelf life, and ensuring consumer safety, particularly in the pharmaceutical and food and beverage industries. Aseptic filling technology maintains sterile conditions throughout the filling process, minimizing the risk of contamination and microbial growth, making it ideal for sensitive products such as dairy, juices, and pharmaceutical formulations. Further, aseptic filling machines offer high precision, flexibility, and efficiency, enabling manufacturers to meet stringent quality standards and regulatory requirements. Additionally, the increasing demand for convenience foods, ready-to-drink beverages, and pharmaceutical products further drives the adoption of aseptic filling machines. As industries prioritize product safety, quality, and efficiency, the Aseptic filling machines segment continues to lead the Filling Machine market, underlining its significance in meeting evolving consumer demands and industry regulations.
Filling Machine Market Share Analysis: Automatic Mode of Operation market is poised to register the fastest growth rae over the forecast period to 2032
In the Filling Machine market segmented by Mode of Operation, the Automatic segment is the fastest-growing category. This accelerated growth is primarily propelled by the increasing adoption of automation in manufacturing processes to enhance efficiency, productivity, and operational flexibility. Automatic filling machines offer several advantages, including higher throughput, reduced labor costs, and enhanced accuracy, making them preferred choices for industries seeking to streamline production and meet growing consumer demands. Further, advancements in automation technology, such as robotics, sensor integration, and machine learning algorithms, enable seamless integration with existing production lines and real-time monitoring of filling operations, further driving the demand for automatic filling machines. Additionally, the need for stringent quality control measures and compliance with regulatory standards in industries such as pharmaceuticals, cosmetics, and food and beverage manufacturing fuels the adoption of automated filling solutions. As industries increasingly prioritize operational excellence and cost-effectiveness, the Automatic mode of operation segment is poised for continued expansion, solidifying its position as the fastest-growing segment in the Filling Machine market.
Filling Machine Market Share Analysis: Beverages Application held the dominant market share in 2024
In the Filling Machine market segmented by Application, the Beverages segment is the largest category. This dominance is driven by the extensive use of filling machines in the beverage industry for filling various types of liquids, including carbonated drinks, juices, water, alcoholic beverages, and dairy products. The versatility of filling machines in accommodating different container sizes, shapes, and materials, coupled with the robust demand for beverages globally, contributes to the prominence of this segment. Further, the beverage industry's continuous innovation in product formulations, packaging designs, and distribution channels further fuels the demand for filling machines. Additionally, factors such as changing consumer preferences, increasing disposable incomes, and urbanization drive the consumption of beverages, amplifying the need for efficient and high-speed filling solutions. As the beverage market continues to expand, driven by factors like convenience, health consciousness, and premiumization, the Beverages application segment maintains its leadership position in the Filling Machine market.
Filling Machine Market Segmentation
By Product
Aseptic
Rotary
Net Weight
Volumetric
others
By Mode of Operation
Automatic
Semi-automatic
By Application
Beverages
Food
Chemicals
Personal Care
Pharmaceuticals
Others
Countries Analyzed
North America (US, Canada, Mexico)
Europe (Germany, UK, France, Spain, Italy, Russia, Rest of Europe)
Asia Pacific (China, India, Japan, South Korea, Australia, South East Asia, Rest of Asia)
South America (Brazil, Argentina, Rest of South America)
Middle East and Africa (Saudi Arabia, UAE, Rest of Middle East, South Africa, Egypt, Rest of Africa)
Filling Machine Companies Profiled in the Study
Accutek Packaging Equipment Companies Inc
Barry- Wehmiller Companies Inc
Canadian Armour Ltd
Coesia S.p.A.
Compass International Corp Ltd
Gea Group AG
JBT Corp
KHS Group
Krones AG
Robert Bosch GmbH
Ronchi Mario S.P.A.
Tetra Laval International S.A.
*- List Not Exhaustive
Chapter 1. TABLE OF CONTENTS
Chapter 2. Introduction to Filling Machine Market
2.1. Market Overview
2.2. Key Statistics and Report Highlights
2.3. Scope of the Comprehensive Study
2.3.1. Market Definition
2.3.2 Countries and Regions Covered
2.3.3 Research Objective
2.3.4 Units, Currency, and Conversions
2.3.5 Industry Value Chain
2.4. Key Market Segments
2.5. Key Companies
2.6. Study Period
Chapter 3. Strategic Analysis Review
3.1. Filling Machine Pricing Analysis and Forecast
3.2. Porter’s Five Forces
3.3. Market Ecosystem
3.4. SWOT Analysis
3.5. Regulatory Scenario
3.3. Effects of Inflation, Russia-Ukraine War, moderating economic growth, and other macroeconomic factors
Chapter 4. Competitive Landscape
4.1. Market Share Analysis
4.1.1. Global Filling Machine Market Share by Company, 2023
4.1.2. Product Offerings of Leading Filling Machine Companies
4.2. Market Entropy
4.2.1. New Product Launches in the Industry
4.2.2. Mergers, Acquisitions, Joint ventures, and Partnerships
4.3. Key Strategies and Best Practices
Chapter 5. Global Market Projections: Best, Reference, and Low Case Scenarios
5.1. Growth Analysis- Case Scenario Definitions
5.2. Low Growth Case Scenario Forecasts
5.3. Reference Growth Case Scenario Forecasts
5.4. High Growth Case Scenario Forecasts
Chapter 6. Market Dynamics
6.1. Filling Machine Market Drivers
6.2. Filling Machine Market Challenges
6.6. Filling Machine Market Opportunities
6.4. Filling Machine Market Trends
Chapter 7. Global Filling Machine Market Outlook Trends
7.1. Global Filling Machine Revenue (USD Million) and CAGR (%) by Type (2021-2032)
7.2. Global Filling Machine Revenue (USD Million) and CAGR (%) by Application (2021-2032)
7.3. Global Filling Machine Revenue (USD Million) and CAGR (%) by Product (2021-2032)
By Product
Aseptic
Rotary
Net Weight
Volumetric
others
By Mode of Operation
Automatic
Semi-automatic
By Application
Beverages
Food
Chemicals
Personal Care
Pharmaceuticals
Others
Chapter 8. Global Filling Machine Regional Analysis and Outlook
8.1. Global Filling Machine Revenue (USD Million) By Regions (2021- 2032)
8.2. North America Filling Machine Revenue (USD Million) by Country (2021-2032)
8.2.1. United States Filling Machine Regional Analysis and Outlook
8.2.2. Canada Filling Machine Regional Analysis and Outlook
8.2.3. Mexico Filling Machine Regional Analysis and Outlook
8.3. Europe Filling Machine Revenue (USD Million), by Country (2021-2032)
8.3.1. Germany Filling Machine Regional Analysis and Outlook
8.3.2. France Filling Machine Regional Analysis and Outlook
8.3.3. United Kingdom Filling Machine Regional Analysis and Outlook
8.3.4. Spain Filling Machine Regional Analysis and Outlook
8.3.5. Italy Filling Machine Regional Analysis and Outlook
8.3.6. Russia Filling Machine Regional Analysis and Outlook
8.3.7. Rest of Europe Filling Machine Regional Analysis and Outlook
8.4. Asia Pacific Filling Machine Revenue (USD Million) by Country (2021-2032)
8.4.1. China Filling Machine Regional Analysis and Outlook
8.4.2. Japan Filling Machine Regional Analysis and Outlook
8.4.3. India Filling Machine Regional Analysis and Outlook
8.4.4. South Korea Filling Machine Regional Analysis and Outlook
8.4.5. Australia Filling Machine Regional Analysis and Outlook
8.4.6. South East Asia Filling Machine Regional Analysis and Outlook
8.4.7. Rest of Asia Pacific Filling Machine Regional Analysis and Outlook
8.5. South America Filling Machine Revenue (USD Million), by Country (2021-2032)
8.5.1. Brazil Filling Machine Regional Analysis and Outlook
8.5.2. Argentina Filling Machine Regional Analysis and Outlook
8.5.3. Rest of South America Filling Machine Regional Analysis and Outlook
8.6. Middle East and Africa Filling Machine Revenue (USD Million) by Country (2021-2032)
8.6.1. Middle East Filling Machine Regional Analysis and Outlook
8.6.2. Africa Filling Machine Regional Analysis and Outlook
Chapter 9. North America Filling Machine Analysis and Outlook
9.1. North America Filling Machine Revenue (USD Million) by Segments (2021-2032)
9.1.1. North America Filling Machine Revenue (USD Million) by Type (2021-2032)
9.1.2. North America Filling Machine Revenue (USD Million) by Application (2021-2032)
9.1.3. North America Filling Machine Revenue (USD Million) by Product (2021-2032)
By Product
Aseptic
Rotary
Net Weight
Volumetric
others
By Mode of Operation
Automatic
Semi-automatic
By Application
Beverages
Food
Chemicals
Personal Care
Pharmaceuticals
Others
Chapter 10. Europe Filling Machine Analysis and Outlook
10.1. Europe Filling Machine Revenue (USD Million), by Segments (USD Million) (2021-2032)
10.1.1. Europe Filling Machine Revenue (USD Million) by Type (2021-2032)
10.1.2. Europe Filling Machine Revenue (USD Million) by Application (2021-2032)
10.1.3. Europe Filling Machine Revenue (USD Million) by Product (2021-2032)
By Product
Aseptic
Rotary
Net Weight
Volumetric
others
By Mode of Operation
Automatic
Semi-automatic
By Application
Beverages
Food
Chemicals
Personal Care
Pharmaceuticals
Others
Chapter 11. Asia Pacific Filling Machine Analysis and Outlook
11.1. Asia Pacific Filling Machine Revenue (USD Million), and Revenue (USD Million) by Segments (2021-2032)
11.1.1. Asia Pacific Filling Machine Revenue (USD Million) by Type (2021-2032)
11.1.2. Asia Pacific Filling Machine Revenue (USD Million) by Application (2021-2032)
11.1.3. Asia Pacific Filling Machine Revenue (USD Million) by Product (2021-2032)
By Product
Aseptic
Rotary
Net Weight
Volumetric
others
By Mode of Operation
Automatic
Semi-automatic
By Application
Beverages
Food
Chemicals
Personal Care
Pharmaceuticals
Others
Chapter 12. South America Filling Machine Analysis and Outlook
12.1. South America Filling Machine Revenue (USD Million), by Segments (2021-2032)
12.1.1. South America Filling Machine Revenue (USD Million) by Type (2021-2032)
12.1.2. South America Filling Machine Revenue (USD Million) by Application (2021-2032)
12.1.3. South America Filling Machine Revenue (USD Million) by Product (2021-2032)
By Product
Aseptic
Rotary
Net Weight
Volumetric
others
By Mode of Operation
Automatic
Semi-automatic
By Application
Beverages
Food
Chemicals
Personal Care
Pharmaceuticals
Others
Chapter 13. Middle East and Africa Filling Machine Analysis and Outlook
13.1. Middle East and Africa Filling Machine Revenue (USD Million), by Segments (2021-2032)
13.1.1. Middle East and Africa Filling Machine Revenue (USD Million) by Type (2021-2032)
13.1.2. Middle East and Africa Filling Machine Revenue (USD Million) by Application (2021-2032)
13.1.3. Middle East and Africa Filling Machine Revenue (USD Million) by Product (2021-2032)
By Product
Aseptic
Rotary
Net Weight
Volumetric
others
By Mode of Operation
Automatic
Semi-automatic
By Application
Beverages
Food
Chemicals
Personal Care
Pharmaceuticals
Others
Chapter 14. Filling Machine Company Profiles
14.1 Business Overview
14.2 Product Profiles
14.3 SWOT Profiles
14.5 Recent Developments
14.6 Financial Profile
List of Companies
Accutek Packaging Equipment Companies Inc
Barry- Wehmiller Companies Inc
Canadian Armour Ltd
Coesia S.p.A.
Compass International Corp Ltd
Gea Group AG
JBT Corp
KHS Group
Krones AG
Robert Bosch GmbH
Ronchi Mario S.P.A.
Tetra Laval International S.A.
15. Methodology and Data Sources
15.1 Customization Offerings
15.2 Subscription Services
15.3 Related Reports
15.4 Publisher Expertise
LIST OF TABLES
Table 1 Market Segmentation Analysis
Table 2 Global Filling Machine Market Share of Leading Companies, 2023
Table 3 Product Offerings of Leading Companies
Table 4 Low Growth Scenario Forecasts
Table 5 Reference Case Growth Scenario
Table 6 High Growth Case Scenario
Table 7 Global Filling Machine Revenue (USD Million) And CAGR (%) By Type (2021-2032)
Table 8 Global Filling Machine Revenue (USD Million) And CAGR (%) By Application (2021-2032)
Table 9 Global Filling Machine Revenue (USD Million) And CAGR (%) By Product (2021-2032)
Table 10 Global Filling Machine Market Revenue (USD Million) By Regions (2021-2032)
Table 11 Global Filling Machine Market Share (%) By Regions (2021-2032)
Table 12 North America Filling Machine Revenue (USD Million) By Country (2021-2032)
Table 13 Europe Filling Machine Revenue (USD Million) By Country (2021-2032)
Table 14 Asia Pacific Filling Machine Revenue (USD Million) By Country (2021-2032)
Table 15 South America Filling Machine Revenue (USD Million) By Country (2021-2032)
Table 16 Middle East and Africa Filling Machine Revenue (USD Million) By Region (2021-2032)
Table 17 North America Filling Machine Revenue (USD Million) By Type (2021-2032)
Table 18 North America Filling Machine Revenue (USD Million) By Application (2021-2032)
Table 19 North America Filling Machine Revenue (USD Million) By Product (2021-2032)
Table 20 Europe Filling Machine Revenue (USD Million) By Type (2021-2032)
Table 21 Europe Filling Machine Revenue (USD Million) By Application (2021-2032)
Table 22 Europe Filling Machine Revenue (USD Million) By Product (2021-2032)
Table 23 Asia Pacific Filling Machine Revenue (USD Million) By Type (2021-2032)
Table 24 Asia Pacific Filling Machine Revenue (USD Million) By Application (2021-2032)
Table 25 Asia Pacific Filling Machine Revenue (USD Million) By Product (2021-2032)
Table 26 South America Filling Machine Revenue (USD Million) By Type (2021-2032)
Table 27 South America Filling Machine Revenue (USD Million) By Application (2021-2032)
Table 28 South America Filling Machine Revenue (USD Million) By Product (2021-2032)
Table 29 Middle East and Africa Filling Machine Revenue (USD Million) By Type (2021-2032)
Table 30 Middle East and Africa Filling Machine Revenue (USD Million) By Application (2021-2032)
Table 31 Middle East and Africa Filling Machine Revenue (USD Million) By Product (2021-2032)
LIST OF FIGURES
Figure 1. Market Scope
Figure 2. Pricing Forecasts Per Unit, 2023- 2032
Figure 3. Porter’s Five Forces
Figure 4. Global Filling Machine Market Revenue (USD Million) By Regions (2021-2032)
Figure 5. Global Filling Machine Market Share (%) By Regions (2023)
Figure 6. North America Filling Machine Revenue (USD Million) By Country (2021-2032)
Figure 7. United States Filling Machine Revenue (USD Million) By Country (2021-2032)
Figure 8. Canada Filling Machine Revenue (USD Million) By Country (2021-2032)
Figure 9. Mexico Filling Machine Revenue (USD Million) By Country (2021-2032)
Figure 10. Europe Filling Machine Revenue (USD Million) By Country (2021-2032)
Figure 11. Germany Filling Machine Revenue (USD Million) By Country (2021-2032)
Figure 12. France Filling Machine Revenue (USD Million) By Country (2021-2032)
Figure 13. United Kingdom Filling Machine Revenue (USD Million) By Country (2021-2032)
Figure 14. Spain Filling Machine Revenue (USD Million) By Country (2021-2032)
Figure 15. Italy Filling Machine Revenue (USD Million) By Country (2021-2032)
Figure 16. Russia Filling Machine Revenue (USD Million) By Country (2021-2032)
Figure 17. Rest of Europe Filling Machine Revenue (USD Million) By Country (2021-2032)
Figure 11. Asia Pacific Filling Machine Revenue (USD Million) By Country (2021-2032)
Figure 12. China Filling Machine Revenue (USD Million) By Country (2021-2032)
Figure 13. Japan Filling Machine Revenue (USD Million) By Country (2021-2032)
Figure 14. India Filling Machine Revenue (USD Million) By Country (2021-2032)
Figure 15. South Korea Filling Machine Revenue (USD Million) By Country (2021-2032)
Figure 16. Australia Filling Machine Revenue (USD Million) By Country (2021-2032)
Figure 17. South East Asia Filling Machine Revenue (USD Million) By Country (2021-2032)
Figure 18. South America Filling Machine Revenue (USD Million) By Country (2021-2032)
Figure 19. Brazil Filling Machine Revenue (USD Million) By Country (2021-2032)
Figure 20. Argentina Filling Machine Revenue (USD Million) By Country (2021-2032)
Figure 21. Rest of Asia Pacific Filling Machine Revenue (USD Million) By Country (2021-2032)
Figure 22. Middle East and Africa Filling Machine Revenue (USD Million) By Region (2021-2032)
Figure 23. Saudi Arabia Filling Machine Revenue (USD Million) By Region (2021-2032)
Figure 24. The UAE Filling Machine Revenue (USD Million) By Region (2021-2032)
Figure 25. Rest of Middle East Filling Machine Revenue (USD Million) By Region (2021-2032)
Figure 26. South Africa Filling Machine Revenue (USD Million) By Region (2021-2032)
Figure 27. Africa Filling Machine Revenue (USD Million) By Region (2021-2032)
Figure 28. North America Filling Machine Revenue (USD Million) By Type (2021-2032)
Figure 29. North America Filling Machine Revenue (USD Million) By Application (2021-2032)
Figure 30. North America Filling Machine Revenue (USD Million) By Product (2021-2032)
Figure 31. Europe Filling Machine Revenue (USD Million) By Type (2021-2032)
Figure 32. Europe Filling Machine Revenue (USD Million) By Application (2021-2032)
Figure 33. Europe Filling Machine Revenue (USD Million) By Product (2021-2032)
Figure 34. Asia Pacific Filling Machine Revenue (USD Million) By Type (2021-2032)
Figure 35. Asia Pacific Filling Machine Revenue (USD Million) By Application (2021-2032)
Figure 36. Asia Pacific Filling Machine Revenue (USD Million) By Product (2021-2032)
Figure 37. South America Filling Machine Revenue (USD Million) By Type (2021-2032)
Figure 38. South America Filling Machine Revenue (USD Million) By Application (2021-2032)
Figure 39. South America Filling Machine Revenue (USD Million) By Product (2021-2032)
Figure 40. Middle East and Africa Filling Machine Revenue (USD Million) By Type (2021-2032)
Figure 41. Middle East and Africa Filling Machine Revenue (USD Million) By Application (2021-2032)
Figure 42. Middle East and Africa Filling Machine Revenue (USD Million) By Product (2021-2032)
By Product
Aseptic
Rotary
Net Weight
Volumetric
others
By Mode of Operation
Automatic
Semi-automatic
By Application
Beverages
Food
Chemicals
Personal Care
Pharmaceuticals
Others
Countries Analyzed
North America (US, Canada, Mexico)
Europe (Germany, UK, France, Spain, Italy, Russia, Rest of Europe)
Asia Pacific (China, India, Japan, South Korea, Australia, South East Asia, Rest of Asia)
South America (Brazil, Argentina, Rest of South America)
Middle East and Africa (Saudi Arabia, UAE, Rest of Middle East, South Africa, Egypt, Rest of Africa)
