Global Filtered Honey Market Size is valued at $XX Million in 2024 and is forecast to register a growth rate (CAGR) of 6.1% to reach $XX Million by 2032.
The global Filtered Honey Market Comprehensive Study analyzes and forecasts the market size across 6 regions and 24 countries for diverse segments -By Type (Bottle, Jar, Tube, Tub, Others), By Application (Supermarkets/Hypermarkets, Convenience Stores, Specialty Stores, Others)
An Introduction to Filtered Honey Market
In 2024, the Filtered Honey market is experiencing significant growth, driven by the rising demand for high-quality and pure honey products. Filtered honey, known for its smooth texture and extended shelf life, is popular among health-conscious consumers and food manufacturers. The market benefits from advancements in honey filtration and processing technologies, the growing trend of natural and organic foods, and the expansion of the functional food sector. Additionally, the increasing awareness of the health benefits of honey, such as its antioxidant and antibacterial properties, is contributing to market growth.
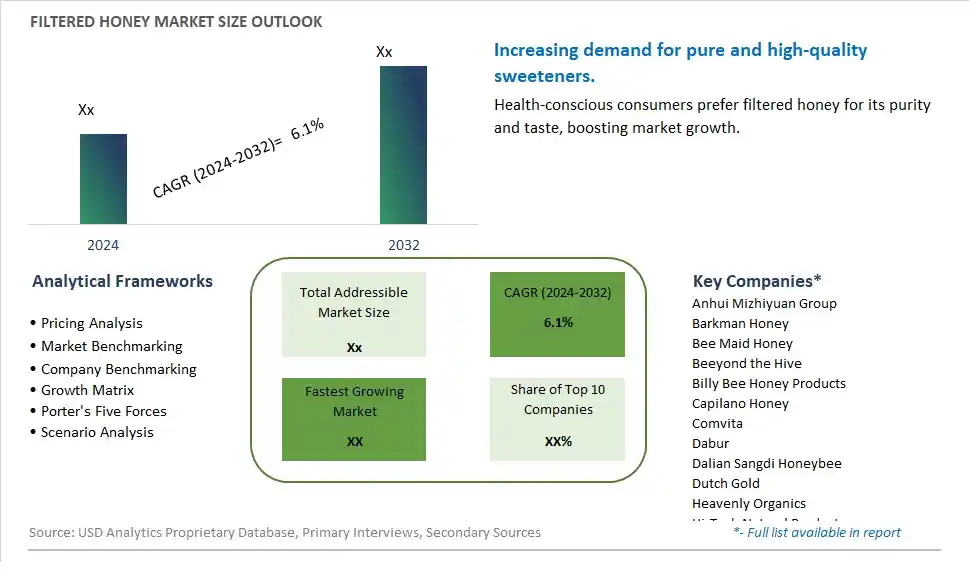
Filtered Honey Competitive Landscape
The market report analyses the leading companies in the industry including Anhui Mizhiyuan Group, Barkman Honey, Bee Maid Honey, Beeyond the Hive, Billy Bee Honey Products, Capilano Honey, Comvita, Dabur, Dalian Sangdi Honeybee, Dutch Gold, Heavenly Organics, Hi-Tech Natural Products, Langnese, Little Bee Impex, Madhava Honey, Manuka Health, Nature Nate's, New Zealand Honey Co., Rowse, Y.S. Organic Bee Farms, and Others.
Filtered Honey Market Dynamics
Filtered Honey Market Trend: Increasing Consumer Preference for Pure and Natural Products
The filtered honey market is experiencing a significant trend towards increasing consumer preference for pure and natural products. As health and wellness continue to be major consumer priorities, there is a growing demand for minimally processed honey that retains its natural nutrients and flavors. Filtered honey, which is free from impurities and retains its essential qualities, is becoming the preferred choice for consumers seeking authenticity and purity in their food products. This trend is driven by a broader movement towards clean eating and a desire for transparency in food sourcing, with consumers actively seeking products that are free from additives and artificial ingredients.
Filtered Honey Market Driver: Rising Awareness of Honey's Health Benefits
The rising awareness of honey's health benefits is a major driver for the filtered honey market. Consumers are increasingly recognizing honey as a natural sweetener with numerous health advantages, including its antioxidant, antibacterial, and anti-inflammatory properties. The growing trend of using natural remedies and functional foods to enhance health and well-being is boosting the demand for high-quality honey. Filtered honey, known for its purity and enhanced shelf life, is seen as a superior option for incorporating these health benefits into daily diets. This awareness is further supported by scientific studies and media coverage highlighting honey's positive effects on health.
Filtered Honey Market Opportunity: Expansion into Specialty and Infused Honey Products
There is a significant opportunity for growth in the filtered honey market through expansion into specialty and infused honey products. Companies can innovate by creating honey products infused with natural flavors such as herbs, spices, and fruits, catering to consumers looking for unique and gourmet food experiences. Additionally, developing specialty honey products that cater to specific health needs, such as honey with added vitamins, probiotics, or herbal extracts, can attract health-conscious consumers. By offering a diverse range of infused and specialty honey products, businesses can differentiate themselves in the market, tap into new consumer segments, and drive overall market growth.
Filtered Honey Market Share Analysis: Bottle is the fastest growing segment over the forecast period to 2032
Bottle is the largest segment in the Filtered Honey Market by Type. Bottled honey is the most popular packaging format due to its convenience, ease of use, and widespread availability. Consumers prefer bottled honey because it is easy to pour and store, making it ideal for daily use in kitchens for sweetening beverages, cooking, and baking. Bottles come in various sizes, catering to different consumer needs, from small household uses to larger quantities for avid honey consumers. Additionally, the transparency of most bottles allows consumers to see the product, which builds trust and assures them of the honey's quality and purity. This segment's dominance is further supported by the significant presence of bottled honey in retail stores, enhancing its accessibility and appeal to a broad range of customers.
Filtered Honey Market Share Analysis: Specialty Stores is the fastest growing segment over the forecast period to 2032
The Specialty Stores segment is projected to be the fastest-growing application in the Filtered Honey Market by 2032. This growth is driven by the increasing consumer interest in high-quality, artisanal, and unique honey products that are often available in specialty stores. These stores cater to discerning customers who seek premium and exotic varieties of honey, which are sourced from specific regions or made from particular types of flowers. Specialty stores often emphasize product authenticity, natural ingredients, and sustainability, appealing to health-conscious and environmentally aware consumers. Further, the personalized shopping experience and expert knowledge offered by specialty store staff enhance customer satisfaction and loyalty. As more consumers turn to natural and health-promoting food products, the demand for specialty honey is expected to rise, making specialty stores the fastest-growing distribution channel in the filtered honey market.
Filtered Honey Market Segmentation
By Type
Bottle
Jar
Tube
Tub
Others
By Application
Supermarkets/Hypermarkets
Convenience Stores
Specialty Stores
Others
Countries Analyzed
North America (US, Canada, Mexico)
Europe (Germany, UK, France, Spain, Italy, Russia, Rest of Europe)
Asia Pacific (China, India, Japan, South Korea, Australia, South East Asia, Rest of Asia)
South America (Brazil, Argentina, Rest of South America)
Middle East and Africa (Saudi Arabia, UAE, Rest of Middle East, South Africa, Egypt, Rest of Africa)
Filtered Honey Companies Profiled in the Study
Anhui Mizhiyuan Group
Barkman Honey
Bee Maid Honey
Beeyond the Hive
Billy Bee Honey Products
Capilano Honey
Comvita
Dabur
Dalian Sangdi Honeybee
Dutch Gold
Heavenly Organics
Hi-Tech Natural Products
Langnese
Little Bee Impex
Madhava Honey
Manuka Health
Nature Nate's
New Zealand Honey Co.
Rowse
Y.S. Organic Bee Farms
*- List Not Exhaustive
Chapter 1. TABLE OF CONTENTS
Chapter 2. Introduction to Filtered Honey Market
2.1. Market Overview
2.2. Key Statistics and Report Highlights
2.3. Scope of the Comprehensive Study
2.3.1. Market Definition
2.3.2 Countries and Regions Covered
2.3.3 Research Objective
2.3.4 Units, Currency, and Conversions
2.3.5 Industry Value Chain
2.4. Key Market Segments
2.5. Key Companies
2.6. Study Period
Chapter 3. Strategic Analysis Review
3.1. Filtered Honey Pricing Analysis and Forecast
3.2. Porter’s Five Forces
3.3. Market Ecosystem
3.4. SWOT Analysis
3.5. Regulatory Scenario
3.3. Effects of Inflation, Russia-Ukraine War, moderating economic growth, and other macroeconomic factors
Chapter 4. Competitive Landscape
4.1. Market Share Analysis
4.1.1. Global Filtered Honey Market Share by Company, 2023
4.1.2. Product Offerings of Leading Filtered Honey Companies
4.2. Market Entropy
4.2.1. New Product Launches in the Industry
4.2.2. Mergers, Acquisitions, Joint ventures, and Partnerships
4.3. Key Strategies and Best Practices
Chapter 5. Global Market Projections: Best, Reference, and Low Case Scenarios
5.1. Growth Analysis- Case Scenario Definitions
5.2. Low Growth Case Scenario Forecasts
5.3. Reference Growth Case Scenario Forecasts
5.4. High Growth Case Scenario Forecasts
Chapter 6. Market Dynamics
6.1. Filtered Honey Market Drivers
6.2. Filtered Honey Market Challenges
6.6. Filtered Honey Market Opportunities
6.4. Filtered Honey Market Trends
Chapter 7. Global Filtered Honey Market Outlook Trends
7.1. Global Filtered Honey Revenue (USD Million) and CAGR (%) by Type (2021-2032)
7.2. Global Filtered Honey Revenue (USD Million) and CAGR (%) by Application (2021-2032)
7.3. Global Filtered Honey Revenue (USD Million) and CAGR (%) by Product (2021-2032)
By Type
Bottle
Jar
Tube
Tub
Others
By Application
Supermarkets/Hypermarkets
Convenience Stores
Specialty Stores
Others
Chapter 8. Global Filtered Honey Regional Analysis and Outlook
8.1. Global Filtered Honey Revenue (USD Million) By Regions (2021- 2032)
8.2. North America Filtered Honey Revenue (USD Million) by Country (2021-2032)
8.2.1. United States Filtered Honey Regional Analysis and Outlook
8.2.2. Canada Filtered Honey Regional Analysis and Outlook
8.2.3. Mexico Filtered Honey Regional Analysis and Outlook
8.3. Europe Filtered Honey Revenue (USD Million), by Country (2021-2032)
8.3.1. Germany Filtered Honey Regional Analysis and Outlook
8.3.2. France Filtered Honey Regional Analysis and Outlook
8.3.3. United Kingdom Filtered Honey Regional Analysis and Outlook
8.3.4. Spain Filtered Honey Regional Analysis and Outlook
8.3.5. Italy Filtered Honey Regional Analysis and Outlook
8.3.6. Russia Filtered Honey Regional Analysis and Outlook
8.3.7. Rest of Europe Filtered Honey Regional Analysis and Outlook
8.4. Asia Pacific Filtered Honey Revenue (USD Million) by Country (2021-2032)
8.4.1. China Filtered Honey Regional Analysis and Outlook
8.4.2. Japan Filtered Honey Regional Analysis and Outlook
8.4.3. India Filtered Honey Regional Analysis and Outlook
8.4.4. South Korea Filtered Honey Regional Analysis and Outlook
8.4.5. Australia Filtered Honey Regional Analysis and Outlook
8.4.6. South East Asia Filtered Honey Regional Analysis and Outlook
8.4.7. Rest of Asia Pacific Filtered Honey Regional Analysis and Outlook
8.5. South America Filtered Honey Revenue (USD Million), by Country (2021-2032)
8.5.1. Brazil Filtered Honey Regional Analysis and Outlook
8.5.2. Argentina Filtered Honey Regional Analysis and Outlook
8.5.3. Rest of South America Filtered Honey Regional Analysis and Outlook
8.6. Middle East and Africa Filtered Honey Revenue (USD Million) by Country (2021-2032)
8.6.1. Middle East Filtered Honey Regional Analysis and Outlook
8.6.2. Africa Filtered Honey Regional Analysis and Outlook
Chapter 9. North America Filtered Honey Analysis and Outlook
9.1. North America Filtered Honey Revenue (USD Million) by Segments (2021-2032)
9.1.1. North America Filtered Honey Revenue (USD Million) by Type (2021-2032)
9.1.2. North America Filtered Honey Revenue (USD Million) by Application (2021-2032)
9.1.3. North America Filtered Honey Revenue (USD Million) by Product (2021-2032)
By Type
Bottle
Jar
Tube
Tub
Others
By Application
Supermarkets/Hypermarkets
Convenience Stores
Specialty Stores
Others
Chapter 10. Europe Filtered Honey Analysis and Outlook
10.1. Europe Filtered Honey Revenue (USD Million), by Segments (USD Million) (2021-2032)
10.1.1. Europe Filtered Honey Revenue (USD Million) by Type (2021-2032)
10.1.2. Europe Filtered Honey Revenue (USD Million) by Application (2021-2032)
10.1.3. Europe Filtered Honey Revenue (USD Million) by Product (2021-2032)
By Type
Bottle
Jar
Tube
Tub
Others
By Application
Supermarkets/Hypermarkets
Convenience Stores
Specialty Stores
Others
Chapter 11. Asia Pacific Filtered Honey Analysis and Outlook
11.1. Asia Pacific Filtered Honey Revenue (USD Million), and Revenue (USD Million) by Segments (2021-2032)
11.1.1. Asia Pacific Filtered Honey Revenue (USD Million) by Type (2021-2032)
11.1.2. Asia Pacific Filtered Honey Revenue (USD Million) by Application (2021-2032)
11.1.3. Asia Pacific Filtered Honey Revenue (USD Million) by Product (2021-2032)
By Type
Bottle
Jar
Tube
Tub
Others
By Application
Supermarkets/Hypermarkets
Convenience Stores
Specialty Stores
Others
Chapter 12. South America Filtered Honey Analysis and Outlook
12.1. South America Filtered Honey Revenue (USD Million), by Segments (2021-2032)
12.1.1. South America Filtered Honey Revenue (USD Million) by Type (2021-2032)
12.1.2. South America Filtered Honey Revenue (USD Million) by Application (2021-2032)
12.1.3. South America Filtered Honey Revenue (USD Million) by Product (2021-2032)
By Type
Bottle
Jar
Tube
Tub
Others
By Application
Supermarkets/Hypermarkets
Convenience Stores
Specialty Stores
Others
Chapter 13. Middle East and Africa Filtered Honey Analysis and Outlook
13.1. Middle East and Africa Filtered Honey Revenue (USD Million), by Segments (2021-2032)
13.1.1. Middle East and Africa Filtered Honey Revenue (USD Million) by Type (2021-2032)
13.1.2. Middle East and Africa Filtered Honey Revenue (USD Million) by Application (2021-2032)
13.1.3. Middle East and Africa Filtered Honey Revenue (USD Million) by Product (2021-2032)
By Type
Bottle
Jar
Tube
Tub
Others
By Application
Supermarkets/Hypermarkets
Convenience Stores
Specialty Stores
Others
Chapter 14. Filtered Honey Company Profiles
14.1 Business Overview
14.2 Product Profiles
14.3 SWOT Profiles
14.5 Recent Developments
14.6 Financial Profile
List of Companies
Anhui Mizhiyuan Group
Barkman Honey
Bee Maid Honey
Beeyond the Hive
Billy Bee Honey Products
Capilano Honey
Comvita
Dabur
Dalian Sangdi Honeybee
Dutch Gold
Heavenly Organics
Hi-Tech Natural Products
Langnese
Little Bee Impex
Madhava Honey
Manuka Health
Nature Nate's
New Zealand Honey Co.
Rowse
Y.S. Organic Bee Farms
15. Methodology and Data Sources
15.1 Customization Offerings
15.2 Subscription Services
15.3 Related Reports
15.4 Publisher Expertise
LIST OF TABLES
Table 1 Market Segmentation Analysis
Table 2 Global Filtered Honey Market Share of Leading Companies, 2023
Table 3 Product Offerings of Leading Companies
Table 4 Low Growth Scenario Forecasts
Table 5 Reference Case Growth Scenario
Table 6 High Growth Case Scenario
Table 7 Global Filtered Honey Revenue (USD Million) And CAGR (%) By Type (2021-2032)
Table 8 Global Filtered Honey Revenue (USD Million) And CAGR (%) By Application (2021-2032)
Table 9 Global Filtered Honey Revenue (USD Million) And CAGR (%) By Product (2021-2032)
Table 10 Global Filtered Honey Market Revenue (USD Million) By Regions (2021-2032)
Table 11 Global Filtered Honey Market Share (%) By Regions (2021-2032)
Table 12 North America Filtered Honey Revenue (USD Million) By Country (2021-2032)
Table 13 Europe Filtered Honey Revenue (USD Million) By Country (2021-2032)
Table 14 Asia Pacific Filtered Honey Revenue (USD Million) By Country (2021-2032)
Table 15 South America Filtered Honey Revenue (USD Million) By Country (2021-2032)
Table 16 Middle East and Africa Filtered Honey Revenue (USD Million) By Region (2021-2032)
Table 17 North America Filtered Honey Revenue (USD Million) By Type (2021-2032)
Table 18 North America Filtered Honey Revenue (USD Million) By Application (2021-2032)
Table 19 North America Filtered Honey Revenue (USD Million) By Product (2021-2032)
Table 20 Europe Filtered Honey Revenue (USD Million) By Type (2021-2032)
Table 21 Europe Filtered Honey Revenue (USD Million) By Application (2021-2032)
Table 22 Europe Filtered Honey Revenue (USD Million) By Product (2021-2032)
Table 23 Asia Pacific Filtered Honey Revenue (USD Million) By Type (2021-2032)
Table 24 Asia Pacific Filtered Honey Revenue (USD Million) By Application (2021-2032)
Table 25 Asia Pacific Filtered Honey Revenue (USD Million) By Product (2021-2032)
Table 26 South America Filtered Honey Revenue (USD Million) By Type (2021-2032)
Table 27 South America Filtered Honey Revenue (USD Million) By Application (2021-2032)
Table 28 South America Filtered Honey Revenue (USD Million) By Product (2021-2032)
Table 29 Middle East and Africa Filtered Honey Revenue (USD Million) By Type (2021-2032)
Table 30 Middle East and Africa Filtered Honey Revenue (USD Million) By Application (2021-2032)
Table 31 Middle East and Africa Filtered Honey Revenue (USD Million) By Product (2021-2032)
LIST OF FIGURES
Figure 1. Market Scope
Figure 2. Pricing Forecasts Per Unit, 2023- 2032
Figure 3. Porter’s Five Forces
Figure 4. Global Filtered Honey Market Revenue (USD Million) By Regions (2021-2032)
Figure 5. Global Filtered Honey Market Share (%) By Regions (2023)
Figure 6. North America Filtered Honey Revenue (USD Million) By Country (2021-2032)
Figure 7. United States Filtered Honey Revenue (USD Million) By Country (2021-2032)
Figure 8. Canada Filtered Honey Revenue (USD Million) By Country (2021-2032)
Figure 9. Mexico Filtered Honey Revenue (USD Million) By Country (2021-2032)
Figure 10. Europe Filtered Honey Revenue (USD Million) By Country (2021-2032)
Figure 11. Germany Filtered Honey Revenue (USD Million) By Country (2021-2032)
Figure 12. France Filtered Honey Revenue (USD Million) By Country (2021-2032)
Figure 13. United Kingdom Filtered Honey Revenue (USD Million) By Country (2021-2032)
Figure 14. Spain Filtered Honey Revenue (USD Million) By Country (2021-2032)
Figure 15. Italy Filtered Honey Revenue (USD Million) By Country (2021-2032)
Figure 16. Russia Filtered Honey Revenue (USD Million) By Country (2021-2032)
Figure 17. Rest of Europe Filtered Honey Revenue (USD Million) By Country (2021-2032)
Figure 11. Asia Pacific Filtered Honey Revenue (USD Million) By Country (2021-2032)
Figure 12. China Filtered Honey Revenue (USD Million) By Country (2021-2032)
Figure 13. Japan Filtered Honey Revenue (USD Million) By Country (2021-2032)
Figure 14. India Filtered Honey Revenue (USD Million) By Country (2021-2032)
Figure 15. South Korea Filtered Honey Revenue (USD Million) By Country (2021-2032)
Figure 16. Australia Filtered Honey Revenue (USD Million) By Country (2021-2032)
Figure 17. South East Asia Filtered Honey Revenue (USD Million) By Country (2021-2032)
Figure 18. South America Filtered Honey Revenue (USD Million) By Country (2021-2032)
Figure 19. Brazil Filtered Honey Revenue (USD Million) By Country (2021-2032)
Figure 20. Argentina Filtered Honey Revenue (USD Million) By Country (2021-2032)
Figure 21. Rest of Asia Pacific Filtered Honey Revenue (USD Million) By Country (2021-2032)
Figure 22. Middle East and Africa Filtered Honey Revenue (USD Million) By Region (2021-2032)
Figure 23. Saudi Arabia Filtered Honey Revenue (USD Million) By Region (2021-2032)
Figure 24. The UAE Filtered Honey Revenue (USD Million) By Region (2021-2032)
Figure 25. Rest of Middle East Filtered Honey Revenue (USD Million) By Region (2021-2032)
Figure 26. South Africa Filtered Honey Revenue (USD Million) By Region (2021-2032)
Figure 27. Africa Filtered Honey Revenue (USD Million) By Region (2021-2032)
Figure 28. North America Filtered Honey Revenue (USD Million) By Type (2021-2032)
Figure 29. North America Filtered Honey Revenue (USD Million) By Application (2021-2032)
Figure 30. North America Filtered Honey Revenue (USD Million) By Product (2021-2032)
Figure 31. Europe Filtered Honey Revenue (USD Million) By Type (2021-2032)
Figure 32. Europe Filtered Honey Revenue (USD Million) By Application (2021-2032)
Figure 33. Europe Filtered Honey Revenue (USD Million) By Product (2021-2032)
Figure 34. Asia Pacific Filtered Honey Revenue (USD Million) By Type (2021-2032)
Figure 35. Asia Pacific Filtered Honey Revenue (USD Million) By Application (2021-2032)
Figure 36. Asia Pacific Filtered Honey Revenue (USD Million) By Product (2021-2032)
Figure 37. South America Filtered Honey Revenue (USD Million) By Type (2021-2032)
Figure 38. South America Filtered Honey Revenue (USD Million) By Application (2021-2032)
Figure 39. South America Filtered Honey Revenue (USD Million) By Product (2021-2032)
Figure 40. Middle East and Africa Filtered Honey Revenue (USD Million) By Type (2021-2032)
Figure 41. Middle East and Africa Filtered Honey Revenue (USD Million) By Application (2021-2032)
Figure 42. Middle East and Africa Filtered Honey Revenue (USD Million) By Product (2021-2032)
By Type
Bottle
Jar
Tube
Tub
Others
By Application
Supermarkets/Hypermarkets
Convenience Stores
Specialty Stores
Others
Countries Analyzed
North America (US, Canada, Mexico)
Europe (Germany, UK, France, Spain, Italy, Russia, Rest of Europe)
Asia Pacific (China, India, Japan, South Korea, Australia, South East Asia, Rest of Asia)
South America (Brazil, Argentina, Rest of South America)
Middle East and Africa (Saudi Arabia, UAE, Rest of Middle East, South Africa, Egypt, Rest of Africa)
