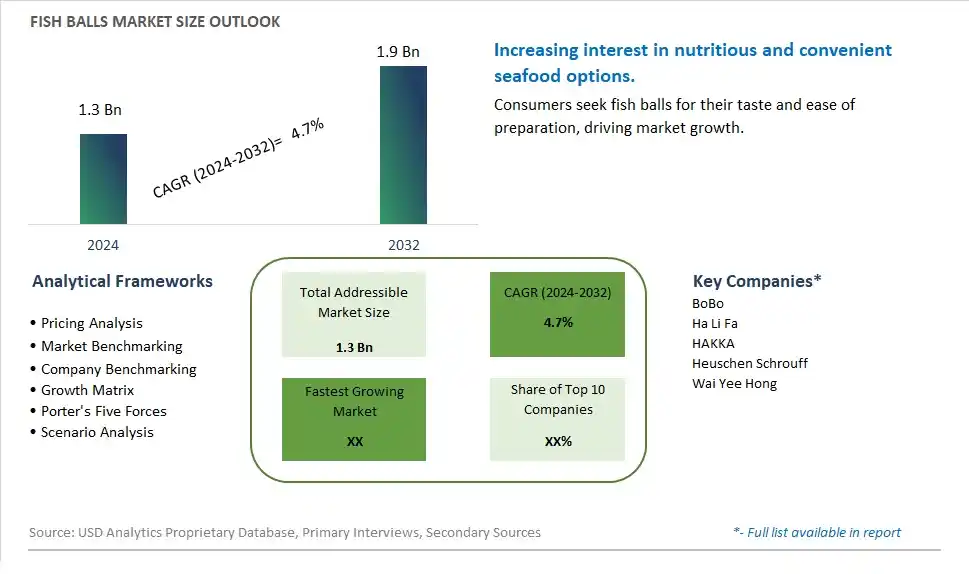
Global Fish Balls Market Size is valued at $1.3 Billion in 2024 and is forecast to register a growth rate (CAGR) of 4.7% to reach $1.9 Billion by 2032.
The global Fish Balls Market Comprehensive Study analyzes and forecasts the market size across 6 regions and 24 countries for diverse segments -By Type (Fresh, Frozen), By Application (), By Distribution Channel (Supermarket/Hypermarket, Specialty Retailers, Convenience Stores, E-Retail, Others)
An Introduction to Fish Balls Market
In 2024, the Fish Balls market is witnessing robust growth, driven by the increasing demand for convenient and nutritious seafood products. Fish balls, a popular ingredient in Asian cuisines, are made from finely ground fish and used in soups, stir-fries, and snacks. The market benefits from advancements in fish processing technologies, the growing trend of frozen and ready-to-eat meals, and the expansion of global culinary diversity. Additionally, the rising awareness of the health benefits of fish, including high protein and omega-3 fatty acids, is contributing to market growth.
Fish Balls Competitive Landscape
The market report analyses the leading companies in the industry including BoBo, Ha Li Fa, HAKKA, Heuschen Schrouff, Wai Yee Hong, and Others.
Fish Balls Market Dynamics
Fish Balls Market Trend: Increasing Popularity of Ready-to-Eat Seafood Products
The fish balls market is experiencing a significant trend towards the increasing popularity of ready-to-eat seafood products. Consumers are seeking convenient, nutritious, and tasty meal options that require minimal preparation. Fish balls, often used in soups, snacks, and stir-fries, fit perfectly into this trend due to their versatility and ease of use. This trend is supported by the busy lifestyles of modern consumers, who prefer quick meal solutions that do not compromise on quality or taste. The global rise in demand for Asian cuisine, where fish balls are a staple, further boosts their popularity in international markets.
Fish Balls Market Driver: Growing Awareness of Health Benefits of Seafood
The growing awareness of the health benefits associated with seafood is a major driver for the fish balls market. Seafood is rich in essential nutrients, including omega-3 fatty acids, proteins, and vitamins, which are known to support heart health, brain function, and overall well-being. As consumers become more health-conscious, there is an increasing demand for seafood products that offer these nutritional benefits. Fish balls, made from various types of fish, provide a convenient way to incorporate seafood into the diet. The trend towards healthy eating and the inclusion of nutrient-rich foods are driving the growth of the fish balls market.
Fish Balls Market Opportunity: Expansion into Specialty and Premium Products
There is a significant opportunity for growth in the fish balls market through expansion into specialty and premium products. Manufacturers can innovate by offering fish balls made from high-quality, sustainably sourced fish and incorporating gourmet ingredients such as herbs, spices, and unique flavorings. Additionally, there is potential to develop fish balls catering to specific dietary preferences, such as low-sodium, gluten-free, or organic options. By diversifying their product lines and focusing on premium, health-focused offerings, companies can attract a broader consumer base, including those seeking specialty and gourmet seafood products, thereby driving market growth.
Fish Balls Market Share Analysis: Frozen segment generated the highest revenue share in the industry
Frozen is the largest segment in the Fish Balls Market by Type. The dominance of this segment is primarily due to the convenience, extended shelf life, and ease of storage that frozen fish balls offer. Frozen fish balls are popular among consumers and food service providers because they can be stored for longer periods without compromising quality, making them a practical choice for both home cooking and commercial use. Additionally, the freezing process helps in maintaining the nutritional value and flavor of the fish balls, ensuring that they remain fresh until consumption. The widespread availability of frozen fish balls in supermarkets and grocery stores further supports their dominance in the market. As lifestyles become busier, the demand for convenient and quick-to-prepare food options like frozen fish balls continues to grow, solidifying their position as the largest segment.
Fish Balls Market Share Analysis: E-Retail is the fastest growing segment over the forecast period to 2032
E-Retail is projected to be the fastest-growing distribution channel in the Fish Balls Market by 2032. The rapid growth of this segment is driven by the increasing consumer preference for online shopping, which offers unparalleled convenience and a wide variety of products. E-retail platforms allow consumers to easily browse and purchase fish balls from the comfort of their homes, with the added benefit of home delivery services. The rise of digital marketing and the use of social media to promote products also contribute to the growth of e-retail. Furthermore, the Past few yearshas accelerated the shift towards online shopping, with many consumers continuing to prefer this mode of purchase for its safety and convenience. As e-retailers improve their logistics and delivery networks, and as consumers become more accustomed to buying groceries online, the e-retail segment is expected to see significant growth, making it the fastest-growing distribution channel in the fish balls market.
Fish Balls Market Segmentation
By Type
Fresh
Frozen
By Application
By Distribution Channel
Supermarket/Hypermarket
Specialty Retailers
Convenience Stores
E-Retail
Others
Countries Analyzed
North America (US, Canada, Mexico)
Europe (Germany, UK, France, Spain, Italy, Russia, Rest of Europe)
Asia Pacific (China, India, Japan, South Korea, Australia, South East Asia, Rest of Asia)
South America (Brazil, Argentina, Rest of South America)
Middle East and Africa (Saudi Arabia, UAE, Rest of Middle East, South Africa, Egypt, Rest of Africa)
Fish Balls Companies Profiled in the Study
BoBo
Ha Li Fa
HAKKA
Heuschen Schrouff
Wai Yee Hong
*- List Not Exhaustive
Chapter 1. TABLE OF CONTENTS
Chapter 2. Introduction to Fish Balls Market
2.1. Market Overview
2.2. Key Statistics and Report Highlights
2.3. Scope of the Comprehensive Study
2.3.1. Market Definition
2.3.2 Countries and Regions Covered
2.3.3 Research Objective
2.3.4 Units, Currency, and Conversions
2.3.5 Industry Value Chain
2.4. Key Market Segments
2.5. Key Companies
2.6. Study Period
Chapter 3. Strategic Analysis Review
3.1. Fish Balls Pricing Analysis and Forecast
3.2. Porter’s Five Forces
3.3. Market Ecosystem
3.4. SWOT Analysis
3.5. Regulatory Scenario
3.3. Effects of Inflation, Russia-Ukraine War, moderating economic growth, and other macroeconomic factors
Chapter 4. Competitive Landscape
4.1. Market Share Analysis
4.1.1. Global Fish Balls Market Share by Company, 2023
4.1.2. Product Offerings of Leading Fish Balls Companies
4.2. Market Entropy
4.2.1. New Product Launches in the Industry
4.2.2. Mergers, Acquisitions, Joint ventures, and Partnerships
4.3. Key Strategies and Best Practices
Chapter 5. Global Market Projections: Best, Reference, and Low Case Scenarios
5.1. Growth Analysis- Case Scenario Definitions
5.2. Low Growth Case Scenario Forecasts
5.3. Reference Growth Case Scenario Forecasts
5.4. High Growth Case Scenario Forecasts
Chapter 6. Market Dynamics
6.1. Fish Balls Market Drivers
6.2. Fish Balls Market Challenges
6.6. Fish Balls Market Opportunities
6.4. Fish Balls Market Trends
Chapter 7. Global Fish Balls Market Outlook Trends
7.1. Global Fish Balls Revenue (USD Million) and CAGR (%) by Type (2021-2032)
7.2. Global Fish Balls Revenue (USD Million) and CAGR (%) by Application (2021-2032)
7.3. Global Fish Balls Revenue (USD Million) and CAGR (%) by Product (2021-2032)
By Type
Fresh
Frozen
By Application
By Distribution Channel
Supermarket/Hypermarket
Specialty Retailers
Convenience Stores
E-Retail
Others
Chapter 8. Global Fish Balls Regional Analysis and Outlook
8.1. Global Fish Balls Revenue (USD Million) By Regions (2021- 2032)
8.2. North America Fish Balls Revenue (USD Million) by Country (2021-2032)
8.2.1. United States Fish Balls Regional Analysis and Outlook
8.2.2. Canada Fish Balls Regional Analysis and Outlook
8.2.3. Mexico Fish Balls Regional Analysis and Outlook
8.3. Europe Fish Balls Revenue (USD Million), by Country (2021-2032)
8.3.1. Germany Fish Balls Regional Analysis and Outlook
8.3.2. France Fish Balls Regional Analysis and Outlook
8.3.3. United Kingdom Fish Balls Regional Analysis and Outlook
8.3.4. Spain Fish Balls Regional Analysis and Outlook
8.3.5. Italy Fish Balls Regional Analysis and Outlook
8.3.6. Russia Fish Balls Regional Analysis and Outlook
8.3.7. Rest of Europe Fish Balls Regional Analysis and Outlook
8.4. Asia Pacific Fish Balls Revenue (USD Million) by Country (2021-2032)
8.4.1. China Fish Balls Regional Analysis and Outlook
8.4.2. Japan Fish Balls Regional Analysis and Outlook
8.4.3. India Fish Balls Regional Analysis and Outlook
8.4.4. South Korea Fish Balls Regional Analysis and Outlook
8.4.5. Australia Fish Balls Regional Analysis and Outlook
8.4.6. South East Asia Fish Balls Regional Analysis and Outlook
8.4.7. Rest of Asia Pacific Fish Balls Regional Analysis and Outlook
8.5. South America Fish Balls Revenue (USD Million), by Country (2021-2032)
8.5.1. Brazil Fish Balls Regional Analysis and Outlook
8.5.2. Argentina Fish Balls Regional Analysis and Outlook
8.5.3. Rest of South America Fish Balls Regional Analysis and Outlook
8.6. Middle East and Africa Fish Balls Revenue (USD Million) by Country (2021-2032)
8.6.1. Middle East Fish Balls Regional Analysis and Outlook
8.6.2. Africa Fish Balls Regional Analysis and Outlook
Chapter 9. North America Fish Balls Analysis and Outlook
9.1. North America Fish Balls Revenue (USD Million) by Segments (2021-2032)
9.1.1. North America Fish Balls Revenue (USD Million) by Type (2021-2032)
9.1.2. North America Fish Balls Revenue (USD Million) by Application (2021-2032)
9.1.3. North America Fish Balls Revenue (USD Million) by Product (2021-2032)
By Type
Fresh
Frozen
By Application
By Distribution Channel
Supermarket/Hypermarket
Specialty Retailers
Convenience Stores
E-Retail
Others
Chapter 10. Europe Fish Balls Analysis and Outlook
10.1. Europe Fish Balls Revenue (USD Million), by Segments (USD Million) (2021-2032)
10.1.1. Europe Fish Balls Revenue (USD Million) by Type (2021-2032)
10.1.2. Europe Fish Balls Revenue (USD Million) by Application (2021-2032)
10.1.3. Europe Fish Balls Revenue (USD Million) by Product (2021-2032)
By Type
Fresh
Frozen
By Application
By Distribution Channel
Supermarket/Hypermarket
Specialty Retailers
Convenience Stores
E-Retail
Others
Chapter 11. Asia Pacific Fish Balls Analysis and Outlook
11.1. Asia Pacific Fish Balls Revenue (USD Million), and Revenue (USD Million) by Segments (2021-2032)
11.1.1. Asia Pacific Fish Balls Revenue (USD Million) by Type (2021-2032)
11.1.2. Asia Pacific Fish Balls Revenue (USD Million) by Application (2021-2032)
11.1.3. Asia Pacific Fish Balls Revenue (USD Million) by Product (2021-2032)
By Type
Fresh
Frozen
By Application
By Distribution Channel
Supermarket/Hypermarket
Specialty Retailers
Convenience Stores
E-Retail
Others
Chapter 12. South America Fish Balls Analysis and Outlook
12.1. South America Fish Balls Revenue (USD Million), by Segments (2021-2032)
12.1.1. South America Fish Balls Revenue (USD Million) by Type (2021-2032)
12.1.2. South America Fish Balls Revenue (USD Million) by Application (2021-2032)
12.1.3. South America Fish Balls Revenue (USD Million) by Product (2021-2032)
By Type
Fresh
Frozen
By Application
By Distribution Channel
Supermarket/Hypermarket
Specialty Retailers
Convenience Stores
E-Retail
Others
Chapter 13. Middle East and Africa Fish Balls Analysis and Outlook
13.1. Middle East and Africa Fish Balls Revenue (USD Million), by Segments (2021-2032)
13.1.1. Middle East and Africa Fish Balls Revenue (USD Million) by Type (2021-2032)
13.1.2. Middle East and Africa Fish Balls Revenue (USD Million) by Application (2021-2032)
13.1.3. Middle East and Africa Fish Balls Revenue (USD Million) by Product (2021-2032)
By Type
Fresh
Frozen
By Application
By Distribution Channel
Supermarket/Hypermarket
Specialty Retailers
Convenience Stores
E-Retail
Others
Chapter 14. Fish Balls Company Profiles
14.1 Business Overview
14.2 Product Profiles
14.3 SWOT Profiles
14.5 Recent Developments
14.6 Financial Profile
List of Companies
BoBo
Ha Li Fa
HAKKA
Heuschen Schrouff
Wai Yee Hong
15. Methodology and Data Sources
15.1 Customization Offerings
15.2 Subscription Services
15.3 Related Reports
15.4 Publisher Expertise
LIST OF TABLES
Table 1 Market Segmentation Analysis
Table 2 Global Fish Balls Market Share of Leading Companies, 2023
Table 3 Product Offerings of Leading Companies
Table 4 Low Growth Scenario Forecasts
Table 5 Reference Case Growth Scenario
Table 6 High Growth Case Scenario
Table 7 Global Fish Balls Revenue (USD Million) And CAGR (%) By Type (2021-2032)
Table 8 Global Fish Balls Revenue (USD Million) And CAGR (%) By Application (2021-2032)
Table 9 Global Fish Balls Revenue (USD Million) And CAGR (%) By Product (2021-2032)
Table 10 Global Fish Balls Market Revenue (USD Million) By Regions (2021-2032)
Table 11 Global Fish Balls Market Share (%) By Regions (2021-2032)
Table 12 North America Fish Balls Revenue (USD Million) By Country (2021-2032)
Table 13 Europe Fish Balls Revenue (USD Million) By Country (2021-2032)
Table 14 Asia Pacific Fish Balls Revenue (USD Million) By Country (2021-2032)
Table 15 South America Fish Balls Revenue (USD Million) By Country (2021-2032)
Table 16 Middle East and Africa Fish Balls Revenue (USD Million) By Region (2021-2032)
Table 17 North America Fish Balls Revenue (USD Million) By Type (2021-2032)
Table 18 North America Fish Balls Revenue (USD Million) By Application (2021-2032)
Table 19 North America Fish Balls Revenue (USD Million) By Product (2021-2032)
Table 20 Europe Fish Balls Revenue (USD Million) By Type (2021-2032)
Table 21 Europe Fish Balls Revenue (USD Million) By Application (2021-2032)
Table 22 Europe Fish Balls Revenue (USD Million) By Product (2021-2032)
Table 23 Asia Pacific Fish Balls Revenue (USD Million) By Type (2021-2032)
Table 24 Asia Pacific Fish Balls Revenue (USD Million) By Application (2021-2032)
Table 25 Asia Pacific Fish Balls Revenue (USD Million) By Product (2021-2032)
Table 26 South America Fish Balls Revenue (USD Million) By Type (2021-2032)
Table 27 South America Fish Balls Revenue (USD Million) By Application (2021-2032)
Table 28 South America Fish Balls Revenue (USD Million) By Product (2021-2032)
Table 29 Middle East and Africa Fish Balls Revenue (USD Million) By Type (2021-2032)
Table 30 Middle East and Africa Fish Balls Revenue (USD Million) By Application (2021-2032)
Table 31 Middle East and Africa Fish Balls Revenue (USD Million) By Product (2021-2032)
LIST OF FIGURES
Figure 1. Market Scope
Figure 2. Pricing Forecasts Per Unit, 2023- 2032
Figure 3. Porter’s Five Forces
Figure 4. Global Fish Balls Market Revenue (USD Million) By Regions (2021-2032)
Figure 5. Global Fish Balls Market Share (%) By Regions (2023)
Figure 6. North America Fish Balls Revenue (USD Million) By Country (2021-2032)
Figure 7. United States Fish Balls Revenue (USD Million) By Country (2021-2032)
Figure 8. Canada Fish Balls Revenue (USD Million) By Country (2021-2032)
Figure 9. Mexico Fish Balls Revenue (USD Million) By Country (2021-2032)
Figure 10. Europe Fish Balls Revenue (USD Million) By Country (2021-2032)
Figure 11. Germany Fish Balls Revenue (USD Million) By Country (2021-2032)
Figure 12. France Fish Balls Revenue (USD Million) By Country (2021-2032)
Figure 13. United Kingdom Fish Balls Revenue (USD Million) By Country (2021-2032)
Figure 14. Spain Fish Balls Revenue (USD Million) By Country (2021-2032)
Figure 15. Italy Fish Balls Revenue (USD Million) By Country (2021-2032)
Figure 16. Russia Fish Balls Revenue (USD Million) By Country (2021-2032)
Figure 17. Rest of Europe Fish Balls Revenue (USD Million) By Country (2021-2032)
Figure 11. Asia Pacific Fish Balls Revenue (USD Million) By Country (2021-2032)
Figure 12. China Fish Balls Revenue (USD Million) By Country (2021-2032)
Figure 13. Japan Fish Balls Revenue (USD Million) By Country (2021-2032)
Figure 14. India Fish Balls Revenue (USD Million) By Country (2021-2032)
Figure 15. South Korea Fish Balls Revenue (USD Million) By Country (2021-2032)
Figure 16. Australia Fish Balls Revenue (USD Million) By Country (2021-2032)
Figure 17. South East Asia Fish Balls Revenue (USD Million) By Country (2021-2032)
Figure 18. South America Fish Balls Revenue (USD Million) By Country (2021-2032)
Figure 19. Brazil Fish Balls Revenue (USD Million) By Country (2021-2032)
Figure 20. Argentina Fish Balls Revenue (USD Million) By Country (2021-2032)
Figure 21. Rest of Asia Pacific Fish Balls Revenue (USD Million) By Country (2021-2032)
Figure 22. Middle East and Africa Fish Balls Revenue (USD Million) By Region (2021-2032)
Figure 23. Saudi Arabia Fish Balls Revenue (USD Million) By Region (2021-2032)
Figure 24. The UAE Fish Balls Revenue (USD Million) By Region (2021-2032)
Figure 25. Rest of Middle East Fish Balls Revenue (USD Million) By Region (2021-2032)
Figure 26. South Africa Fish Balls Revenue (USD Million) By Region (2021-2032)
Figure 27. Africa Fish Balls Revenue (USD Million) By Region (2021-2032)
Figure 28. North America Fish Balls Revenue (USD Million) By Type (2021-2032)
Figure 29. North America Fish Balls Revenue (USD Million) By Application (2021-2032)
Figure 30. North America Fish Balls Revenue (USD Million) By Product (2021-2032)
Figure 31. Europe Fish Balls Revenue (USD Million) By Type (2021-2032)
Figure 32. Europe Fish Balls Revenue (USD Million) By Application (2021-2032)
Figure 33. Europe Fish Balls Revenue (USD Million) By Product (2021-2032)
Figure 34. Asia Pacific Fish Balls Revenue (USD Million) By Type (2021-2032)
Figure 35. Asia Pacific Fish Balls Revenue (USD Million) By Application (2021-2032)
Figure 36. Asia Pacific Fish Balls Revenue (USD Million) By Product (2021-2032)
Figure 37. South America Fish Balls Revenue (USD Million) By Type (2021-2032)
Figure 38. South America Fish Balls Revenue (USD Million) By Application (2021-2032)
Figure 39. South America Fish Balls Revenue (USD Million) By Product (2021-2032)
Figure 40. Middle East and Africa Fish Balls Revenue (USD Million) By Type (2021-2032)
Figure 41. Middle East and Africa Fish Balls Revenue (USD Million) By Application (2021-2032)
Figure 42. Middle East and Africa Fish Balls Revenue (USD Million) By Product (2021-2032)
By Type
Fresh
Frozen
By Application
By Distribution Channel
Supermarket/Hypermarket
Specialty Retailers
Convenience Stores
E-Retail
Others
Countries Analyzed
North America (US, Canada, Mexico)
Europe (Germany, UK, France, Spain, Italy, Russia, Rest of Europe)
Asia Pacific (China, India, Japan, South Korea, Australia, South East Asia, Rest of Asia)
South America (Brazil, Argentina, Rest of South America)
Middle East and Africa (Saudi Arabia, UAE, Rest of Middle East, South Africa, Egypt, Rest of Africa)
