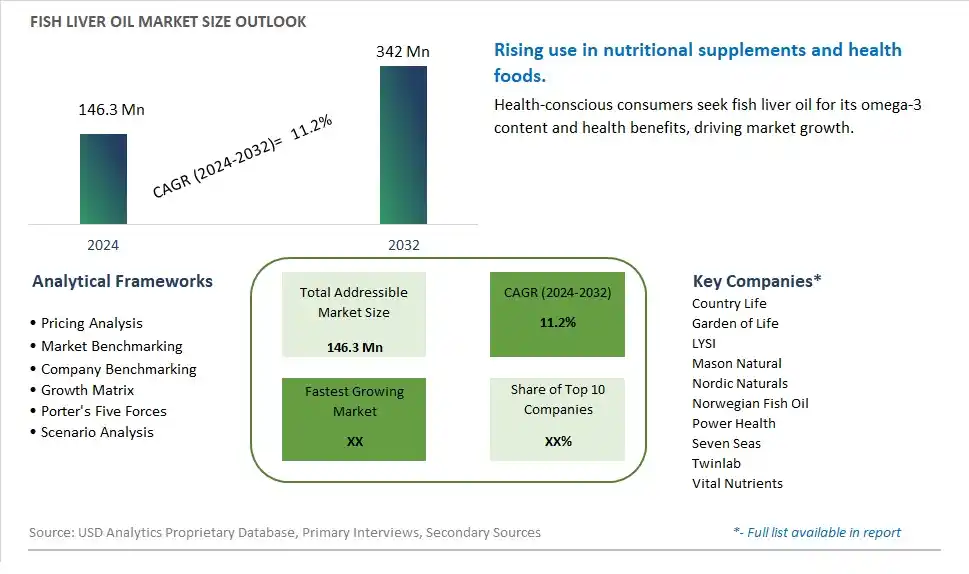
Global Fish Liver Oil Market Size is valued at $146.3 Million in 2024 and is forecast to register a growth rate (CAGR) of 11.2% to reach $342 Million by 2032.
The global Fish Liver Oil Market Comprehensive Study analyzes and forecasts the market size across 6 regions and 24 countries for diverse segments -By Type (Shark Liver Oils, Cod Liver Oil), By Application (Pharmaceuticals, Cosmetics, Animal Feed, Food and Beverages, Others)
An Introduction to Fish Liver Oil Market
In 2024, the Fish Liver Oil market is experiencing significant growth, driven by the increasing demand for natural and nutrient-rich supplements. Fish liver oil, rich in vitamins A and D, as well as omega-3 fatty acids, is popular for its health benefits, including supporting immune function, bone health, and cardiovascular health. The market benefits from advancements in extraction and purification technologies, the growing trend of health and wellness, and the expansion of the dietary supplement sector. Additionally, the rising awareness of the benefits of fish liver oil for overall health and well-being is contributing to market growth.
Fish Liver Oil Competitive Landscape
The market report analyses the leading companies in the industry including Country Life, Garden of Life, LYSI, Mason Natural, Nordic Naturals, Norwegian Fish Oil, Power Health, Seven Seas, Twinlab, Vital Nutrients, and Others.
Fish Liver Oil Market Dynamics
Fish Liver Oil Market Trend: Increasing Demand for Nutraceuticals and Functional Foods
The fish liver oil market is experiencing a significant trend towards the increasing demand for nutraceuticals and functional foods. Consumers are becoming more proactive about their health and are seeking out supplements and food products that offer additional health benefits. Fish liver oil, rich in omega-3 fatty acids, vitamins A and D, is being increasingly incorporated into various dietary supplements and functional food products. This trend is driven by a growing awareness of the importance of preventive healthcare and the role of nutrition in maintaining overall health. The market is seeing a surge in innovative fish liver oil products that cater to health-conscious consumers looking for convenient and effective ways to boost their nutrient intake.
Fish Liver Oil Market Driver: Rising Awareness of the Health Benefits of Omega-3 Fatty Acids
The rising awareness of the health benefits of omega-3 fatty acids is a major driver for the fish liver oil market. Omega-3s are essential for maintaining heart health, reducing inflammation, and supporting cognitive function. As scientific research continues to highlight these benefits, consumers are increasingly incorporating omega-3-rich supplements into their daily routines. Fish liver oil, being a potent source of these fatty acids, is in high demand. The trend towards healthier lifestyles, coupled with the prevalence of chronic diseases such as heart disease and arthritis, is driving consumers to seek out natural and effective solutions like fish liver oil to improve their health outcomes.
Fish Liver Oil Market Opportunity: Expansion into Emerging Markets and Personalized Nutrition
There is a significant opportunity for growth in the fish liver oil market through expansion into emerging markets and personalized nutrition. As disposable incomes rise and health awareness increases in regions such as Asia-Pacific, Latin America, and Africa, the demand for high-quality nutritional supplements is growing. Companies can capitalize on this by expanding their distribution networks and tailoring their marketing strategies to meet the unique needs of these markets. Additionally, the trend towards personalized nutrition presents an opportunity to develop fish liver oil products that cater to individual health needs and preferences. By offering customized formulations and leveraging advancements in nutrigenomics, businesses can attract a broader consumer base and drive market growth.
Fish Liver Oil Market Share Analysis: Cod Liver Oil segment generated the highest revenue share in the industry
Cod Liver Oil is the largest segment in the Fish Liver Oil Market by Type. This segment's dominance is primarily due to the widespread recognition and usage of cod liver oil for its numerous health benefits. Cod liver oil is rich in omega-3 fatty acids, particularly EPA and DHA, as well as vitamins A and D, making it a highly sought-after dietary supplement. Its benefits include promoting heart health, supporting brain function, improving immune system performance, and maintaining healthy bones and joints. The long-standing tradition of using cod liver oil as a health supplement, coupled with extensive scientific research supporting its benefits, ensures its continued popularity. Additionally, cod liver oil's relatively mild taste and versatility in formulation further contribute to its leading position in the market, as it can be easily incorporated into capsules, liquid supplements, and fortified foods.
Fish Liver Oil Market Share Analysis: Pharmaceuticals is the fastest growing segment over the forecast period to 2032
The Pharmaceuticals segment is projected to be the fastest-growing application in the Fish Liver Oil Market by 2032. The growth in this segment is driven by the increasing recognition of the therapeutic benefits of fish liver oil, particularly cod liver oil, in preventing and managing various health conditions. Pharmaceutical companies are incorporating fish liver oil into a range of supplements and medications aimed at improving cardiovascular health, cognitive function, and immune system performance. The high content of omega-3 fatty acids, along with vitamins A and D, makes fish liver oil an essential ingredient in many therapeutic formulations. Furthermore, ongoing research continues to uncover new health benefits and potential therapeutic applications of fish liver oil, driving innovation and expansion in the pharmaceutical sector. As healthcare providers and consumers increasingly prioritize natural and effective health solutions, the demand for fish liver oil in the pharmaceutical industry is expected to grow significantly, making it the fastest-growing application segment in the market.
Fish Liver Oil Market Segmentation
By Type
Shark Liver Oils
Cod Liver Oil
By Application
Pharmaceuticals
Cosmetics
Animal Feed
Food and Beverages
Others
Countries Analyzed
North America (US, Canada, Mexico)
Europe (Germany, UK, France, Spain, Italy, Russia, Rest of Europe)
Asia Pacific (China, India, Japan, South Korea, Australia, South East Asia, Rest of Asia)
South America (Brazil, Argentina, Rest of South America)
Middle East and Africa (Saudi Arabia, UAE, Rest of Middle East, South Africa, Egypt, Rest of Africa)
Fish Liver Oil Companies Profiled in the Study
Country Life
Garden of Life
LYSI
Mason Natural
Nordic Naturals
Norwegian Fish Oil
Power Health
Seven Seas
Twinlab
Vital Nutrients
*- List Not Exhaustive
Chapter 1. TABLE OF CONTENTS
Chapter 2. Introduction to Fish Liver Oil Market
2.1. Market Overview
2.2. Key Statistics and Report Highlights
2.3. Scope of the Comprehensive Study
2.3.1. Market Definition
2.3.2 Countries and Regions Covered
2.3.3 Research Objective
2.3.4 Units, Currency, and Conversions
2.3.5 Industry Value Chain
2.4. Key Market Segments
2.5. Key Companies
2.6. Study Period
Chapter 3. Strategic Analysis Review
3.1. Fish Liver Oil Pricing Analysis and Forecast
3.2. Porter’s Five Forces
3.3. Market Ecosystem
3.4. SWOT Analysis
3.5. Regulatory Scenario
3.3. Effects of Inflation, Russia-Ukraine War, moderating economic growth, and other macroeconomic factors
Chapter 4. Competitive Landscape
4.1. Market Share Analysis
4.1.1. Global Fish Liver Oil Market Share by Company, 2023
4.1.2. Product Offerings of Leading Fish Liver Oil Companies
4.2. Market Entropy
4.2.1. New Product Launches in the Industry
4.2.2. Mergers, Acquisitions, Joint ventures, and Partnerships
4.3. Key Strategies and Best Practices
Chapter 5. Global Market Projections: Best, Reference, and Low Case Scenarios
5.1. Growth Analysis- Case Scenario Definitions
5.2. Low Growth Case Scenario Forecasts
5.3. Reference Growth Case Scenario Forecasts
5.4. High Growth Case Scenario Forecasts
Chapter 6. Market Dynamics
6.1. Fish Liver Oil Market Drivers
6.2. Fish Liver Oil Market Challenges
6.6. Fish Liver Oil Market Opportunities
6.4. Fish Liver Oil Market Trends
Chapter 7. Global Fish Liver Oil Market Outlook Trends
7.1. Global Fish Liver Oil Revenue (USD Million) and CAGR (%) by Type (2021-2032)
7.2. Global Fish Liver Oil Revenue (USD Million) and CAGR (%) by Application (2021-2032)
7.3. Global Fish Liver Oil Revenue (USD Million) and CAGR (%) by Product (2021-2032)
By Type
Shark Liver Oils
Cod Liver Oil
By Application
Pharmaceuticals
Cosmetics
Animal Feed
Food and Beverages
Others
Chapter 8. Global Fish Liver Oil Regional Analysis and Outlook
8.1. Global Fish Liver Oil Revenue (USD Million) By Regions (2021- 2032)
8.2. North America Fish Liver Oil Revenue (USD Million) by Country (2021-2032)
8.2.1. United States Fish Liver Oil Regional Analysis and Outlook
8.2.2. Canada Fish Liver Oil Regional Analysis and Outlook
8.2.3. Mexico Fish Liver Oil Regional Analysis and Outlook
8.3. Europe Fish Liver Oil Revenue (USD Million), by Country (2021-2032)
8.3.1. Germany Fish Liver Oil Regional Analysis and Outlook
8.3.2. France Fish Liver Oil Regional Analysis and Outlook
8.3.3. United Kingdom Fish Liver Oil Regional Analysis and Outlook
8.3.4. Spain Fish Liver Oil Regional Analysis and Outlook
8.3.5. Italy Fish Liver Oil Regional Analysis and Outlook
8.3.6. Russia Fish Liver Oil Regional Analysis and Outlook
8.3.7. Rest of Europe Fish Liver Oil Regional Analysis and Outlook
8.4. Asia Pacific Fish Liver Oil Revenue (USD Million) by Country (2021-2032)
8.4.1. China Fish Liver Oil Regional Analysis and Outlook
8.4.2. Japan Fish Liver Oil Regional Analysis and Outlook
8.4.3. India Fish Liver Oil Regional Analysis and Outlook
8.4.4. South Korea Fish Liver Oil Regional Analysis and Outlook
8.4.5. Australia Fish Liver Oil Regional Analysis and Outlook
8.4.6. South East Asia Fish Liver Oil Regional Analysis and Outlook
8.4.7. Rest of Asia Pacific Fish Liver Oil Regional Analysis and Outlook
8.5. South America Fish Liver Oil Revenue (USD Million), by Country (2021-2032)
8.5.1. Brazil Fish Liver Oil Regional Analysis and Outlook
8.5.2. Argentina Fish Liver Oil Regional Analysis and Outlook
8.5.3. Rest of South America Fish Liver Oil Regional Analysis and Outlook
8.6. Middle East and Africa Fish Liver Oil Revenue (USD Million) by Country (2021-2032)
8.6.1. Middle East Fish Liver Oil Regional Analysis and Outlook
8.6.2. Africa Fish Liver Oil Regional Analysis and Outlook
Chapter 9. North America Fish Liver Oil Analysis and Outlook
9.1. North America Fish Liver Oil Revenue (USD Million) by Segments (2021-2032)
9.1.1. North America Fish Liver Oil Revenue (USD Million) by Type (2021-2032)
9.1.2. North America Fish Liver Oil Revenue (USD Million) by Application (2021-2032)
9.1.3. North America Fish Liver Oil Revenue (USD Million) by Product (2021-2032)
By Type
Shark Liver Oils
Cod Liver Oil
By Application
Pharmaceuticals
Cosmetics
Animal Feed
Food and Beverages
Others
Chapter 10. Europe Fish Liver Oil Analysis and Outlook
10.1. Europe Fish Liver Oil Revenue (USD Million), by Segments (USD Million) (2021-2032)
10.1.1. Europe Fish Liver Oil Revenue (USD Million) by Type (2021-2032)
10.1.2. Europe Fish Liver Oil Revenue (USD Million) by Application (2021-2032)
10.1.3. Europe Fish Liver Oil Revenue (USD Million) by Product (2021-2032)
By Type
Shark Liver Oils
Cod Liver Oil
By Application
Pharmaceuticals
Cosmetics
Animal Feed
Food and Beverages
Others
Chapter 11. Asia Pacific Fish Liver Oil Analysis and Outlook
11.1. Asia Pacific Fish Liver Oil Revenue (USD Million), and Revenue (USD Million) by Segments (2021-2032)
11.1.1. Asia Pacific Fish Liver Oil Revenue (USD Million) by Type (2021-2032)
11.1.2. Asia Pacific Fish Liver Oil Revenue (USD Million) by Application (2021-2032)
11.1.3. Asia Pacific Fish Liver Oil Revenue (USD Million) by Product (2021-2032)
By Type
Shark Liver Oils
Cod Liver Oil
By Application
Pharmaceuticals
Cosmetics
Animal Feed
Food and Beverages
Others
Chapter 12. South America Fish Liver Oil Analysis and Outlook
12.1. South America Fish Liver Oil Revenue (USD Million), by Segments (2021-2032)
12.1.1. South America Fish Liver Oil Revenue (USD Million) by Type (2021-2032)
12.1.2. South America Fish Liver Oil Revenue (USD Million) by Application (2021-2032)
12.1.3. South America Fish Liver Oil Revenue (USD Million) by Product (2021-2032)
By Type
Shark Liver Oils
Cod Liver Oil
By Application
Pharmaceuticals
Cosmetics
Animal Feed
Food and Beverages
Others
Chapter 13. Middle East and Africa Fish Liver Oil Analysis and Outlook
13.1. Middle East and Africa Fish Liver Oil Revenue (USD Million), by Segments (2021-2032)
13.1.1. Middle East and Africa Fish Liver Oil Revenue (USD Million) by Type (2021-2032)
13.1.2. Middle East and Africa Fish Liver Oil Revenue (USD Million) by Application (2021-2032)
13.1.3. Middle East and Africa Fish Liver Oil Revenue (USD Million) by Product (2021-2032)
By Type
Shark Liver Oils
Cod Liver Oil
By Application
Pharmaceuticals
Cosmetics
Animal Feed
Food and Beverages
Others
Chapter 14. Fish Liver Oil Company Profiles
14.1 Business Overview
14.2 Product Profiles
14.3 SWOT Profiles
14.5 Recent Developments
14.6 Financial Profile
List of Companies
Country Life
Garden of Life
LYSI
Mason Natural
Nordic Naturals
Norwegian Fish Oil
Power Health
Seven Seas
Twinlab
Vital Nutrients
15. Methodology and Data Sources
15.1 Customization Offerings
15.2 Subscription Services
15.3 Related Reports
15.4 Publisher Expertise
LIST OF TABLES
Table 1 Market Segmentation Analysis
Table 2 Global Fish Liver Oil Market Share of Leading Companies, 2023
Table 3 Product Offerings of Leading Companies
Table 4 Low Growth Scenario Forecasts
Table 5 Reference Case Growth Scenario
Table 6 High Growth Case Scenario
Table 7 Global Fish Liver Oil Revenue (USD Million) And CAGR (%) By Type (2021-2032)
Table 8 Global Fish Liver Oil Revenue (USD Million) And CAGR (%) By Application (2021-2032)
Table 9 Global Fish Liver Oil Revenue (USD Million) And CAGR (%) By Product (2021-2032)
Table 10 Global Fish Liver Oil Market Revenue (USD Million) By Regions (2021-2032)
Table 11 Global Fish Liver Oil Market Share (%) By Regions (2021-2032)
Table 12 North America Fish Liver Oil Revenue (USD Million) By Country (2021-2032)
Table 13 Europe Fish Liver Oil Revenue (USD Million) By Country (2021-2032)
Table 14 Asia Pacific Fish Liver Oil Revenue (USD Million) By Country (2021-2032)
Table 15 South America Fish Liver Oil Revenue (USD Million) By Country (2021-2032)
Table 16 Middle East and Africa Fish Liver Oil Revenue (USD Million) By Region (2021-2032)
Table 17 North America Fish Liver Oil Revenue (USD Million) By Type (2021-2032)
Table 18 North America Fish Liver Oil Revenue (USD Million) By Application (2021-2032)
Table 19 North America Fish Liver Oil Revenue (USD Million) By Product (2021-2032)
Table 20 Europe Fish Liver Oil Revenue (USD Million) By Type (2021-2032)
Table 21 Europe Fish Liver Oil Revenue (USD Million) By Application (2021-2032)
Table 22 Europe Fish Liver Oil Revenue (USD Million) By Product (2021-2032)
Table 23 Asia Pacific Fish Liver Oil Revenue (USD Million) By Type (2021-2032)
Table 24 Asia Pacific Fish Liver Oil Revenue (USD Million) By Application (2021-2032)
Table 25 Asia Pacific Fish Liver Oil Revenue (USD Million) By Product (2021-2032)
Table 26 South America Fish Liver Oil Revenue (USD Million) By Type (2021-2032)
Table 27 South America Fish Liver Oil Revenue (USD Million) By Application (2021-2032)
Table 28 South America Fish Liver Oil Revenue (USD Million) By Product (2021-2032)
Table 29 Middle East and Africa Fish Liver Oil Revenue (USD Million) By Type (2021-2032)
Table 30 Middle East and Africa Fish Liver Oil Revenue (USD Million) By Application (2021-2032)
Table 31 Middle East and Africa Fish Liver Oil Revenue (USD Million) By Product (2021-2032)
LIST OF FIGURES
Figure 1. Market Scope
Figure 2. Pricing Forecasts Per Unit, 2023- 2032
Figure 3. Porter’s Five Forces
Figure 4. Global Fish Liver Oil Market Revenue (USD Million) By Regions (2021-2032)
Figure 5. Global Fish Liver Oil Market Share (%) By Regions (2023)
Figure 6. North America Fish Liver Oil Revenue (USD Million) By Country (2021-2032)
Figure 7. United States Fish Liver Oil Revenue (USD Million) By Country (2021-2032)
Figure 8. Canada Fish Liver Oil Revenue (USD Million) By Country (2021-2032)
Figure 9. Mexico Fish Liver Oil Revenue (USD Million) By Country (2021-2032)
Figure 10. Europe Fish Liver Oil Revenue (USD Million) By Country (2021-2032)
Figure 11. Germany Fish Liver Oil Revenue (USD Million) By Country (2021-2032)
Figure 12. France Fish Liver Oil Revenue (USD Million) By Country (2021-2032)
Figure 13. United Kingdom Fish Liver Oil Revenue (USD Million) By Country (2021-2032)
Figure 14. Spain Fish Liver Oil Revenue (USD Million) By Country (2021-2032)
Figure 15. Italy Fish Liver Oil Revenue (USD Million) By Country (2021-2032)
Figure 16. Russia Fish Liver Oil Revenue (USD Million) By Country (2021-2032)
Figure 17. Rest of Europe Fish Liver Oil Revenue (USD Million) By Country (2021-2032)
Figure 11. Asia Pacific Fish Liver Oil Revenue (USD Million) By Country (2021-2032)
Figure 12. China Fish Liver Oil Revenue (USD Million) By Country (2021-2032)
Figure 13. Japan Fish Liver Oil Revenue (USD Million) By Country (2021-2032)
Figure 14. India Fish Liver Oil Revenue (USD Million) By Country (2021-2032)
Figure 15. South Korea Fish Liver Oil Revenue (USD Million) By Country (2021-2032)
Figure 16. Australia Fish Liver Oil Revenue (USD Million) By Country (2021-2032)
Figure 17. South East Asia Fish Liver Oil Revenue (USD Million) By Country (2021-2032)
Figure 18. South America Fish Liver Oil Revenue (USD Million) By Country (2021-2032)
Figure 19. Brazil Fish Liver Oil Revenue (USD Million) By Country (2021-2032)
Figure 20. Argentina Fish Liver Oil Revenue (USD Million) By Country (2021-2032)
Figure 21. Rest of Asia Pacific Fish Liver Oil Revenue (USD Million) By Country (2021-2032)
Figure 22. Middle East and Africa Fish Liver Oil Revenue (USD Million) By Region (2021-2032)
Figure 23. Saudi Arabia Fish Liver Oil Revenue (USD Million) By Region (2021-2032)
Figure 24. The UAE Fish Liver Oil Revenue (USD Million) By Region (2021-2032)
Figure 25. Rest of Middle East Fish Liver Oil Revenue (USD Million) By Region (2021-2032)
Figure 26. South Africa Fish Liver Oil Revenue (USD Million) By Region (2021-2032)
Figure 27. Africa Fish Liver Oil Revenue (USD Million) By Region (2021-2032)
Figure 28. North America Fish Liver Oil Revenue (USD Million) By Type (2021-2032)
Figure 29. North America Fish Liver Oil Revenue (USD Million) By Application (2021-2032)
Figure 30. North America Fish Liver Oil Revenue (USD Million) By Product (2021-2032)
Figure 31. Europe Fish Liver Oil Revenue (USD Million) By Type (2021-2032)
Figure 32. Europe Fish Liver Oil Revenue (USD Million) By Application (2021-2032)
Figure 33. Europe Fish Liver Oil Revenue (USD Million) By Product (2021-2032)
Figure 34. Asia Pacific Fish Liver Oil Revenue (USD Million) By Type (2021-2032)
Figure 35. Asia Pacific Fish Liver Oil Revenue (USD Million) By Application (2021-2032)
Figure 36. Asia Pacific Fish Liver Oil Revenue (USD Million) By Product (2021-2032)
Figure 37. South America Fish Liver Oil Revenue (USD Million) By Type (2021-2032)
Figure 38. South America Fish Liver Oil Revenue (USD Million) By Application (2021-2032)
Figure 39. South America Fish Liver Oil Revenue (USD Million) By Product (2021-2032)
Figure 40. Middle East and Africa Fish Liver Oil Revenue (USD Million) By Type (2021-2032)
Figure 41. Middle East and Africa Fish Liver Oil Revenue (USD Million) By Application (2021-2032)
Figure 42. Middle East and Africa Fish Liver Oil Revenue (USD Million) By Product (2021-2032)
By Type
Shark Liver Oils
Cod Liver Oil
By Application
Pharmaceuticals
Cosmetics
Animal Feed
Food and Beverages
Others
Countries Analyzed
North America (US, Canada, Mexico)
Europe (Germany, UK, France, Spain, Italy, Russia, Rest of Europe)
Asia Pacific (China, India, Japan, South Korea, Australia, South East Asia, Rest of Asia)
South America (Brazil, Argentina, Rest of South America)
Middle East and Africa (Saudi Arabia, UAE, Rest of Middle East, South Africa, Egypt, Rest of Africa)
