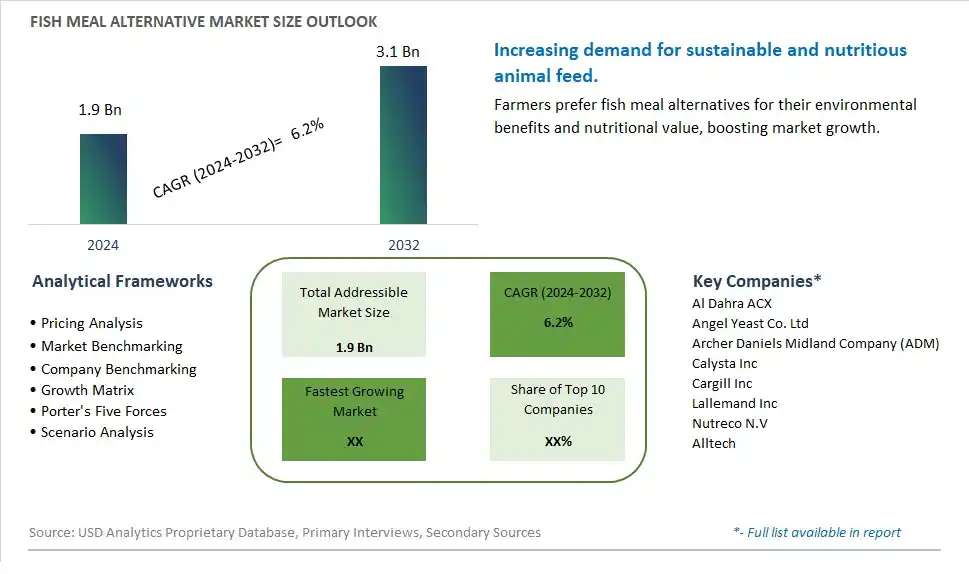
Global Fish Meal Alternative Market Size is valued at $1.9 Billion in 2024 and is forecast to register a growth rate (CAGR) of 6.2% to reach $3.1 Billion by 2032.
The global Fish Meal Alternative Market Comprehensive Study analyzes and forecasts the market size across 6 regions and 24 countries for diverse segments -By Type (Organic, Conventional), By Source (Plant, Peas, Lupins, Corn, Rice, Canola, Rapeseed, Barley, Wheat, Animal, Micro-organism), By Application (Feed, poultry, livestock, pet food, Treats, Fertilizers, Pharmaceuticals, Dietary)
An Introduction to Fish Meal Alternative Market
The Fish Meal Alternative market in 2024 is witnessing robust growth, driven by the increasing demand for sustainable and cost-effective protein sources in aquaculture and livestock feed. Fish meal alternatives, including plant-based proteins, insect meal, and microbial proteins, offer viable options to traditional fish meal, reducing pressure on wild fish stocks. The market benefits from advancements in alternative protein production technologies, the growing trend of sustainable agriculture, and the expansion of the aquaculture industry. Additionally, the increasing focus on environmental conservation and resource efficiency is driving market growth.
Fish Meal Alternative Competitive Landscape
The market report analyses the leading companies in the industry including Al Dahra ACX, Angel Yeast Co. Ltd, Archer Daniels Midland Company (ADM), Calysta Inc, Cargill Inc, Lallemand Inc, Nutreco N.V, Alltech, and Others.
Fish Meal Alternative Market Dynamics
Fish Meal Alternative Market Trend: Growing Interest in Sustainable and Plant-Based Feed Solutions
The fish meal alternative market is witnessing a significant trend towards growing interest in sustainable and plant-based feed solutions. As the global demand for aquaculture products rises, there is increasing concern over the environmental impact of traditional fish meal production, which relies heavily on wild fish stocks. This has led to a surge in the development and adoption of alternative protein sources, such as insect meal, algae, soy protein, and single-cell proteins, that offer a more sustainable approach to aquaculture feed. This trend is driven by the need to reduce overfishing, lower the carbon footprint of feed production, and ensure a stable supply of feed ingredients to meet the growing demands of the aquaculture industry.
Fish Meal Alternative Market Driver: Rising Aquaculture Production and Demand for Sustainable Practices
The rising aquaculture production, coupled with the demand for sustainable practices, is a major driver for the fish meal alternative market. With the global population increasing and seafood consumption on the rise, aquaculture is expanding rapidly to meet the demand. However, the sustainability of traditional fish meal, which is derived from wild-caught fish, is increasingly being questioned due to overfishing and environmental concerns. This has prompted a shift towards alternative feed ingredients that can provide the necessary nutrients without depleting marine resources. Governments and regulatory bodies are also supporting sustainable aquaculture practices through policies and incentives, further driving the adoption of fish meal alternatives.
Fish Meal Alternative Market Opportunity: Innovation in Alternative Protein Sources and Enhanced Nutritional Profiles
There is a significant opportunity for growth in the fish meal alternative market through innovation in alternative protein sources and enhanced nutritional profiles. Companies can invest in research and development to create high-quality, nutritionally balanced feed ingredients from sources such as insects, microalgae, and fermented proteins. These alternatives not only offer sustainability benefits but also have the potential to improve the growth and health of farmed fish. By developing cost-effective and efficient production methods, businesses can make these alternatives more accessible to aquaculture producers. Additionally, marketing these products as environmentally friendly and nutritionally superior can attract aquaculture operations looking to meet consumer demands for sustainable seafood. Expanding into emerging markets with growing aquaculture industries presents another avenue for capturing market share and driving growth.
Fish Meal Alternative Market Share Analysis: Conventional segment generated the highest revenue share in the industry
Conventional is the largest segment in the Fish Meal Alternative Market by Type. This segment's dominance is attributed to the widespread acceptance and established use of conventional fish meal alternatives in various industries, particularly in animal feed. Conventional fish meal alternatives, such as soybean meal, corn gluten meal, and other plant-based proteins, have been extensively researched and proven effective in providing the necessary nutrients for livestock and aquaculture. These alternatives are often more cost-effective compared to organic options, making them a preferred choice for large-scale producers and farmers looking to optimize their feed costs while maintaining high nutritional standards. The reliability, availability, and lower price point of conventional fish meal alternatives contribute to their leading position in the market.
Fish Meal Alternative Market Share Analysis: Micro-organism is the fastest growing segment over the forecast period to 2032
The Micro-organism segment is projected to be the fastest-growing source in the Fish Meal Alternative Market by 2032. This growth is driven by the increasing focus on sustainable and innovative solutions to meet the rising demand for high-quality animal feed. Micro-organisms, such as algae, fungi, and bacteria, offer a highly sustainable alternative to traditional fish meal. They can be cultivated using minimal resources and have a smaller environmental footprint compared to plant and animal-based sources. Algae, for instance, are rich in essential amino acids, omega-3 fatty acids, and other vital nutrients, making them an excellent replacement for fish meal in aquaculture and livestock diets. The rapid advancements in biotechnology and fermentation processes are making the production of micro-organism-based fish meal alternatives more efficient and cost-effective. As sustainability becomes a key priority for the global feed industry, the micro-organism segment is expected to experience significant growth, driven by its potential to revolutionize the market with eco-friendly and nutritionally superior alternatives.
Fish Meal Alternative Market Share Analysis: Feed segment generated the highest revenue share in the industry
Feed is the largest segment in the Fish Meal Alternative Market by Application. This segment's dominance is driven by the extensive use of fish meal alternatives in animal nutrition, particularly in aquaculture, poultry, and livestock industries. Fish meal is a crucial ingredient in animal feed due to its high protein content and essential amino acids, which are vital for the growth and health of animals. However, the sustainability and cost concerns associated with traditional fish meal have led to a growing adoption of alternative protein sources, such as plant-based proteins, insect meal, and micro-organism-based proteins. These alternatives are not only more sustainable but also help reduce the pressure on wild fish stocks, promoting environmental conservation. The feed industry's reliance on high-quality, nutritionally balanced ingredients to meet the dietary needs of animals ensures that the feed segment remains the largest in the market for fish meal alternatives. The continuous advancements in feed formulation and the increasing awareness of sustainable farming practices further support the dominance of this segment.
Fish Meal Alternative Market Share Analysis: Pharmaceuticals is the fastest growing segment over the forecast period to 2032
The Pharmaceuticals segment is projected to be the fastest-growing application in the Fish Meal Alternative Market by 2032. This rapid growth is driven by the increasing recognition of the nutritional and therapeutic benefits of fish meal alternatives, particularly those derived from micro-organisms and plant-based sources. These alternatives are rich in essential nutrients such as omega-3 fatty acids, vitamins, and minerals, which are crucial for human health. The pharmaceutical industry is incorporating these nutrient-dense ingredients into various supplements and therapeutic products aimed at improving cardiovascular health, cognitive function, and overall well-being. The growing trend towards natural and sustainable ingredients in the pharmaceutical sector is also driving the demand for fish meal alternatives. As consumers become more health-conscious and seek out natural remedies and supplements, the pharmaceutical application of fish meal alternatives is expected to experience significant growth, making it the fastest-growing segment in the market.
Fish Meal Alternative Market Segmentation
By Type
Organic
Conventional
By Source
Plant
Peas
Lupins
Corn
Rice
Canola
Rapeseed
Barley
Wheat
Animal
Micro-organism
By Application
Feed
poultry
livestock
pet food
Treats
Fertilizers
Pharmaceuticals
Dietary
Countries Analyzed
North America (US, Canada, Mexico)
Europe (Germany, UK, France, Spain, Italy, Russia, Rest of Europe)
Asia Pacific (China, India, Japan, South Korea, Australia, South East Asia, Rest of Asia)
South America (Brazil, Argentina, Rest of South America)
Middle East and Africa (Saudi Arabia, UAE, Rest of Middle East, South Africa, Egypt, Rest of Africa)
Fish Meal Alternative Companies Profiled in the Study
Al Dahra ACX
Angel Yeast Co. Ltd
Archer Daniels Midland Company (ADM)
Calysta Inc
Cargill Inc
Lallemand Inc
Nutreco N.V
Alltech
*- List Not Exhaustive
Chapter 1. TABLE OF CONTENTS
Chapter 2. Introduction to Fish Meal Alternative Market
2.1. Market Overview
2.2. Key Statistics and Report Highlights
2.3. Scope of the Comprehensive Study
2.3.1. Market Definition
2.3.2 Countries and Regions Covered
2.3.3 Research Objective
2.3.4 Units, Currency, and Conversions
2.3.5 Industry Value Chain
2.4. Key Market Segments
2.5. Key Companies
2.6. Study Period
Chapter 3. Strategic Analysis Review
3.1. Fish Meal Alternative Pricing Analysis and Forecast
3.2. Porter’s Five Forces
3.3. Market Ecosystem
3.4. SWOT Analysis
3.5. Regulatory Scenario
3.3. Effects of Inflation, Russia-Ukraine War, moderating economic growth, and other macroeconomic factors
Chapter 4. Competitive Landscape
4.1. Market Share Analysis
4.1.1. Global Fish Meal Alternative Market Share by Company, 2023
4.1.2. Product Offerings of Leading Fish Meal Alternative Companies
4.2. Market Entropy
4.2.1. New Product Launches in the Industry
4.2.2. Mergers, Acquisitions, Joint ventures, and Partnerships
4.3. Key Strategies and Best Practices
Chapter 5. Global Market Projections: Best, Reference, and Low Case Scenarios
5.1. Growth Analysis- Case Scenario Definitions
5.2. Low Growth Case Scenario Forecasts
5.3. Reference Growth Case Scenario Forecasts
5.4. High Growth Case Scenario Forecasts
Chapter 6. Market Dynamics
6.1. Fish Meal Alternative Market Drivers
6.2. Fish Meal Alternative Market Challenges
6.6. Fish Meal Alternative Market Opportunities
6.4. Fish Meal Alternative Market Trends
Chapter 7. Global Fish Meal Alternative Market Outlook Trends
7.1. Global Fish Meal Alternative Revenue (USD Million) and CAGR (%) by Type (2021-2032)
7.2. Global Fish Meal Alternative Revenue (USD Million) and CAGR (%) by Application (2021-2032)
7.3. Global Fish Meal Alternative Revenue (USD Million) and CAGR (%) by Product (2021-2032)
By Type
Organic
Conventional
By Source
Plant
Peas
Lupins
Corn
Rice
Canola
Rapeseed
Barley
Wheat
Animal
Micro-organism
By Application
Feed
poultry
livestock
pet food
Treats
Fertilizers
Pharmaceuticals
Dietary
Chapter 8. Global Fish Meal Alternative Regional Analysis and Outlook
8.1. Global Fish Meal Alternative Revenue (USD Million) By Regions (2021- 2032)
8.2. North America Fish Meal Alternative Revenue (USD Million) by Country (2021-2032)
8.2.1. United States Fish Meal Alternative Regional Analysis and Outlook
8.2.2. Canada Fish Meal Alternative Regional Analysis and Outlook
8.2.3. Mexico Fish Meal Alternative Regional Analysis and Outlook
8.3. Europe Fish Meal Alternative Revenue (USD Million), by Country (2021-2032)
8.3.1. Germany Fish Meal Alternative Regional Analysis and Outlook
8.3.2. France Fish Meal Alternative Regional Analysis and Outlook
8.3.3. United Kingdom Fish Meal Alternative Regional Analysis and Outlook
8.3.4. Spain Fish Meal Alternative Regional Analysis and Outlook
8.3.5. Italy Fish Meal Alternative Regional Analysis and Outlook
8.3.6. Russia Fish Meal Alternative Regional Analysis and Outlook
8.3.7. Rest of Europe Fish Meal Alternative Regional Analysis and Outlook
8.4. Asia Pacific Fish Meal Alternative Revenue (USD Million) by Country (2021-2032)
8.4.1. China Fish Meal Alternative Regional Analysis and Outlook
8.4.2. Japan Fish Meal Alternative Regional Analysis and Outlook
8.4.3. India Fish Meal Alternative Regional Analysis and Outlook
8.4.4. South Korea Fish Meal Alternative Regional Analysis and Outlook
8.4.5. Australia Fish Meal Alternative Regional Analysis and Outlook
8.4.6. South East Asia Fish Meal Alternative Regional Analysis and Outlook
8.4.7. Rest of Asia Pacific Fish Meal Alternative Regional Analysis and Outlook
8.5. South America Fish Meal Alternative Revenue (USD Million), by Country (2021-2032)
8.5.1. Brazil Fish Meal Alternative Regional Analysis and Outlook
8.5.2. Argentina Fish Meal Alternative Regional Analysis and Outlook
8.5.3. Rest of South America Fish Meal Alternative Regional Analysis and Outlook
8.6. Middle East and Africa Fish Meal Alternative Revenue (USD Million) by Country (2021-2032)
8.6.1. Middle East Fish Meal Alternative Regional Analysis and Outlook
8.6.2. Africa Fish Meal Alternative Regional Analysis and Outlook
Chapter 9. North America Fish Meal Alternative Analysis and Outlook
9.1. North America Fish Meal Alternative Revenue (USD Million) by Segments (2021-2032)
9.1.1. North America Fish Meal Alternative Revenue (USD Million) by Type (2021-2032)
9.1.2. North America Fish Meal Alternative Revenue (USD Million) by Application (2021-2032)
9.1.3. North America Fish Meal Alternative Revenue (USD Million) by Product (2021-2032)
By Type
Organic
Conventional
By Source
Plant
Peas
Lupins
Corn
Rice
Canola
Rapeseed
Barley
Wheat
Animal
Micro-organism
By Application
Feed
poultry
livestock
pet food
Treats
Fertilizers
Pharmaceuticals
Dietary
Chapter 10. Europe Fish Meal Alternative Analysis and Outlook
10.1. Europe Fish Meal Alternative Revenue (USD Million), by Segments (USD Million) (2021-2032)
10.1.1. Europe Fish Meal Alternative Revenue (USD Million) by Type (2021-2032)
10.1.2. Europe Fish Meal Alternative Revenue (USD Million) by Application (2021-2032)
10.1.3. Europe Fish Meal Alternative Revenue (USD Million) by Product (2021-2032)
By Type
Organic
Conventional
By Source
Plant
Peas
Lupins
Corn
Rice
Canola
Rapeseed
Barley
Wheat
Animal
Micro-organism
By Application
Feed
poultry
livestock
pet food
Treats
Fertilizers
Pharmaceuticals
Dietary
Chapter 11. Asia Pacific Fish Meal Alternative Analysis and Outlook
11.1. Asia Pacific Fish Meal Alternative Revenue (USD Million), and Revenue (USD Million) by Segments (2021-2032)
11.1.1. Asia Pacific Fish Meal Alternative Revenue (USD Million) by Type (2021-2032)
11.1.2. Asia Pacific Fish Meal Alternative Revenue (USD Million) by Application (2021-2032)
11.1.3. Asia Pacific Fish Meal Alternative Revenue (USD Million) by Product (2021-2032)
By Type
Organic
Conventional
By Source
Plant
Peas
Lupins
Corn
Rice
Canola
Rapeseed
Barley
Wheat
Animal
Micro-organism
By Application
Feed
poultry
livestock
pet food
Treats
Fertilizers
Pharmaceuticals
Dietary
Chapter 12. South America Fish Meal Alternative Analysis and Outlook
12.1. South America Fish Meal Alternative Revenue (USD Million), by Segments (2021-2032)
12.1.1. South America Fish Meal Alternative Revenue (USD Million) by Type (2021-2032)
12.1.2. South America Fish Meal Alternative Revenue (USD Million) by Application (2021-2032)
12.1.3. South America Fish Meal Alternative Revenue (USD Million) by Product (2021-2032)
By Type
Organic
Conventional
By Source
Plant
Peas
Lupins
Corn
Rice
Canola
Rapeseed
Barley
Wheat
Animal
Micro-organism
By Application
Feed
poultry
livestock
pet food
Treats
Fertilizers
Pharmaceuticals
Dietary
Chapter 13. Middle East and Africa Fish Meal Alternative Analysis and Outlook
13.1. Middle East and Africa Fish Meal Alternative Revenue (USD Million), by Segments (2021-2032)
13.1.1. Middle East and Africa Fish Meal Alternative Revenue (USD Million) by Type (2021-2032)
13.1.2. Middle East and Africa Fish Meal Alternative Revenue (USD Million) by Application (2021-2032)
13.1.3. Middle East and Africa Fish Meal Alternative Revenue (USD Million) by Product (2021-2032)
By Type
Organic
Conventional
By Source
Plant
Peas
Lupins
Corn
Rice
Canola
Rapeseed
Barley
Wheat
Animal
Micro-organism
By Application
Feed
poultry
livestock
pet food
Treats
Fertilizers
Pharmaceuticals
Dietary
Chapter 14. Fish Meal Alternative Company Profiles
14.1 Business Overview
14.2 Product Profiles
14.3 SWOT Profiles
14.5 Recent Developments
14.6 Financial Profile
List of Companies
Al Dahra ACX
Angel Yeast Co. Ltd
Archer Daniels Midland Company (ADM)
Calysta Inc
Cargill Inc
Lallemand Inc
Nutreco N.V
Alltech
15. Methodology and Data Sources
15.1 Customization Offerings
15.2 Subscription Services
15.3 Related Reports
15.4 Publisher Expertise
LIST OF TABLES
Table 1 Market Segmentation Analysis
Table 2 Global Fish Meal Alternative Market Share of Leading Companies, 2023
Table 3 Product Offerings of Leading Companies
Table 4 Low Growth Scenario Forecasts
Table 5 Reference Case Growth Scenario
Table 6 High Growth Case Scenario
Table 7 Global Fish Meal Alternative Revenue (USD Million) And CAGR (%) By Type (2021-2032)
Table 8 Global Fish Meal Alternative Revenue (USD Million) And CAGR (%) By Application (2021-2032)
Table 9 Global Fish Meal Alternative Revenue (USD Million) And CAGR (%) By Product (2021-2032)
Table 10 Global Fish Meal Alternative Market Revenue (USD Million) By Regions (2021-2032)
Table 11 Global Fish Meal Alternative Market Share (%) By Regions (2021-2032)
Table 12 North America Fish Meal Alternative Revenue (USD Million) By Country (2021-2032)
Table 13 Europe Fish Meal Alternative Revenue (USD Million) By Country (2021-2032)
Table 14 Asia Pacific Fish Meal Alternative Revenue (USD Million) By Country (2021-2032)
Table 15 South America Fish Meal Alternative Revenue (USD Million) By Country (2021-2032)
Table 16 Middle East and Africa Fish Meal Alternative Revenue (USD Million) By Region (2021-2032)
Table 17 North America Fish Meal Alternative Revenue (USD Million) By Type (2021-2032)
Table 18 North America Fish Meal Alternative Revenue (USD Million) By Application (2021-2032)
Table 19 North America Fish Meal Alternative Revenue (USD Million) By Product (2021-2032)
Table 20 Europe Fish Meal Alternative Revenue (USD Million) By Type (2021-2032)
Table 21 Europe Fish Meal Alternative Revenue (USD Million) By Application (2021-2032)
Table 22 Europe Fish Meal Alternative Revenue (USD Million) By Product (2021-2032)
Table 23 Asia Pacific Fish Meal Alternative Revenue (USD Million) By Type (2021-2032)
Table 24 Asia Pacific Fish Meal Alternative Revenue (USD Million) By Application (2021-2032)
Table 25 Asia Pacific Fish Meal Alternative Revenue (USD Million) By Product (2021-2032)
Table 26 South America Fish Meal Alternative Revenue (USD Million) By Type (2021-2032)
Table 27 South America Fish Meal Alternative Revenue (USD Million) By Application (2021-2032)
Table 28 South America Fish Meal Alternative Revenue (USD Million) By Product (2021-2032)
Table 29 Middle East and Africa Fish Meal Alternative Revenue (USD Million) By Type (2021-2032)
Table 30 Middle East and Africa Fish Meal Alternative Revenue (USD Million) By Application (2021-2032)
Table 31 Middle East and Africa Fish Meal Alternative Revenue (USD Million) By Product (2021-2032)
LIST OF FIGURES
Figure 1. Market Scope
Figure 2. Pricing Forecasts Per Unit, 2023- 2032
Figure 3. Porter’s Five Forces
Figure 4. Global Fish Meal Alternative Market Revenue (USD Million) By Regions (2021-2032)
Figure 5. Global Fish Meal Alternative Market Share (%) By Regions (2023)
Figure 6. North America Fish Meal Alternative Revenue (USD Million) By Country (2021-2032)
Figure 7. United States Fish Meal Alternative Revenue (USD Million) By Country (2021-2032)
Figure 8. Canada Fish Meal Alternative Revenue (USD Million) By Country (2021-2032)
Figure 9. Mexico Fish Meal Alternative Revenue (USD Million) By Country (2021-2032)
Figure 10. Europe Fish Meal Alternative Revenue (USD Million) By Country (2021-2032)
Figure 11. Germany Fish Meal Alternative Revenue (USD Million) By Country (2021-2032)
Figure 12. France Fish Meal Alternative Revenue (USD Million) By Country (2021-2032)
Figure 13. United Kingdom Fish Meal Alternative Revenue (USD Million) By Country (2021-2032)
Figure 14. Spain Fish Meal Alternative Revenue (USD Million) By Country (2021-2032)
Figure 15. Italy Fish Meal Alternative Revenue (USD Million) By Country (2021-2032)
Figure 16. Russia Fish Meal Alternative Revenue (USD Million) By Country (2021-2032)
Figure 17. Rest of Europe Fish Meal Alternative Revenue (USD Million) By Country (2021-2032)
Figure 11. Asia Pacific Fish Meal Alternative Revenue (USD Million) By Country (2021-2032)
Figure 12. China Fish Meal Alternative Revenue (USD Million) By Country (2021-2032)
Figure 13. Japan Fish Meal Alternative Revenue (USD Million) By Country (2021-2032)
Figure 14. India Fish Meal Alternative Revenue (USD Million) By Country (2021-2032)
Figure 15. South Korea Fish Meal Alternative Revenue (USD Million) By Country (2021-2032)
Figure 16. Australia Fish Meal Alternative Revenue (USD Million) By Country (2021-2032)
Figure 17. South East Asia Fish Meal Alternative Revenue (USD Million) By Country (2021-2032)
Figure 18. South America Fish Meal Alternative Revenue (USD Million) By Country (2021-2032)
Figure 19. Brazil Fish Meal Alternative Revenue (USD Million) By Country (2021-2032)
Figure 20. Argentina Fish Meal Alternative Revenue (USD Million) By Country (2021-2032)
Figure 21. Rest of Asia Pacific Fish Meal Alternative Revenue (USD Million) By Country (2021-2032)
Figure 22. Middle East and Africa Fish Meal Alternative Revenue (USD Million) By Region (2021-2032)
Figure 23. Saudi Arabia Fish Meal Alternative Revenue (USD Million) By Region (2021-2032)
Figure 24. The UAE Fish Meal Alternative Revenue (USD Million) By Region (2021-2032)
Figure 25. Rest of Middle East Fish Meal Alternative Revenue (USD Million) By Region (2021-2032)
Figure 26. South Africa Fish Meal Alternative Revenue (USD Million) By Region (2021-2032)
Figure 27. Africa Fish Meal Alternative Revenue (USD Million) By Region (2021-2032)
Figure 28. North America Fish Meal Alternative Revenue (USD Million) By Type (2021-2032)
Figure 29. North America Fish Meal Alternative Revenue (USD Million) By Application (2021-2032)
Figure 30. North America Fish Meal Alternative Revenue (USD Million) By Product (2021-2032)
Figure 31. Europe Fish Meal Alternative Revenue (USD Million) By Type (2021-2032)
Figure 32. Europe Fish Meal Alternative Revenue (USD Million) By Application (2021-2032)
Figure 33. Europe Fish Meal Alternative Revenue (USD Million) By Product (2021-2032)
Figure 34. Asia Pacific Fish Meal Alternative Revenue (USD Million) By Type (2021-2032)
Figure 35. Asia Pacific Fish Meal Alternative Revenue (USD Million) By Application (2021-2032)
Figure 36. Asia Pacific Fish Meal Alternative Revenue (USD Million) By Product (2021-2032)
Figure 37. South America Fish Meal Alternative Revenue (USD Million) By Type (2021-2032)
Figure 38. South America Fish Meal Alternative Revenue (USD Million) By Application (2021-2032)
Figure 39. South America Fish Meal Alternative Revenue (USD Million) By Product (2021-2032)
Figure 40. Middle East and Africa Fish Meal Alternative Revenue (USD Million) By Type (2021-2032)
Figure 41. Middle East and Africa Fish Meal Alternative Revenue (USD Million) By Application (2021-2032)
Figure 42. Middle East and Africa Fish Meal Alternative Revenue (USD Million) By Product (2021-2032)
By Type
Organic
Conventional
By Source
Plant
Peas
Lupins
Corn
Rice
Canola
Rapeseed
Barley
Wheat
Animal
Micro-organism
By Application
Feed
poultry
livestock
pet food
Treats
Fertilizers
Pharmaceuticals
Dietary
Countries Analyzed
North America (US, Canada, Mexico)
Europe (Germany, UK, France, Spain, Italy, Russia, Rest of Europe)
Asia Pacific (China, India, Japan, South Korea, Australia, South East Asia, Rest of Asia)
South America (Brazil, Argentina, Rest of South America)
Middle East and Africa (Saudi Arabia, UAE, Rest of Middle East, South Africa, Egypt, Rest of Africa)
