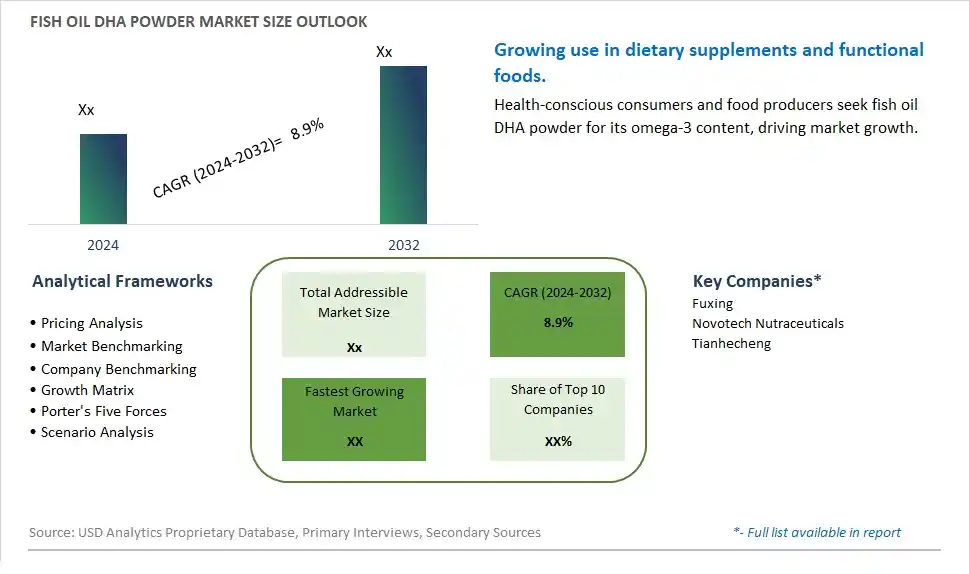
Global Fish Oil DHA Powder Market Size is valued at $XX Million in 2024 and is forecast to register a growth rate (CAGR) of 8.9% to reach $XX Million by 2032.
The global Fish Oil DHA Powder Market Comprehensive Study analyzes and forecasts the market size across 6 regions and 24 countries for diverse segments -By Type (Content Below 10%, Content 10 to 20%, Others), By Application (Infant Formula, Dietary Supplements, Food and Beverage, Others)
An Introduction to Fish Oil DHA Powder Market
The Fish Oil DHA Powder market in 2024 is experiencing significant growth, driven by the rising demand for convenient and stable sources of omega-3 fatty acids. Fish oil DHA powder, used in dietary supplements, infant formulas, and functional foods, offers the health benefits of DHA in an easy-to-use powdered form. The market benefits from advancements in microencapsulation and drying technologies, the growing trend of health and wellness, and the expansion of the functional food sector. Additionally, the increasing awareness of the cognitive and cardiovascular benefits of DHA is contributing to market growth.
Fish Oil DHA Powder Competitive Landscape
The market report analyses the leading companies in the industry including Fuxing, Novotech Nutraceuticals, Tianhecheng, and Others.
Fish Oil DHA Powder Market Dynamics
Fish Oil DHA Powder Market Trend: Increasing Demand for Functional Foods and Dietary Supplements
The fish oil DHA powder market is experiencing a significant trend towards the increasing demand for functional foods and dietary supplements. Consumers are becoming more aware of the health benefits of DHA, an omega-3 fatty acid crucial for brain development, cardiovascular health, and anti-inflammatory properties. This trend is fueled by the growing interest in preventive healthcare and the desire to incorporate essential nutrients into everyday diets conveniently. Fish oil DHA powder is being widely used in various applications, including fortified foods, beverages, and dietary supplements, as it offers an easy way to enhance nutritional content without altering taste or texture.
Fish Oil DHA Powder Market Driver: Rising Health Awareness and Aging Population
The rising health awareness and the aging population are major drivers for the fish oil DHA powder market. As the global population ages, there is an increasing focus on maintaining cognitive health, heart health, and overall well-being. DHA, known for its positive impact on brain function and cardiovascular health, is in high demand among older adults and health-conscious consumers. This demographic is actively seeking supplements and fortified foods that support healthy aging and disease prevention. Additionally, increased public and scientific awareness of DHA’s benefits is driving consumer interest and influencing purchasing decisions towards products containing fish oil DHA powder.
Fish Oil DHA Powder Market Opportunity: Expansion into Infant Nutrition and Personalized Nutrition Solutions
There is a significant opportunity for growth in the fish oil DHA powder market through expansion into infant nutrition and personalized nutrition solutions. DHA is essential for the brain and eye development of infants, making it a critical component in infant formula and baby food products. Manufacturers can capitalize on this by developing high-quality DHA-enriched products targeted at new parents seeking the best nutrition for their children. Furthermore, the trend towards personalized nutrition offers a chance to create tailored DHA supplements based on individual health needs and genetic profiles. By focusing on these specific market segments, companies can drive innovation, meet diverse consumer demands, and enhance market growth.
Fish Oil DHA Powder Market Share Analysis: Content 10 to 20% segment generated the highest revenue share in the industry
Content 10 to 20% is the largest segment in the Fish Oil DHA Powder Market by Type. This segment's dominance is attributed to the optimal balance it offers between potency and ease of incorporation into various products. Fish oil DHA powder with a DHA content of 10 to 20% is highly sought after because it provides a substantial amount of DHA, an omega-3 fatty acid essential for brain development, heart health, and overall wellness, without compromising on taste and texture. This concentration level is particularly favored in the production of dietary supplements, infant formulas, and functional foods, where maintaining a balance between efficacy and palatability is crucial. The versatility of this DHA content range allows manufacturers to formulate products that cater to a wide range of health needs and consumer preferences, supporting its position as the largest segment in the market.
Fish Oil DHA Powder Market Share Analysis: Infant Formula is the fastest growing segment over the forecast period to 2032
The Infant Formula segment is projected to be the fastest-growing application in the Fish Oil DHA Powder Market by 2032. This rapid growth is driven by the increasing awareness of the critical role DHA plays in the cognitive and visual development of infants. DHA is a major structural component of the brain and retina, and its inclusion in infant formula is essential for mimicking the nutritional profile of breast milk. As more parents seek high-quality, nutritionally complete alternatives to breast milk, the demand for DHA-fortified infant formulas continues to rise. Regulatory bodies and health organizations worldwide are also endorsing the inclusion of DHA in infant nutrition, further propelling the growth of this segment. Additionally, advancements in formulation technology have made it easier to incorporate fish oil DHA powder into infant formulas without affecting taste or stability, making it a preferred choice for manufacturers aiming to meet the growing market demand. The emphasis on early childhood nutrition and the ongoing research highlighting the benefits of DHA will drive the significant expansion of the infant formula segment in the coming years.
Fish Oil DHA Powder Market Segmentation
By Type
Content Below 10%
Content 10 to 20%
Others
By Application
Infant Formula
Dietary Supplements
Food and Beverage
Others
Countries Analyzed
North America (US, Canada, Mexico)
Europe (Germany, UK, France, Spain, Italy, Russia, Rest of Europe)
Asia Pacific (China, India, Japan, South Korea, Australia, South East Asia, Rest of Asia)
South America (Brazil, Argentina, Rest of South America)
Middle East and Africa (Saudi Arabia, UAE, Rest of Middle East, South Africa, Egypt, Rest of Africa)
Fish Oil DHA Powder Companies Profiled in the Study
Fuxing
Novotech Nutraceuticals
Tianhecheng
*- List Not Exhaustive
Chapter 1. TABLE OF CONTENTS
Chapter 2. Introduction to Fish Oil DHA Powder Market
2.1. Market Overview
2.2. Key Statistics and Report Highlights
2.3. Scope of the Comprehensive Study
2.3.1. Market Definition
2.3.2 Countries and Regions Covered
2.3.3 Research Objective
2.3.4 Units, Currency, and Conversions
2.3.5 Industry Value Chain
2.4. Key Market Segments
2.5. Key Companies
2.6. Study Period
Chapter 3. Strategic Analysis Review
3.1. Fish Oil DHA Powder Pricing Analysis and Forecast
3.2. Porter’s Five Forces
3.3. Market Ecosystem
3.4. SWOT Analysis
3.5. Regulatory Scenario
3.3. Effects of Inflation, Russia-Ukraine War, moderating economic growth, and other macroeconomic factors
Chapter 4. Competitive Landscape
4.1. Market Share Analysis
4.1.1. Global Fish Oil DHA Powder Market Share by Company, 2023
4.1.2. Product Offerings of Leading Fish Oil DHA Powder Companies
4.2. Market Entropy
4.2.1. New Product Launches in the Industry
4.2.2. Mergers, Acquisitions, Joint ventures, and Partnerships
4.3. Key Strategies and Best Practices
Chapter 5. Global Market Projections: Best, Reference, and Low Case Scenarios
5.1. Growth Analysis- Case Scenario Definitions
5.2. Low Growth Case Scenario Forecasts
5.3. Reference Growth Case Scenario Forecasts
5.4. High Growth Case Scenario Forecasts
Chapter 6. Market Dynamics
6.1. Fish Oil DHA Powder Market Drivers
6.2. Fish Oil DHA Powder Market Challenges
6.6. Fish Oil DHA Powder Market Opportunities
6.4. Fish Oil DHA Powder Market Trends
Chapter 7. Global Fish Oil DHA Powder Market Outlook Trends
7.1. Global Fish Oil DHA Powder Revenue (USD Million) and CAGR (%) by Type (2021-2032)
7.2. Global Fish Oil DHA Powder Revenue (USD Million) and CAGR (%) by Application (2021-2032)
7.3. Global Fish Oil DHA Powder Revenue (USD Million) and CAGR (%) by Product (2021-2032)
By Type
Content Below 10%
Content 10 to 20%
Others
By Application
Infant Formula
Dietary Supplements
Food and Beverage
Others
Chapter 8. Global Fish Oil DHA Powder Regional Analysis and Outlook
8.1. Global Fish Oil DHA Powder Revenue (USD Million) By Regions (2021- 2032)
8.2. North America Fish Oil DHA Powder Revenue (USD Million) by Country (2021-2032)
8.2.1. United States Fish Oil DHA Powder Regional Analysis and Outlook
8.2.2. Canada Fish Oil DHA Powder Regional Analysis and Outlook
8.2.3. Mexico Fish Oil DHA Powder Regional Analysis and Outlook
8.3. Europe Fish Oil DHA Powder Revenue (USD Million), by Country (2021-2032)
8.3.1. Germany Fish Oil DHA Powder Regional Analysis and Outlook
8.3.2. France Fish Oil DHA Powder Regional Analysis and Outlook
8.3.3. United Kingdom Fish Oil DHA Powder Regional Analysis and Outlook
8.3.4. Spain Fish Oil DHA Powder Regional Analysis and Outlook
8.3.5. Italy Fish Oil DHA Powder Regional Analysis and Outlook
8.3.6. Russia Fish Oil DHA Powder Regional Analysis and Outlook
8.3.7. Rest of Europe Fish Oil DHA Powder Regional Analysis and Outlook
8.4. Asia Pacific Fish Oil DHA Powder Revenue (USD Million) by Country (2021-2032)
8.4.1. China Fish Oil DHA Powder Regional Analysis and Outlook
8.4.2. Japan Fish Oil DHA Powder Regional Analysis and Outlook
8.4.3. India Fish Oil DHA Powder Regional Analysis and Outlook
8.4.4. South Korea Fish Oil DHA Powder Regional Analysis and Outlook
8.4.5. Australia Fish Oil DHA Powder Regional Analysis and Outlook
8.4.6. South East Asia Fish Oil DHA Powder Regional Analysis and Outlook
8.4.7. Rest of Asia Pacific Fish Oil DHA Powder Regional Analysis and Outlook
8.5. South America Fish Oil DHA Powder Revenue (USD Million), by Country (2021-2032)
8.5.1. Brazil Fish Oil DHA Powder Regional Analysis and Outlook
8.5.2. Argentina Fish Oil DHA Powder Regional Analysis and Outlook
8.5.3. Rest of South America Fish Oil DHA Powder Regional Analysis and Outlook
8.6. Middle East and Africa Fish Oil DHA Powder Revenue (USD Million) by Country (2021-2032)
8.6.1. Middle East Fish Oil DHA Powder Regional Analysis and Outlook
8.6.2. Africa Fish Oil DHA Powder Regional Analysis and Outlook
Chapter 9. North America Fish Oil DHA Powder Analysis and Outlook
9.1. North America Fish Oil DHA Powder Revenue (USD Million) by Segments (2021-2032)
9.1.1. North America Fish Oil DHA Powder Revenue (USD Million) by Type (2021-2032)
9.1.2. North America Fish Oil DHA Powder Revenue (USD Million) by Application (2021-2032)
9.1.3. North America Fish Oil DHA Powder Revenue (USD Million) by Product (2021-2032)
By Type
Content Below 10%
Content 10 to 20%
Others
By Application
Infant Formula
Dietary Supplements
Food and Beverage
Others
Chapter 10. Europe Fish Oil DHA Powder Analysis and Outlook
10.1. Europe Fish Oil DHA Powder Revenue (USD Million), by Segments (USD Million) (2021-2032)
10.1.1. Europe Fish Oil DHA Powder Revenue (USD Million) by Type (2021-2032)
10.1.2. Europe Fish Oil DHA Powder Revenue (USD Million) by Application (2021-2032)
10.1.3. Europe Fish Oil DHA Powder Revenue (USD Million) by Product (2021-2032)
By Type
Content Below 10%
Content 10 to 20%
Others
By Application
Infant Formula
Dietary Supplements
Food and Beverage
Others
Chapter 11. Asia Pacific Fish Oil DHA Powder Analysis and Outlook
11.1. Asia Pacific Fish Oil DHA Powder Revenue (USD Million), and Revenue (USD Million) by Segments (2021-2032)
11.1.1. Asia Pacific Fish Oil DHA Powder Revenue (USD Million) by Type (2021-2032)
11.1.2. Asia Pacific Fish Oil DHA Powder Revenue (USD Million) by Application (2021-2032)
11.1.3. Asia Pacific Fish Oil DHA Powder Revenue (USD Million) by Product (2021-2032)
By Type
Content Below 10%
Content 10 to 20%
Others
By Application
Infant Formula
Dietary Supplements
Food and Beverage
Others
Chapter 12. South America Fish Oil DHA Powder Analysis and Outlook
12.1. South America Fish Oil DHA Powder Revenue (USD Million), by Segments (2021-2032)
12.1.1. South America Fish Oil DHA Powder Revenue (USD Million) by Type (2021-2032)
12.1.2. South America Fish Oil DHA Powder Revenue (USD Million) by Application (2021-2032)
12.1.3. South America Fish Oil DHA Powder Revenue (USD Million) by Product (2021-2032)
By Type
Content Below 10%
Content 10 to 20%
Others
By Application
Infant Formula
Dietary Supplements
Food and Beverage
Others
Chapter 13. Middle East and Africa Fish Oil DHA Powder Analysis and Outlook
13.1. Middle East and Africa Fish Oil DHA Powder Revenue (USD Million), by Segments (2021-2032)
13.1.1. Middle East and Africa Fish Oil DHA Powder Revenue (USD Million) by Type (2021-2032)
13.1.2. Middle East and Africa Fish Oil DHA Powder Revenue (USD Million) by Application (2021-2032)
13.1.3. Middle East and Africa Fish Oil DHA Powder Revenue (USD Million) by Product (2021-2032)
By Type
Content Below 10%
Content 10 to 20%
Others
By Application
Infant Formula
Dietary Supplements
Food and Beverage
Others
Chapter 14. Fish Oil DHA Powder Company Profiles
14.1 Business Overview
14.2 Product Profiles
14.3 SWOT Profiles
14.5 Recent Developments
14.6 Financial Profile
List of Companies
Fuxing
Novotech Nutraceuticals
Tianhecheng
15. Methodology and Data Sources
15.1 Customization Offerings
15.2 Subscription Services
15.3 Related Reports
15.4 Publisher Expertise
LIST OF TABLES
Table 1 Market Segmentation Analysis
Table 2 Global Fish Oil DHA Powder Market Share of Leading Companies, 2023
Table 3 Product Offerings of Leading Companies
Table 4 Low Growth Scenario Forecasts
Table 5 Reference Case Growth Scenario
Table 6 High Growth Case Scenario
Table 7 Global Fish Oil DHA Powder Revenue (USD Million) And CAGR (%) By Type (2021-2032)
Table 8 Global Fish Oil DHA Powder Revenue (USD Million) And CAGR (%) By Application (2021-2032)
Table 9 Global Fish Oil DHA Powder Revenue (USD Million) And CAGR (%) By Product (2021-2032)
Table 10 Global Fish Oil DHA Powder Market Revenue (USD Million) By Regions (2021-2032)
Table 11 Global Fish Oil DHA Powder Market Share (%) By Regions (2021-2032)
Table 12 North America Fish Oil DHA Powder Revenue (USD Million) By Country (2021-2032)
Table 13 Europe Fish Oil DHA Powder Revenue (USD Million) By Country (2021-2032)
Table 14 Asia Pacific Fish Oil DHA Powder Revenue (USD Million) By Country (2021-2032)
Table 15 South America Fish Oil DHA Powder Revenue (USD Million) By Country (2021-2032)
Table 16 Middle East and Africa Fish Oil DHA Powder Revenue (USD Million) By Region (2021-2032)
Table 17 North America Fish Oil DHA Powder Revenue (USD Million) By Type (2021-2032)
Table 18 North America Fish Oil DHA Powder Revenue (USD Million) By Application (2021-2032)
Table 19 North America Fish Oil DHA Powder Revenue (USD Million) By Product (2021-2032)
Table 20 Europe Fish Oil DHA Powder Revenue (USD Million) By Type (2021-2032)
Table 21 Europe Fish Oil DHA Powder Revenue (USD Million) By Application (2021-2032)
Table 22 Europe Fish Oil DHA Powder Revenue (USD Million) By Product (2021-2032)
Table 23 Asia Pacific Fish Oil DHA Powder Revenue (USD Million) By Type (2021-2032)
Table 24 Asia Pacific Fish Oil DHA Powder Revenue (USD Million) By Application (2021-2032)
Table 25 Asia Pacific Fish Oil DHA Powder Revenue (USD Million) By Product (2021-2032)
Table 26 South America Fish Oil DHA Powder Revenue (USD Million) By Type (2021-2032)
Table 27 South America Fish Oil DHA Powder Revenue (USD Million) By Application (2021-2032)
Table 28 South America Fish Oil DHA Powder Revenue (USD Million) By Product (2021-2032)
Table 29 Middle East and Africa Fish Oil DHA Powder Revenue (USD Million) By Type (2021-2032)
Table 30 Middle East and Africa Fish Oil DHA Powder Revenue (USD Million) By Application (2021-2032)
Table 31 Middle East and Africa Fish Oil DHA Powder Revenue (USD Million) By Product (2021-2032)
LIST OF FIGURES
Figure 1. Market Scope
Figure 2. Pricing Forecasts Per Unit, 2023- 2032
Figure 3. Porter’s Five Forces
Figure 4. Global Fish Oil DHA Powder Market Revenue (USD Million) By Regions (2021-2032)
Figure 5. Global Fish Oil DHA Powder Market Share (%) By Regions (2023)
Figure 6. North America Fish Oil DHA Powder Revenue (USD Million) By Country (2021-2032)
Figure 7. United States Fish Oil DHA Powder Revenue (USD Million) By Country (2021-2032)
Figure 8. Canada Fish Oil DHA Powder Revenue (USD Million) By Country (2021-2032)
Figure 9. Mexico Fish Oil DHA Powder Revenue (USD Million) By Country (2021-2032)
Figure 10. Europe Fish Oil DHA Powder Revenue (USD Million) By Country (2021-2032)
Figure 11. Germany Fish Oil DHA Powder Revenue (USD Million) By Country (2021-2032)
Figure 12. France Fish Oil DHA Powder Revenue (USD Million) By Country (2021-2032)
Figure 13. United Kingdom Fish Oil DHA Powder Revenue (USD Million) By Country (2021-2032)
Figure 14. Spain Fish Oil DHA Powder Revenue (USD Million) By Country (2021-2032)
Figure 15. Italy Fish Oil DHA Powder Revenue (USD Million) By Country (2021-2032)
Figure 16. Russia Fish Oil DHA Powder Revenue (USD Million) By Country (2021-2032)
Figure 17. Rest of Europe Fish Oil DHA Powder Revenue (USD Million) By Country (2021-2032)
Figure 11. Asia Pacific Fish Oil DHA Powder Revenue (USD Million) By Country (2021-2032)
Figure 12. China Fish Oil DHA Powder Revenue (USD Million) By Country (2021-2032)
Figure 13. Japan Fish Oil DHA Powder Revenue (USD Million) By Country (2021-2032)
Figure 14. India Fish Oil DHA Powder Revenue (USD Million) By Country (2021-2032)
Figure 15. South Korea Fish Oil DHA Powder Revenue (USD Million) By Country (2021-2032)
Figure 16. Australia Fish Oil DHA Powder Revenue (USD Million) By Country (2021-2032)
Figure 17. South East Asia Fish Oil DHA Powder Revenue (USD Million) By Country (2021-2032)
Figure 18. South America Fish Oil DHA Powder Revenue (USD Million) By Country (2021-2032)
Figure 19. Brazil Fish Oil DHA Powder Revenue (USD Million) By Country (2021-2032)
Figure 20. Argentina Fish Oil DHA Powder Revenue (USD Million) By Country (2021-2032)
Figure 21. Rest of Asia Pacific Fish Oil DHA Powder Revenue (USD Million) By Country (2021-2032)
Figure 22. Middle East and Africa Fish Oil DHA Powder Revenue (USD Million) By Region (2021-2032)
Figure 23. Saudi Arabia Fish Oil DHA Powder Revenue (USD Million) By Region (2021-2032)
Figure 24. The UAE Fish Oil DHA Powder Revenue (USD Million) By Region (2021-2032)
Figure 25. Rest of Middle East Fish Oil DHA Powder Revenue (USD Million) By Region (2021-2032)
Figure 26. South Africa Fish Oil DHA Powder Revenue (USD Million) By Region (2021-2032)
Figure 27. Africa Fish Oil DHA Powder Revenue (USD Million) By Region (2021-2032)
Figure 28. North America Fish Oil DHA Powder Revenue (USD Million) By Type (2021-2032)
Figure 29. North America Fish Oil DHA Powder Revenue (USD Million) By Application (2021-2032)
Figure 30. North America Fish Oil DHA Powder Revenue (USD Million) By Product (2021-2032)
Figure 31. Europe Fish Oil DHA Powder Revenue (USD Million) By Type (2021-2032)
Figure 32. Europe Fish Oil DHA Powder Revenue (USD Million) By Application (2021-2032)
Figure 33. Europe Fish Oil DHA Powder Revenue (USD Million) By Product (2021-2032)
Figure 34. Asia Pacific Fish Oil DHA Powder Revenue (USD Million) By Type (2021-2032)
Figure 35. Asia Pacific Fish Oil DHA Powder Revenue (USD Million) By Application (2021-2032)
Figure 36. Asia Pacific Fish Oil DHA Powder Revenue (USD Million) By Product (2021-2032)
Figure 37. South America Fish Oil DHA Powder Revenue (USD Million) By Type (2021-2032)
Figure 38. South America Fish Oil DHA Powder Revenue (USD Million) By Application (2021-2032)
Figure 39. South America Fish Oil DHA Powder Revenue (USD Million) By Product (2021-2032)
Figure 40. Middle East and Africa Fish Oil DHA Powder Revenue (USD Million) By Type (2021-2032)
Figure 41. Middle East and Africa Fish Oil DHA Powder Revenue (USD Million) By Application (2021-2032)
Figure 42. Middle East and Africa Fish Oil DHA Powder Revenue (USD Million) By Product (2021-2032)
By Type
Content Below 10%
Content 10 to 20%
Others
By Application
Infant Formula
Dietary Supplements
Food and Beverage
Others
Countries Analyzed
North America (US, Canada, Mexico)
Europe (Germany, UK, France, Spain, Italy, Russia, Rest of Europe)
Asia Pacific (China, India, Japan, South Korea, Australia, South East Asia, Rest of Asia)
South America (Brazil, Argentina, Rest of South America)
Middle East and Africa (Saudi Arabia, UAE, Rest of Middle East, South Africa, Egypt, Rest of Africa)
