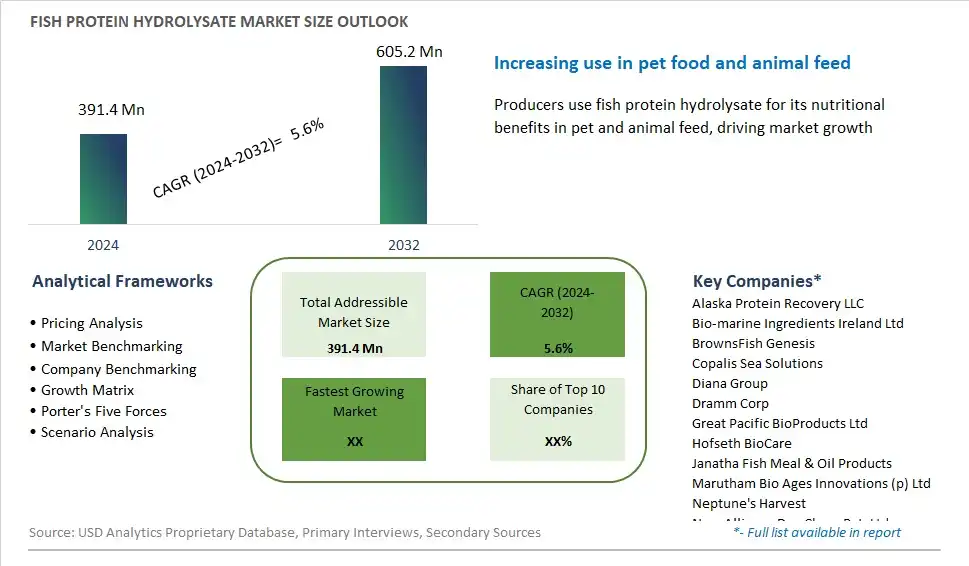
Global Fish Protein Hydrolysate Market Size is valued at $391.4 Million in 2024 and is forecast to register a growth rate (CAGR) of 5.6% to reach $605.2 Million by 2032.
The global Fish Protein Hydrolysate Market Comprehensive Study analyzes and forecasts the market size across 6 regions and 24 countries for diverse segments -By Technology (Acid Hydrolysis, Autolytic Hydrolysis, Enzymatic Hydrolysis), By Form (Powder, Liquid), By Source (Anchovy, Herrings, Menhaden, Sardine, Shads, Others), By Application (Food, Pharmaceuticals, Animal Feed & Pet Food, Cosmetics, Others)
An Introduction to Fish Protein Hydrolysate Market
Fish protein hydrolysate is a nutritional ingredient derived from the enzymatic hydrolysis of fish protein into smaller peptides and amino acids in 2024. This process breaks down the protein molecules present in fish into more digestible and bioavailable forms, resulting in a protein-rich extract with enhanced nutritional benefits. Fish protein hydrolysate is valued for its high protein content, balanced amino acid profile, and bioactive peptides, which have been associated with various health benefits, including muscle recovery, weight management, and cardiovascular health. It is commonly used as a functional ingredient in dietary supplements, sports nutrition products, functional foods, and animal feed formulations. Fish protein hydrolysate is also utilized in cosmetic and personal care products for its skin-boosting and anti-aging properties. With growing consumer interest in protein-rich diets, clean label ingredients, and sustainable food sources, the market for fish protein hydrolysate is expanding. Manufacturers are investing in advanced processing technologies and sustainable sourcing practices to produce high-quality hydrolysates from a variety of fish species, catering to the diverse needs and preferences of consumers seeking natural, nutritious, and eco-friendly protein alternatives for their diets and lifestyles.
Fish Protein Hydrolysate Competitive Landscape
The market report analyses the leading companies in the industry including Alaska Protein Recovery LLC, Bio-marine Ingredients Ireland Ltd, BrownsFish Genesis, Copalis Sea Solutions, Diana Group, Dramm Corp, Great Pacific BioProducts Ltd, Hofseth BioCare, Janatha Fish Meal & Oil Products, Marutham Bio Ages Innovations (p) Ltd, Neptune's Harvest, New Alliance Dye Chem Pvt. Ltd, Sampi, Scanbio, Shenzhen Taier, Sopropeche, U.S. Ag Florida Inc, United Fisheries, and Others.
Fish Protein Hydrolysate Market Dynamics
Fish Protein Hydrolysate Market Trend: Growing Demand for Sustainable and Functional Ingredients
A notable trend in the fish protein hydrolysate market is the increasing consumer preference for sustainable and functional ingredients in food, beverage, and nutritional products. As consumers become more health-conscious and environmentally aware, there is a rising demand for natural and eco-friendly sources of protein. Fish protein hydrolysate, derived from seafood processing by-products, offers a sustainable solution to meet this demand, as it utilizes otherwise underutilized fish parts and contributes to reducing waste in the seafood industry. Additionally, fish protein hydrolysate is valued for its functional properties, such as solubility, emulsifying capacity, and bioactivity, making it an attractive ingredient for formulating functional foods, beverages, and supplements targeted at health-conscious consumers seeking products that offer both nutritional benefits and sustainability credentials.
Market Driver: Increasing Consumer Interest in Nutritional and Sports Supplements
A key driver of the fish protein hydrolysate market is the growing consumer interest in nutritional and sports supplements aimed at supporting overall health, fitness, and performance. With the rising popularity of active lifestyles and wellness-focused diets, consumers are seeking protein-rich products to fuel their workouts, aid in muscle recovery, and support their nutritional needs. Fish protein hydrolysate, known for its high protein content, rapid absorption, and amino acid profile, is gaining traction as a preferred protein source in sports nutrition and dietary supplement formulations. The demand for fish protein hydrolysate is further fueled by its potential health benefits, including muscle-building properties, satiety enhancement, and support for weight management. As consumers continue to prioritize health and wellness, the market for fish protein hydrolysate is expected to expand, driven by the growing demand for protein-rich supplements across diverse consumer demographics.
Market Opportunity: Expansion into Functional Food and Beverage Applications
An opportunity for the fish protein hydrolysate market lies in the expansion into functional food and beverage applications, where there is a growing demand for protein-fortified products that offer added health benefits. Fish protein hydrolysate can be incorporated into a wide range of food and beverage formulations, including ready-to-drink beverages, protein bars, snacks, and dairy alternatives, to enhance their nutritional profile and functional properties. By leveraging the solubility, flavor neutrality, and bioactivity of fish protein hydrolysate, manufacturers can develop innovative and value-added products that cater to evolving consumer preferences for convenient, nutritious, and functional foods and beverages. Additionally, the functional food and beverage market presents opportunities for differentiation and product innovation, allowing companies to target specific health and wellness trends, such as sports nutrition, weight management, and healthy aging, and capitalize on the growing consumer demand for protein-rich, functional products.
Fish Protein Hydrolysate Market Share Analysis: Enzymatic Hydrolysis held the dominant market share in 2024
In the Fish Protein Hydrolysate Market segmented by Technology, Enzymatic Hydrolysis is the largest and most significant segment. This dominance is primarily attributed to the numerous advantages offered by enzymatic hydrolysis in the production of fish protein hydrolysates. Enzymatic hydrolysis involves the use of specific enzymes to break down proteins into smaller peptides and amino acids, resulting in hydrolysates with superior nutritional profiles and bioavailability. Compared to other methods such as acid hydrolysis and autolytic hydrolysis, enzymatic hydrolysis produces hydrolysates with minimal degradation of essential nutrients and bioactive compounds, ensuring the retention of valuable nutritional properties. Additionally, enzymatic hydrolysis allows for precise control over the hydrolysis process, enabling manufacturers to tailor the characteristics and functionalities of fish protein hydrolysates to meet specific application requirements in food, dietary supplements, and pharmaceutical products. Furthermore, enzymatic hydrolysis is considered a more environmentally friendly and sustainable technology, as it does not involve the use of harsh chemicals or high temperatures, reducing the environmental footprint of the production process. As a result, the Enzymatic Hydrolysis segment maintains its leadership position in the Fish Protein Hydrolysate Market, driven by its superior nutritional quality, versatility, and sustainability credentials, which align with the growing consumer demand for natural, high-quality protein ingredients.
Fish Protein Hydrolysate Market Share Analysis: Liquid market is poised to register the fastest growth rae over the forecast period to 2032
Within the Fish Protein Hydrolysate Market segmented by Form, the Liquid category is the fastest growing segment. This accelerated growth can be attributed to several key factors. Firstly, liquid fish protein hydrolysates offer greater versatility and ease of use compared to powdered counterparts. Liquid formulations can be readily incorporated into a wide range of food, beverage, and nutritional products without the need for additional processing steps, making them ideal for applications such as functional beverages, sports drinks, and liquid supplements. Further, liquid hydrolysates are preferred for their faster absorption rates and improved bioavailability, enabling quicker delivery of essential nutrients and bioactive compounds to the body. Additionally, the rising demand for convenient and on-the-go nutrition solutions drives the popularity of liquid fish protein hydrolysates among health-conscious consumers seeking convenient and portable options for meeting their dietary needs. Furthermore, the versatility of liquid formulations allows for innovative product development and formulation flexibility, catering to diverse consumer preferences and market trends. As a result, the Liquid segment within the Fish Protein Hydrolysate Market experiences rapid expansion, driven by its convenience, functionality, and suitability for a wide range of applications in the food, beverage, and nutritional industries.
Fish Protein Hydrolysate Market Share Analysis: Anchovy held the dominant market share in 2024
In the Fish Protein Hydrolysate Market segmented by Source, Anchovy is the largest and most significant segment. This dominance can be attributed to several key factors. Firstly, anchovies are one of the most abundant and widely harvested fish species globally, providing a consistent and readily available source of raw material for fish protein hydrolysate production. The high protein content and favorable amino acid profile of anchovies make them particularly well-suited for hydrolysis, resulting in hydrolysates with superior nutritional value and functional properties. Further, anchovies are known for their rich flavor profile and umami taste, which enhances the palatability of fish protein hydrolysates and makes them suitable for use in a wide range of food, beverage, and nutritional applications. Additionally, the sustainable harvesting practices employed in anchovy fisheries, along with stringent quality control measures throughout the production process, ensure the reliability and consistency of anchovy-derived fish protein hydrolysates, further bolstering their market demand. Furthermore, the versatility of anchovy-based hydrolysates allows for their incorporation into various products such as pet food, aquaculture feed, dietary supplements, and functional foods, driving their widespread adoption across different industries. As a result, the Anchovy segment maintains its leadership position in the Fish Protein Hydrolysate Market, supported by its abundant availability, nutritional superiority, and versatile applicability in diverse end-use applications.
Fish Protein Hydrolysate Market Segmentation
By Technology
Acid Hydrolysis
Autolytic Hydrolysis
Enzymatic Hydrolysis
By Form
Powder
Liquid
By Source
Anchovy
Herrings
Menhaden
Sardine
Shads
Others
By Application
Food
Pharmaceuticals
Animal Feed & Pet Food
Cosmetics
Others
Countries Analyzed
North America (US, Canada, Mexico)
Europe (Germany, UK, France, Spain, Italy, Russia, Rest of Europe)
Asia Pacific (China, India, Japan, South Korea, Australia, South East Asia, Rest of Asia)
South America (Brazil, Argentina, Rest of South America)
Middle East and Africa (Saudi Arabia, UAE, Rest of Middle East, South Africa, Egypt, Rest of Africa)
Fish Protein Hydrolysate Companies Profiled in the Study
Alaska Protein Recovery LLC
Bio-marine Ingredients Ireland Ltd
BrownsFish Genesis
Copalis Sea Solutions
Diana Group
Dramm Corp
Great Pacific BioProducts Ltd
Hofseth BioCare
Janatha Fish Meal & Oil Products
Marutham Bio Ages Innovations (p) Ltd
Neptune's Harvest
New Alliance Dye Chem Pvt. Ltd
Sampi
Scanbio
Shenzhen Taier
Sopropeche
U.S. Ag Florida Inc
United Fisheries
*- List Not Exhaustive
Chapter 1. TABLE OF CONTENTS
Chapter 2. Introduction to Fish Protein Hydrolysate Market
2.1. Market Overview
2.2. Key Statistics and Report Highlights
2.3. Scope of the Comprehensive Study
2.3.1. Market Definition
2.3.2 Countries and Regions Covered
2.3.3 Research Objective
2.3.4 Units, Currency, and Conversions
2.3.5 Industry Value Chain
2.4. Key Market Segments
2.5. Key Companies
2.6. Study Period
Chapter 3. Strategic Analysis Review
3.1. Fish Protein Hydrolysate Pricing Analysis and Forecast
3.2. Porter’s Five Forces
3.3. Market Ecosystem
3.4. SWOT Analysis
3.5. Regulatory Scenario
3.3. Effects of Inflation, Russia-Ukraine War, moderating economic growth, and other macroeconomic factors
Chapter 4. Competitive Landscape
4.1. Market Share Analysis
4.1.1. Global Fish Protein Hydrolysate Market Share by Company, 2023
4.1.2. Product Offerings of Leading Fish Protein Hydrolysate Companies
4.2. Market Entropy
4.2.1. New Product Launches in the Industry
4.2.2. Mergers, Acquisitions, Joint ventures, and Partnerships
4.3. Key Strategies and Best Practices
Chapter 5. Global Market Projections: Best, Reference, and Low Case Scenarios
5.1. Growth Analysis- Case Scenario Definitions
5.2. Low Growth Case Scenario Forecasts
5.3. Reference Growth Case Scenario Forecasts
5.4. High Growth Case Scenario Forecasts
Chapter 6. Market Dynamics
6.1. Fish Protein Hydrolysate Market Drivers
6.2. Fish Protein Hydrolysate Market Challenges
6.6. Fish Protein Hydrolysate Market Opportunities
6.4. Fish Protein Hydrolysate Market Trends
Chapter 7. Global Fish Protein Hydrolysate Market Outlook Trends
7.1. Global Fish Protein Hydrolysate Revenue (USD Million) and CAGR (%) by Type (2021-2032)
7.2. Global Fish Protein Hydrolysate Revenue (USD Million) and CAGR (%) by Application (2021-2032)
7.3. Global Fish Protein Hydrolysate Revenue (USD Million) and CAGR (%) by Product (2021-2032)
By Technology
Acid Hydrolysis
Autolytic Hydrolysis
Enzymatic Hydrolysis
By Form
Powder
Liquid
By Source
Anchovy
Herrings
Menhaden
Sardine
Shads
Others
By Application
Food
Pharmaceuticals
Animal Feed & Pet Food
Cosmetics
Others
Chapter 8. Global Fish Protein Hydrolysate Regional Analysis and Outlook
8.1. Global Fish Protein Hydrolysate Revenue (USD Million) By Regions (2021- 2032)
8.2. North America Fish Protein Hydrolysate Revenue (USD Million) by Country (2021-2032)
8.2.1. United States Fish Protein Hydrolysate Regional Analysis and Outlook
8.2.2. Canada Fish Protein Hydrolysate Regional Analysis and Outlook
8.2.3. Mexico Fish Protein Hydrolysate Regional Analysis and Outlook
8.3. Europe Fish Protein Hydrolysate Revenue (USD Million), by Country (2021-2032)
8.3.1. Germany Fish Protein Hydrolysate Regional Analysis and Outlook
8.3.2. France Fish Protein Hydrolysate Regional Analysis and Outlook
8.3.3. United Kingdom Fish Protein Hydrolysate Regional Analysis and Outlook
8.3.4. Spain Fish Protein Hydrolysate Regional Analysis and Outlook
8.3.5. Italy Fish Protein Hydrolysate Regional Analysis and Outlook
8.3.6. Russia Fish Protein Hydrolysate Regional Analysis and Outlook
8.3.7. Rest of Europe Fish Protein Hydrolysate Regional Analysis and Outlook
8.4. Asia Pacific Fish Protein Hydrolysate Revenue (USD Million) by Country (2021-2032)
8.4.1. China Fish Protein Hydrolysate Regional Analysis and Outlook
8.4.2. Japan Fish Protein Hydrolysate Regional Analysis and Outlook
8.4.3. India Fish Protein Hydrolysate Regional Analysis and Outlook
8.4.4. South Korea Fish Protein Hydrolysate Regional Analysis and Outlook
8.4.5. Australia Fish Protein Hydrolysate Regional Analysis and Outlook
8.4.6. South East Asia Fish Protein Hydrolysate Regional Analysis and Outlook
8.4.7. Rest of Asia Pacific Fish Protein Hydrolysate Regional Analysis and Outlook
8.5. South America Fish Protein Hydrolysate Revenue (USD Million), by Country (2021-2032)
8.5.1. Brazil Fish Protein Hydrolysate Regional Analysis and Outlook
8.5.2. Argentina Fish Protein Hydrolysate Regional Analysis and Outlook
8.5.3. Rest of South America Fish Protein Hydrolysate Regional Analysis and Outlook
8.6. Middle East and Africa Fish Protein Hydrolysate Revenue (USD Million) by Country (2021-2032)
8.6.1. Middle East Fish Protein Hydrolysate Regional Analysis and Outlook
8.6.2. Africa Fish Protein Hydrolysate Regional Analysis and Outlook
Chapter 9. North America Fish Protein Hydrolysate Analysis and Outlook
9.1. North America Fish Protein Hydrolysate Revenue (USD Million) by Segments (2021-2032)
9.1.1. North America Fish Protein Hydrolysate Revenue (USD Million) by Type (2021-2032)
9.1.2. North America Fish Protein Hydrolysate Revenue (USD Million) by Application (2021-2032)
9.1.3. North America Fish Protein Hydrolysate Revenue (USD Million) by Product (2021-2032)
By Technology
Acid Hydrolysis
Autolytic Hydrolysis
Enzymatic Hydrolysis
By Form
Powder
Liquid
By Source
Anchovy
Herrings
Menhaden
Sardine
Shads
Others
By Application
Food
Pharmaceuticals
Animal Feed & Pet Food
Cosmetics
Others
Chapter 10. Europe Fish Protein Hydrolysate Analysis and Outlook
10.1. Europe Fish Protein Hydrolysate Revenue (USD Million), by Segments (USD Million) (2021-2032)
10.1.1. Europe Fish Protein Hydrolysate Revenue (USD Million) by Type (2021-2032)
10.1.2. Europe Fish Protein Hydrolysate Revenue (USD Million) by Application (2021-2032)
10.1.3. Europe Fish Protein Hydrolysate Revenue (USD Million) by Product (2021-2032)
By Technology
Acid Hydrolysis
Autolytic Hydrolysis
Enzymatic Hydrolysis
By Form
Powder
Liquid
By Source
Anchovy
Herrings
Menhaden
Sardine
Shads
Others
By Application
Food
Pharmaceuticals
Animal Feed & Pet Food
Cosmetics
Others
Chapter 11. Asia Pacific Fish Protein Hydrolysate Analysis and Outlook
11.1. Asia Pacific Fish Protein Hydrolysate Revenue (USD Million), and Revenue (USD Million) by Segments (2021-2032)
11.1.1. Asia Pacific Fish Protein Hydrolysate Revenue (USD Million) by Type (2021-2032)
11.1.2. Asia Pacific Fish Protein Hydrolysate Revenue (USD Million) by Application (2021-2032)
11.1.3. Asia Pacific Fish Protein Hydrolysate Revenue (USD Million) by Product (2021-2032)
By Technology
Acid Hydrolysis
Autolytic Hydrolysis
Enzymatic Hydrolysis
By Form
Powder
Liquid
By Source
Anchovy
Herrings
Menhaden
Sardine
Shads
Others
By Application
Food
Pharmaceuticals
Animal Feed & Pet Food
Cosmetics
Others
Chapter 12. South America Fish Protein Hydrolysate Analysis and Outlook
12.1. South America Fish Protein Hydrolysate Revenue (USD Million), by Segments (2021-2032)
12.1.1. South America Fish Protein Hydrolysate Revenue (USD Million) by Type (2021-2032)
12.1.2. South America Fish Protein Hydrolysate Revenue (USD Million) by Application (2021-2032)
12.1.3. South America Fish Protein Hydrolysate Revenue (USD Million) by Product (2021-2032)
By Technology
Acid Hydrolysis
Autolytic Hydrolysis
Enzymatic Hydrolysis
By Form
Powder
Liquid
By Source
Anchovy
Herrings
Menhaden
Sardine
Shads
Others
By Application
Food
Pharmaceuticals
Animal Feed & Pet Food
Cosmetics
Others
Chapter 13. Middle East and Africa Fish Protein Hydrolysate Analysis and Outlook
13.1. Middle East and Africa Fish Protein Hydrolysate Revenue (USD Million), by Segments (2021-2032)
13.1.1. Middle East and Africa Fish Protein Hydrolysate Revenue (USD Million) by Type (2021-2032)
13.1.2. Middle East and Africa Fish Protein Hydrolysate Revenue (USD Million) by Application (2021-2032)
13.1.3. Middle East and Africa Fish Protein Hydrolysate Revenue (USD Million) by Product (2021-2032)
By Technology
Acid Hydrolysis
Autolytic Hydrolysis
Enzymatic Hydrolysis
By Form
Powder
Liquid
By Source
Anchovy
Herrings
Menhaden
Sardine
Shads
Others
By Application
Food
Pharmaceuticals
Animal Feed & Pet Food
Cosmetics
Others
Chapter 14. Fish Protein Hydrolysate Company Profiles
14.1 Business Overview
14.2 Product Profiles
14.3 SWOT Profiles
14.5 Recent Developments
14.6 Financial Profile
List of Companies
Alaska Protein Recovery LLC
Bio-marine Ingredients Ireland Ltd
BrownsFish Genesis
Copalis Sea Solutions
Diana Group
Dramm Corp
Great Pacific BioProducts Ltd
Hofseth BioCare
Janatha Fish Meal & Oil Products
Marutham Bio Ages Innovations (p) Ltd
Neptune's Harvest
New Alliance Dye Chem Pvt. Ltd
Sampi
Scanbio
Shenzhen Taier
Sopropeche
U.S. Ag Florida Inc
United Fisheries
15. Methodology and Data Sources
15.1 Customization Offerings
15.2 Subscription Services
15.3 Related Reports
15.4 Publisher Expertise
LIST OF TABLES
Table 1 Market Segmentation Analysis
Table 2 Global Fish Protein Hydrolysate Market Share of Leading Companies, 2023
Table 3 Product Offerings of Leading Companies
Table 4 Low Growth Scenario Forecasts
Table 5 Reference Case Growth Scenario
Table 6 High Growth Case Scenario
Table 7 Global Fish Protein Hydrolysate Revenue (USD Million) And CAGR (%) By Type (2021-2032)
Table 8 Global Fish Protein Hydrolysate Revenue (USD Million) And CAGR (%) By Application (2021-2032)
Table 9 Global Fish Protein Hydrolysate Revenue (USD Million) And CAGR (%) By Product (2021-2032)
Table 10 Global Fish Protein Hydrolysate Market Revenue (USD Million) By Regions (2021-2032)
Table 11 Global Fish Protein Hydrolysate Market Share (%) By Regions (2021-2032)
Table 12 North America Fish Protein Hydrolysate Revenue (USD Million) By Country (2021-2032)
Table 13 Europe Fish Protein Hydrolysate Revenue (USD Million) By Country (2021-2032)
Table 14 Asia Pacific Fish Protein Hydrolysate Revenue (USD Million) By Country (2021-2032)
Table 15 South America Fish Protein Hydrolysate Revenue (USD Million) By Country (2021-2032)
Table 16 Middle East and Africa Fish Protein Hydrolysate Revenue (USD Million) By Region (2021-2032)
Table 17 North America Fish Protein Hydrolysate Revenue (USD Million) By Type (2021-2032)
Table 18 North America Fish Protein Hydrolysate Revenue (USD Million) By Application (2021-2032)
Table 19 North America Fish Protein Hydrolysate Revenue (USD Million) By Product (2021-2032)
Table 20 Europe Fish Protein Hydrolysate Revenue (USD Million) By Type (2021-2032)
Table 21 Europe Fish Protein Hydrolysate Revenue (USD Million) By Application (2021-2032)
Table 22 Europe Fish Protein Hydrolysate Revenue (USD Million) By Product (2021-2032)
Table 23 Asia Pacific Fish Protein Hydrolysate Revenue (USD Million) By Type (2021-2032)
Table 24 Asia Pacific Fish Protein Hydrolysate Revenue (USD Million) By Application (2021-2032)
Table 25 Asia Pacific Fish Protein Hydrolysate Revenue (USD Million) By Product (2021-2032)
Table 26 South America Fish Protein Hydrolysate Revenue (USD Million) By Type (2021-2032)
Table 27 South America Fish Protein Hydrolysate Revenue (USD Million) By Application (2021-2032)
Table 28 South America Fish Protein Hydrolysate Revenue (USD Million) By Product (2021-2032)
Table 29 Middle East and Africa Fish Protein Hydrolysate Revenue (USD Million) By Type (2021-2032)
Table 30 Middle East and Africa Fish Protein Hydrolysate Revenue (USD Million) By Application (2021-2032)
Table 31 Middle East and Africa Fish Protein Hydrolysate Revenue (USD Million) By Product (2021-2032)
LIST OF FIGURES
Figure 1. Market Scope
Figure 2. Pricing Forecasts Per Unit, 2023- 2032
Figure 3. Porter’s Five Forces
Figure 4. Global Fish Protein Hydrolysate Market Revenue (USD Million) By Regions (2021-2032)
Figure 5. Global Fish Protein Hydrolysate Market Share (%) By Regions (2023)
Figure 6. North America Fish Protein Hydrolysate Revenue (USD Million) By Country (2021-2032)
Figure 7. United States Fish Protein Hydrolysate Revenue (USD Million) By Country (2021-2032)
Figure 8. Canada Fish Protein Hydrolysate Revenue (USD Million) By Country (2021-2032)
Figure 9. Mexico Fish Protein Hydrolysate Revenue (USD Million) By Country (2021-2032)
Figure 10. Europe Fish Protein Hydrolysate Revenue (USD Million) By Country (2021-2032)
Figure 11. Germany Fish Protein Hydrolysate Revenue (USD Million) By Country (2021-2032)
Figure 12. France Fish Protein Hydrolysate Revenue (USD Million) By Country (2021-2032)
Figure 13. United Kingdom Fish Protein Hydrolysate Revenue (USD Million) By Country (2021-2032)
Figure 14. Spain Fish Protein Hydrolysate Revenue (USD Million) By Country (2021-2032)
Figure 15. Italy Fish Protein Hydrolysate Revenue (USD Million) By Country (2021-2032)
Figure 16. Russia Fish Protein Hydrolysate Revenue (USD Million) By Country (2021-2032)
Figure 17. Rest of Europe Fish Protein Hydrolysate Revenue (USD Million) By Country (2021-2032)
Figure 11. Asia Pacific Fish Protein Hydrolysate Revenue (USD Million) By Country (2021-2032)
Figure 12. China Fish Protein Hydrolysate Revenue (USD Million) By Country (2021-2032)
Figure 13. Japan Fish Protein Hydrolysate Revenue (USD Million) By Country (2021-2032)
Figure 14. India Fish Protein Hydrolysate Revenue (USD Million) By Country (2021-2032)
Figure 15. South Korea Fish Protein Hydrolysate Revenue (USD Million) By Country (2021-2032)
Figure 16. Australia Fish Protein Hydrolysate Revenue (USD Million) By Country (2021-2032)
Figure 17. South East Asia Fish Protein Hydrolysate Revenue (USD Million) By Country (2021-2032)
Figure 18. South America Fish Protein Hydrolysate Revenue (USD Million) By Country (2021-2032)
Figure 19. Brazil Fish Protein Hydrolysate Revenue (USD Million) By Country (2021-2032)
Figure 20. Argentina Fish Protein Hydrolysate Revenue (USD Million) By Country (2021-2032)
Figure 21. Rest of Asia Pacific Fish Protein Hydrolysate Revenue (USD Million) By Country (2021-2032)
Figure 22. Middle East and Africa Fish Protein Hydrolysate Revenue (USD Million) By Region (2021-2032)
Figure 23. Saudi Arabia Fish Protein Hydrolysate Revenue (USD Million) By Region (2021-2032)
Figure 24. The UAE Fish Protein Hydrolysate Revenue (USD Million) By Region (2021-2032)
Figure 25. Rest of Middle East Fish Protein Hydrolysate Revenue (USD Million) By Region (2021-2032)
Figure 26. South Africa Fish Protein Hydrolysate Revenue (USD Million) By Region (2021-2032)
Figure 27. Africa Fish Protein Hydrolysate Revenue (USD Million) By Region (2021-2032)
Figure 28. North America Fish Protein Hydrolysate Revenue (USD Million) By Type (2021-2032)
Figure 29. North America Fish Protein Hydrolysate Revenue (USD Million) By Application (2021-2032)
Figure 30. North America Fish Protein Hydrolysate Revenue (USD Million) By Product (2021-2032)
Figure 31. Europe Fish Protein Hydrolysate Revenue (USD Million) By Type (2021-2032)
Figure 32. Europe Fish Protein Hydrolysate Revenue (USD Million) By Application (2021-2032)
Figure 33. Europe Fish Protein Hydrolysate Revenue (USD Million) By Product (2021-2032)
Figure 34. Asia Pacific Fish Protein Hydrolysate Revenue (USD Million) By Type (2021-2032)
Figure 35. Asia Pacific Fish Protein Hydrolysate Revenue (USD Million) By Application (2021-2032)
Figure 36. Asia Pacific Fish Protein Hydrolysate Revenue (USD Million) By Product (2021-2032)
Figure 37. South America Fish Protein Hydrolysate Revenue (USD Million) By Type (2021-2032)
Figure 38. South America Fish Protein Hydrolysate Revenue (USD Million) By Application (2021-2032)
Figure 39. South America Fish Protein Hydrolysate Revenue (USD Million) By Product (2021-2032)
Figure 40. Middle East and Africa Fish Protein Hydrolysate Revenue (USD Million) By Type (2021-2032)
Figure 41. Middle East and Africa Fish Protein Hydrolysate Revenue (USD Million) By Application (2021-2032)
Figure 42. Middle East and Africa Fish Protein Hydrolysate Revenue (USD Million) By Product (2021-2032)
By Technology
Acid Hydrolysis
Autolytic Hydrolysis
Enzymatic Hydrolysis
By Form
Powder
Liquid
By Source
Anchovy
Herrings
Menhaden
Sardine
Shads
Others
By Application
Food
Pharmaceuticals
Animal Feed & Pet Food
Cosmetics
Others
Countries Analyzed
North America (US, Canada, Mexico)
Europe (Germany, UK, France, Spain, Italy, Russia, Rest of Europe)
Asia Pacific (China, India, Japan, South Korea, Australia, South East Asia, Rest of Asia)
South America (Brazil, Argentina, Rest of South America)
Middle East and Africa (Saudi Arabia, UAE, Rest of Middle East, South Africa, Egypt, Rest of Africa)
