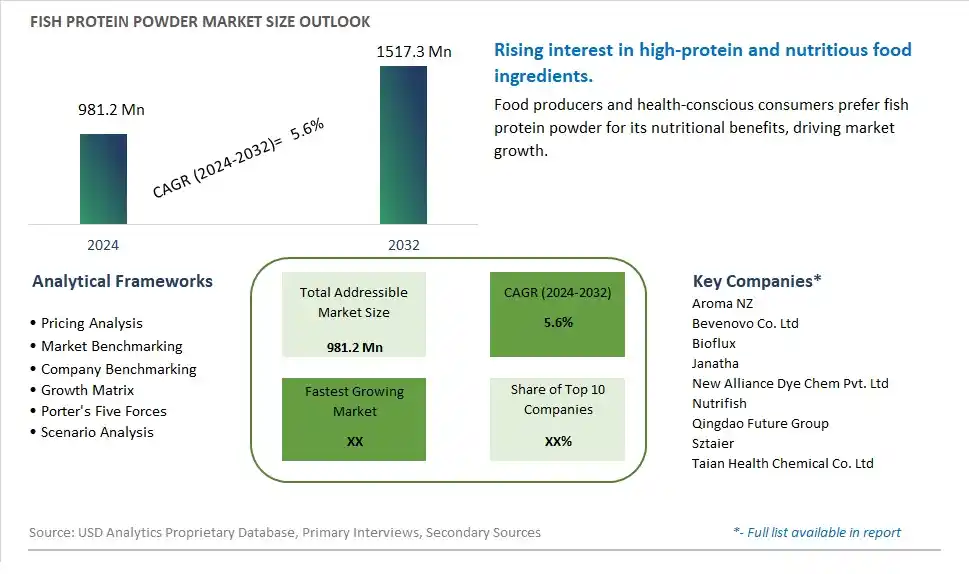
Global Fish Protein Powder Market Size is valued at $981.2 Million in 2024 and is forecast to register a growth rate (CAGR) of 5.6% to reach $1517.3 Million by 2032.
The global Fish Protein Powder Market Comprehensive Study analyzes and forecasts the market size across 6 regions and 24 countries for diverse segments -By Type (Fish Protein Concentrate (FPC), Fish Protein Isolate (FPI)), By Application (Pharmaceuticals, Food, Others)
An Introduction to Fish Protein Powder Market
In 2024, the Fish Protein Powder market is thriving, fueled by the increasing demand for high-quality and easily digestible protein sources. Fish protein powder, used in sports nutrition, dietary supplements, and functional foods, is valued for its rich amino acid profile and bioavailability. The market benefits from advancements in protein extraction and processing technologies, the growing trend of health and fitness, and the expansion of the functional food and nutraceutical sectors. Additionally, the rising awareness of the health benefits of fish protein, including muscle building and recovery, is driving market growth.
Fish Protein Powder Competitive Landscape
The market report analyses the leading companies in the industry including Aroma NZ, Bevenovo Co. Ltd, Bioflux, Janatha, New Alliance Dye Chem Pvt. Ltd, Nutrifish, Qingdao Future Group, Sztaier, Taian Health Chemical Co. Ltd, and Others.
Fish Protein Powder Market Dynamics
Fish Protein Powder Market Trend: Growing Popularity of Protein-Enriched Functional Foods
The fish protein powder market is witnessing a significant trend towards the growing popularity of protein-enriched functional foods. Consumers are increasingly looking for high-protein products to support their health and fitness goals, driven by the rising awareness of protein's role in muscle building, weight management, and overall well-being. Fish protein powder, known for its high-quality amino acid profile and bioavailability, is being incorporated into various food and beverage products such as protein bars, shakes, and meal replacements. This trend is further supported by the clean label movement, with consumers favoring natural and minimally processed protein sources over synthetic alternatives.
Fish Protein Powder Market Driver: Rising Demand for Sustainable and Natural Protein Sources
The rising demand for sustainable and natural protein sources is a major driver for the fish protein powder market. As consumers become more environmentally conscious, they are seeking protein sources that have a lower environmental impact compared to traditional animal-based proteins. Fish protein powder, often derived from by-products of the fishing industry, provides a sustainable alternative by utilizing resources that might otherwise be wasted. Additionally, the natural origin and nutritional benefits of fish protein align well with the growing consumer preference for clean, natural, and responsibly sourced ingredients, further driving market growth.
Fish Protein Powder Market Opportunity: Innovation in Product Formulations and Applications
There is a significant opportunity for growth in the fish protein powder market through innovation in product formulations and applications. Companies can explore creating new and diverse product offerings that cater to different dietary preferences and health needs, such as gluten-free, keto-friendly, and allergen-free options. Additionally, integrating fish protein powder into functional foods aimed at specific health benefits, such as joint health, skin health, and immune support, can attract a broader consumer base. By investing in research and development to enhance the taste, texture, and nutritional profile of fish protein powder products, businesses can differentiate themselves in the competitive protein market and drive increased consumer adoption.
Fish Protein Powder Market Share Analysis: Fish Protein Concentrate (FPC) segment generated the highest revenue share in the industry
Fish Protein Concentrate (FPC) is the largest segment in the Fish Protein Powder Market by Type. FPC's dominance is primarily due to its high nutritional value and versatility in various applications. FPC is rich in essential amino acids, vitamins, and minerals, making it an excellent source of high-quality protein. It is widely used in the food industry to enhance the protein content of various products, including nutritional supplements, protein bars, and fortified foods. The food industry's demand for clean-label, high-protein ingredients has significantly boosted the popularity of FPC. Additionally, FPC is valued for its functionality, such as its ability to improve texture and moisture retention in food products, which further drives its adoption. The growing awareness of the health benefits associated with fish proteins and the increasing trend toward protein-rich diets contribute to the continued dominance of FPC in the market.
Fish Protein Powder Market Share Analysis: Pharmaceuticals is the fastest growing segment over the forecast period to 2032
The Pharmaceuticals segment is projected to be the fastest-growing application in the Fish Protein Powder Market by 2032. This rapid growth is driven by the increasing recognition of the therapeutic benefits of fish protein powder in various medical and health applications. Fish protein powders are rich in bioactive peptides that have been shown to possess anti-inflammatory, antioxidant, and immune-modulating properties. These properties make fish protein powder a valuable ingredient in the development of nutraceuticals and functional foods aimed at improving overall health and managing chronic conditions. The pharmaceutical industry is increasingly incorporating fish protein powders into supplements and medicinal products designed to support muscle repair, promote skin health, and enhance recovery in patients. The rising consumer demand for natural and effective health solutions, combined with ongoing research and innovation in fish protein applications, is expected to drive significant growth in the pharmaceutical segment. As the benefits of fish protein powders continue to be validated through scientific studies, their use in pharmaceuticals is to expand, making this segment the fastest-growing in the market.
Fish Protein Powder Market Segmentation
By Type
Fish Protein Concentrate (FPC)
Fish Protein Isolate (FPI)
By Application
Pharmaceuticals
Food
Others
Countries Analyzed
North America (US, Canada, Mexico)
Europe (Germany, UK, France, Spain, Italy, Russia, Rest of Europe)
Asia Pacific (China, India, Japan, South Korea, Australia, South East Asia, Rest of Asia)
South America (Brazil, Argentina, Rest of South America)
Middle East and Africa (Saudi Arabia, UAE, Rest of Middle East, South Africa, Egypt, Rest of Africa)
Fish Protein Powder Companies Profiled in the Study
Aroma NZ
Bevenovo Co. Ltd
Bioflux
Janatha
New Alliance Dye Chem Pvt. Ltd
Nutrifish
Qingdao Future Group
Sztaier
Taian Health Chemical Co. Ltd
*- List Not Exhaustive
Chapter 1. TABLE OF CONTENTS
Chapter 2. Introduction to Fish Protein Powder Market
2.1. Market Overview
2.2. Key Statistics and Report Highlights
2.3. Scope of the Comprehensive Study
2.3.1. Market Definition
2.3.2 Countries and Regions Covered
2.3.3 Research Objective
2.3.4 Units, Currency, and Conversions
2.3.5 Industry Value Chain
2.4. Key Market Segments
2.5. Key Companies
2.6. Study Period
Chapter 3. Strategic Analysis Review
3.1. Fish Protein Powder Pricing Analysis and Forecast
3.2. Porter’s Five Forces
3.3. Market Ecosystem
3.4. SWOT Analysis
3.5. Regulatory Scenario
3.3. Effects of Inflation, Russia-Ukraine War, moderating economic growth, and other macroeconomic factors
Chapter 4. Competitive Landscape
4.1. Market Share Analysis
4.1.1. Global Fish Protein Powder Market Share by Company, 2023
4.1.2. Product Offerings of Leading Fish Protein Powder Companies
4.2. Market Entropy
4.2.1. New Product Launches in the Industry
4.2.2. Mergers, Acquisitions, Joint ventures, and Partnerships
4.3. Key Strategies and Best Practices
Chapter 5. Global Market Projections: Best, Reference, and Low Case Scenarios
5.1. Growth Analysis- Case Scenario Definitions
5.2. Low Growth Case Scenario Forecasts
5.3. Reference Growth Case Scenario Forecasts
5.4. High Growth Case Scenario Forecasts
Chapter 6. Market Dynamics
6.1. Fish Protein Powder Market Drivers
6.2. Fish Protein Powder Market Challenges
6.6. Fish Protein Powder Market Opportunities
6.4. Fish Protein Powder Market Trends
Chapter 7. Global Fish Protein Powder Market Outlook Trends
7.1. Global Fish Protein Powder Revenue (USD Million) and CAGR (%) by Type (2021-2032)
7.2. Global Fish Protein Powder Revenue (USD Million) and CAGR (%) by Application (2021-2032)
7.3. Global Fish Protein Powder Revenue (USD Million) and CAGR (%) by Product (2021-2032)
By Type
Fish Protein Concentrate (FPC)
Fish Protein Isolate (FPI)
By Application
Pharmaceuticals
Food
Others
Chapter 8. Global Fish Protein Powder Regional Analysis and Outlook
8.1. Global Fish Protein Powder Revenue (USD Million) By Regions (2021- 2032)
8.2. North America Fish Protein Powder Revenue (USD Million) by Country (2021-2032)
8.2.1. United States Fish Protein Powder Regional Analysis and Outlook
8.2.2. Canada Fish Protein Powder Regional Analysis and Outlook
8.2.3. Mexico Fish Protein Powder Regional Analysis and Outlook
8.3. Europe Fish Protein Powder Revenue (USD Million), by Country (2021-2032)
8.3.1. Germany Fish Protein Powder Regional Analysis and Outlook
8.3.2. France Fish Protein Powder Regional Analysis and Outlook
8.3.3. United Kingdom Fish Protein Powder Regional Analysis and Outlook
8.3.4. Spain Fish Protein Powder Regional Analysis and Outlook
8.3.5. Italy Fish Protein Powder Regional Analysis and Outlook
8.3.6. Russia Fish Protein Powder Regional Analysis and Outlook
8.3.7. Rest of Europe Fish Protein Powder Regional Analysis and Outlook
8.4. Asia Pacific Fish Protein Powder Revenue (USD Million) by Country (2021-2032)
8.4.1. China Fish Protein Powder Regional Analysis and Outlook
8.4.2. Japan Fish Protein Powder Regional Analysis and Outlook
8.4.3. India Fish Protein Powder Regional Analysis and Outlook
8.4.4. South Korea Fish Protein Powder Regional Analysis and Outlook
8.4.5. Australia Fish Protein Powder Regional Analysis and Outlook
8.4.6. South East Asia Fish Protein Powder Regional Analysis and Outlook
8.4.7. Rest of Asia Pacific Fish Protein Powder Regional Analysis and Outlook
8.5. South America Fish Protein Powder Revenue (USD Million), by Country (2021-2032)
8.5.1. Brazil Fish Protein Powder Regional Analysis and Outlook
8.5.2. Argentina Fish Protein Powder Regional Analysis and Outlook
8.5.3. Rest of South America Fish Protein Powder Regional Analysis and Outlook
8.6. Middle East and Africa Fish Protein Powder Revenue (USD Million) by Country (2021-2032)
8.6.1. Middle East Fish Protein Powder Regional Analysis and Outlook
8.6.2. Africa Fish Protein Powder Regional Analysis and Outlook
Chapter 9. North America Fish Protein Powder Analysis and Outlook
9.1. North America Fish Protein Powder Revenue (USD Million) by Segments (2021-2032)
9.1.1. North America Fish Protein Powder Revenue (USD Million) by Type (2021-2032)
9.1.2. North America Fish Protein Powder Revenue (USD Million) by Application (2021-2032)
9.1.3. North America Fish Protein Powder Revenue (USD Million) by Product (2021-2032)
By Type
Fish Protein Concentrate (FPC)
Fish Protein Isolate (FPI)
By Application
Pharmaceuticals
Food
Others
Chapter 10. Europe Fish Protein Powder Analysis and Outlook
10.1. Europe Fish Protein Powder Revenue (USD Million), by Segments (USD Million) (2021-2032)
10.1.1. Europe Fish Protein Powder Revenue (USD Million) by Type (2021-2032)
10.1.2. Europe Fish Protein Powder Revenue (USD Million) by Application (2021-2032)
10.1.3. Europe Fish Protein Powder Revenue (USD Million) by Product (2021-2032)
By Type
Fish Protein Concentrate (FPC)
Fish Protein Isolate (FPI)
By Application
Pharmaceuticals
Food
Others
Chapter 11. Asia Pacific Fish Protein Powder Analysis and Outlook
11.1. Asia Pacific Fish Protein Powder Revenue (USD Million), and Revenue (USD Million) by Segments (2021-2032)
11.1.1. Asia Pacific Fish Protein Powder Revenue (USD Million) by Type (2021-2032)
11.1.2. Asia Pacific Fish Protein Powder Revenue (USD Million) by Application (2021-2032)
11.1.3. Asia Pacific Fish Protein Powder Revenue (USD Million) by Product (2021-2032)
By Type
Fish Protein Concentrate (FPC)
Fish Protein Isolate (FPI)
By Application
Pharmaceuticals
Food
Others
Chapter 12. South America Fish Protein Powder Analysis and Outlook
12.1. South America Fish Protein Powder Revenue (USD Million), by Segments (2021-2032)
12.1.1. South America Fish Protein Powder Revenue (USD Million) by Type (2021-2032)
12.1.2. South America Fish Protein Powder Revenue (USD Million) by Application (2021-2032)
12.1.3. South America Fish Protein Powder Revenue (USD Million) by Product (2021-2032)
By Type
Fish Protein Concentrate (FPC)
Fish Protein Isolate (FPI)
By Application
Pharmaceuticals
Food
Others
Chapter 13. Middle East and Africa Fish Protein Powder Analysis and Outlook
13.1. Middle East and Africa Fish Protein Powder Revenue (USD Million), by Segments (2021-2032)
13.1.1. Middle East and Africa Fish Protein Powder Revenue (USD Million) by Type (2021-2032)
13.1.2. Middle East and Africa Fish Protein Powder Revenue (USD Million) by Application (2021-2032)
13.1.3. Middle East and Africa Fish Protein Powder Revenue (USD Million) by Product (2021-2032)
By Type
Fish Protein Concentrate (FPC)
Fish Protein Isolate (FPI)
By Application
Pharmaceuticals
Food
Others
Chapter 14. Fish Protein Powder Company Profiles
14.1 Business Overview
14.2 Product Profiles
14.3 SWOT Profiles
14.5 Recent Developments
14.6 Financial Profile
List of Companies
Aroma NZ
Bevenovo Co. Ltd
Bioflux
Janatha
New Alliance Dye Chem Pvt. Ltd
Nutrifish
Qingdao Future Group
Sztaier
Taian Health Chemical Co. Ltd
15. Methodology and Data Sources
15.1 Customization Offerings
15.2 Subscription Services
15.3 Related Reports
15.4 Publisher Expertise
LIST OF TABLES
Table 1 Market Segmentation Analysis
Table 2 Global Fish Protein Powder Market Share of Leading Companies, 2023
Table 3 Product Offerings of Leading Companies
Table 4 Low Growth Scenario Forecasts
Table 5 Reference Case Growth Scenario
Table 6 High Growth Case Scenario
Table 7 Global Fish Protein Powder Revenue (USD Million) And CAGR (%) By Type (2021-2032)
Table 8 Global Fish Protein Powder Revenue (USD Million) And CAGR (%) By Application (2021-2032)
Table 9 Global Fish Protein Powder Revenue (USD Million) And CAGR (%) By Product (2021-2032)
Table 10 Global Fish Protein Powder Market Revenue (USD Million) By Regions (2021-2032)
Table 11 Global Fish Protein Powder Market Share (%) By Regions (2021-2032)
Table 12 North America Fish Protein Powder Revenue (USD Million) By Country (2021-2032)
Table 13 Europe Fish Protein Powder Revenue (USD Million) By Country (2021-2032)
Table 14 Asia Pacific Fish Protein Powder Revenue (USD Million) By Country (2021-2032)
Table 15 South America Fish Protein Powder Revenue (USD Million) By Country (2021-2032)
Table 16 Middle East and Africa Fish Protein Powder Revenue (USD Million) By Region (2021-2032)
Table 17 North America Fish Protein Powder Revenue (USD Million) By Type (2021-2032)
Table 18 North America Fish Protein Powder Revenue (USD Million) By Application (2021-2032)
Table 19 North America Fish Protein Powder Revenue (USD Million) By Product (2021-2032)
Table 20 Europe Fish Protein Powder Revenue (USD Million) By Type (2021-2032)
Table 21 Europe Fish Protein Powder Revenue (USD Million) By Application (2021-2032)
Table 22 Europe Fish Protein Powder Revenue (USD Million) By Product (2021-2032)
Table 23 Asia Pacific Fish Protein Powder Revenue (USD Million) By Type (2021-2032)
Table 24 Asia Pacific Fish Protein Powder Revenue (USD Million) By Application (2021-2032)
Table 25 Asia Pacific Fish Protein Powder Revenue (USD Million) By Product (2021-2032)
Table 26 South America Fish Protein Powder Revenue (USD Million) By Type (2021-2032)
Table 27 South America Fish Protein Powder Revenue (USD Million) By Application (2021-2032)
Table 28 South America Fish Protein Powder Revenue (USD Million) By Product (2021-2032)
Table 29 Middle East and Africa Fish Protein Powder Revenue (USD Million) By Type (2021-2032)
Table 30 Middle East and Africa Fish Protein Powder Revenue (USD Million) By Application (2021-2032)
Table 31 Middle East and Africa Fish Protein Powder Revenue (USD Million) By Product (2021-2032)
LIST OF FIGURES
Figure 1. Market Scope
Figure 2. Pricing Forecasts Per Unit, 2023- 2032
Figure 3. Porter’s Five Forces
Figure 4. Global Fish Protein Powder Market Revenue (USD Million) By Regions (2021-2032)
Figure 5. Global Fish Protein Powder Market Share (%) By Regions (2023)
Figure 6. North America Fish Protein Powder Revenue (USD Million) By Country (2021-2032)
Figure 7. United States Fish Protein Powder Revenue (USD Million) By Country (2021-2032)
Figure 8. Canada Fish Protein Powder Revenue (USD Million) By Country (2021-2032)
Figure 9. Mexico Fish Protein Powder Revenue (USD Million) By Country (2021-2032)
Figure 10. Europe Fish Protein Powder Revenue (USD Million) By Country (2021-2032)
Figure 11. Germany Fish Protein Powder Revenue (USD Million) By Country (2021-2032)
Figure 12. France Fish Protein Powder Revenue (USD Million) By Country (2021-2032)
Figure 13. United Kingdom Fish Protein Powder Revenue (USD Million) By Country (2021-2032)
Figure 14. Spain Fish Protein Powder Revenue (USD Million) By Country (2021-2032)
Figure 15. Italy Fish Protein Powder Revenue (USD Million) By Country (2021-2032)
Figure 16. Russia Fish Protein Powder Revenue (USD Million) By Country (2021-2032)
Figure 17. Rest of Europe Fish Protein Powder Revenue (USD Million) By Country (2021-2032)
Figure 11. Asia Pacific Fish Protein Powder Revenue (USD Million) By Country (2021-2032)
Figure 12. China Fish Protein Powder Revenue (USD Million) By Country (2021-2032)
Figure 13. Japan Fish Protein Powder Revenue (USD Million) By Country (2021-2032)
Figure 14. India Fish Protein Powder Revenue (USD Million) By Country (2021-2032)
Figure 15. South Korea Fish Protein Powder Revenue (USD Million) By Country (2021-2032)
Figure 16. Australia Fish Protein Powder Revenue (USD Million) By Country (2021-2032)
Figure 17. South East Asia Fish Protein Powder Revenue (USD Million) By Country (2021-2032)
Figure 18. South America Fish Protein Powder Revenue (USD Million) By Country (2021-2032)
Figure 19. Brazil Fish Protein Powder Revenue (USD Million) By Country (2021-2032)
Figure 20. Argentina Fish Protein Powder Revenue (USD Million) By Country (2021-2032)
Figure 21. Rest of Asia Pacific Fish Protein Powder Revenue (USD Million) By Country (2021-2032)
Figure 22. Middle East and Africa Fish Protein Powder Revenue (USD Million) By Region (2021-2032)
Figure 23. Saudi Arabia Fish Protein Powder Revenue (USD Million) By Region (2021-2032)
Figure 24. The UAE Fish Protein Powder Revenue (USD Million) By Region (2021-2032)
Figure 25. Rest of Middle East Fish Protein Powder Revenue (USD Million) By Region (2021-2032)
Figure 26. South Africa Fish Protein Powder Revenue (USD Million) By Region (2021-2032)
Figure 27. Africa Fish Protein Powder Revenue (USD Million) By Region (2021-2032)
Figure 28. North America Fish Protein Powder Revenue (USD Million) By Type (2021-2032)
Figure 29. North America Fish Protein Powder Revenue (USD Million) By Application (2021-2032)
Figure 30. North America Fish Protein Powder Revenue (USD Million) By Product (2021-2032)
Figure 31. Europe Fish Protein Powder Revenue (USD Million) By Type (2021-2032)
Figure 32. Europe Fish Protein Powder Revenue (USD Million) By Application (2021-2032)
Figure 33. Europe Fish Protein Powder Revenue (USD Million) By Product (2021-2032)
Figure 34. Asia Pacific Fish Protein Powder Revenue (USD Million) By Type (2021-2032)
Figure 35. Asia Pacific Fish Protein Powder Revenue (USD Million) By Application (2021-2032)
Figure 36. Asia Pacific Fish Protein Powder Revenue (USD Million) By Product (2021-2032)
Figure 37. South America Fish Protein Powder Revenue (USD Million) By Type (2021-2032)
Figure 38. South America Fish Protein Powder Revenue (USD Million) By Application (2021-2032)
Figure 39. South America Fish Protein Powder Revenue (USD Million) By Product (2021-2032)
Figure 40. Middle East and Africa Fish Protein Powder Revenue (USD Million) By Type (2021-2032)
Figure 41. Middle East and Africa Fish Protein Powder Revenue (USD Million) By Application (2021-2032)
Figure 42. Middle East and Africa Fish Protein Powder Revenue (USD Million) By Product (2021-2032)
By Type
Fish Protein Concentrate (FPC)
Fish Protein Isolate (FPI)
By Application
Pharmaceuticals
Food
Others
Countries Analyzed
North America (US, Canada, Mexico)
Europe (Germany, UK, France, Spain, Italy, Russia, Rest of Europe)
Asia Pacific (China, India, Japan, South Korea, Australia, South East Asia, Rest of Asia)
South America (Brazil, Argentina, Rest of South America)
Middle East and Africa (Saudi Arabia, UAE, Rest of Middle East, South Africa, Egypt, Rest of Africa)
