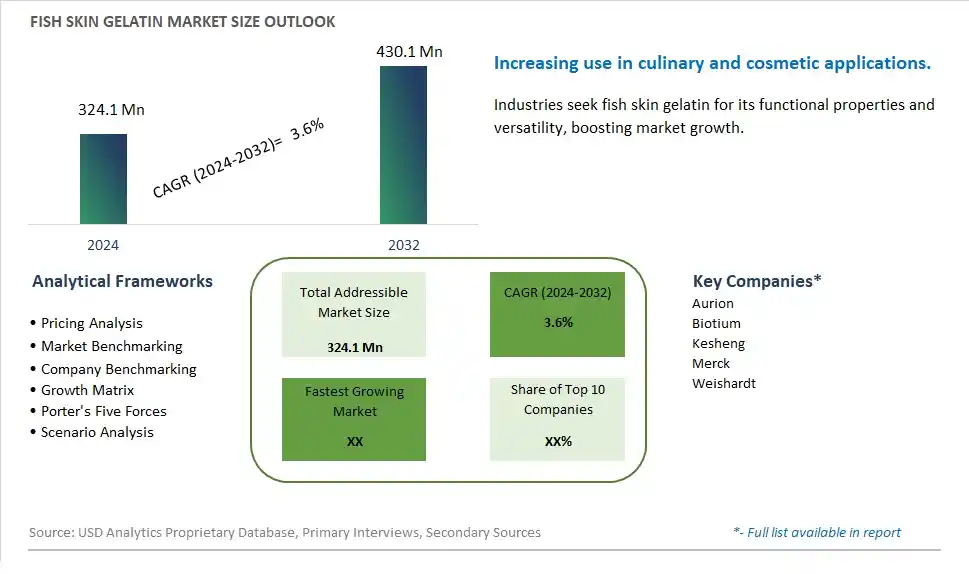
Global Fish Skin Gelatin Market Size is valued at $324.1 Million in 2024 and is forecast to register a growth rate (CAGR) of 3.6% to reach $430.1 Million by 2032.
The global Fish Skin Gelatin Market Comprehensive Study analyzes and forecasts the market size across 6 regions and 24 countries for diverse segments -By Type (0.4, 0.5), By Application (Medical, Food, Others)
An Introduction to Fish Skin Gelatin Market
The Fish Skin Gelatin market in 2024 is witnessing robust growth, driven by the increasing demand for natural and sustainable gelatin sources. Fish skin gelatin, used in food, pharmaceuticals, and cosmetics, offers a versatile and high-quality alternative to bovine and porcine gelatin. The market benefits from advancements in gelatin extraction and processing technologies, the growing trend of clean label and natural ingredients, and the expansion of the functional food and beauty sectors. Additionally, the rising focus on sustainability and resource efficiency is contributing to market growth.
Fish Skin Gelatin Competitive Landscape
The market report analyses the leading companies in the industry including Aurion, Biotium, Kesheng, Merck, Weishardt, and Others.
Fish Skin Gelatin Market Dynamics
Fish Skin Gelatin Market Trend: Increasing Use in Nutraceutical and Functional Food Products
The fish skin gelatin market is experiencing a significant trend towards increasing use in nutraceutical and functional food products. Consumers are becoming more aware of the health benefits associated with gelatin, such as improved joint health, skin elasticity, and digestive health. Fish skin gelatin, in particular, is valued for its high bioavailability and compatibility with various dietary restrictions, including those requiring halal or kosher certification. This trend is driven by a broader shift towards natural and functional ingredients in the food and supplement industries, with manufacturers incorporating fish skin gelatin into protein bars, health drinks, and dietary supplements to meet consumer demand for multifunctional health products.
Fish Skin Gelatin Market Driver: Rising Demand for Sustainable and Eco-Friendly Ingredients
The rising demand for sustainable and eco-friendly ingredients is a major driver for the fish skin gelatin market. As environmental awareness grows, consumers and manufacturers are seeking alternatives to traditional bovine and porcine gelatins, which have a higher environmental impact. Fish skin gelatin, derived from by-products of the seafood industry, offers a sustainable solution by utilizing waste materials and reducing overall environmental footprint. This driver is also supported by the increasing prevalence of ethical and environmentally conscious consumer choices, prompting food and pharmaceutical companies to adopt more sustainable ingredient sourcing practices.
Fish Skin Gelatin Market Opportunity: Expansion into Biomedical and Cosmetic Applications
There is a significant opportunity for growth in the fish skin gelatin market through expansion into biomedical and cosmetic applications. Fish skin gelatin is gaining recognition for its unique properties, such as excellent film-forming capabilities, biocompatibility, and low immunogenicity, making it suitable for use in wound dressings, drug delivery systems, and tissue engineering. Additionally, the cosmetic industry is exploring fish skin gelatin for its anti-aging and skin hydration benefits, leading to its incorporation into skincare products, masks, and serums. By leveraging these properties and investing in research and development, companies can tap into the high-value biomedical and cosmetic markets, driving innovation and growth in the fish skin gelatin sector.
Fish Skin Gelatin Market Share Analysis: 0.5 segment generated the highest revenue share in the industry
The 0.5 type is the largest segment in the Fish Skin Gelatin Market by Type. This classification refers to the bloom strength of the gelatin, which measures the firmness of the gel formed. A bloom strength of 0.5 indicates a higher gel strength, making it particularly suitable for applications requiring more robust gelling properties. The 0.5 type fish skin gelatin is extensively used in the food industry for products like gummy candies, marshmallows, and gelatin desserts, where a firm texture is desired. Additionally, it finds applications in pharmaceuticals and nutraceuticals, where its superior gelling ability enhances the stability and delivery of active ingredients. The preference for 0.5 bloom strength gelatin is driven by its versatility and effectiveness in providing the desired textural qualities across various products, making it the largest segment in the market.
Fish Skin Gelatin Market Share Analysis: Medical is the fastest growing segment over the forecast period to 2032
The Medical segment is projected to be the fastest-growing application in the Fish Skin Gelatin Market by 2032. This rapid growth is attributed to the increasing utilization of fish skin gelatin in various medical and biomedical applications due to its biocompatibility and biodegradability. Fish skin gelatin is being extensively researched and used in wound care products, drug delivery systems, and tissue engineering. Its ability to promote cell adhesion and proliferation makes it an ideal material for developing scaffolds in regenerative medicine. Further, fish skin gelatin is used in the formulation of capsules and coatings for pharmaceutical products, where it provides a natural and safe alternative to bovine or porcine gelatin, which may raise concerns for certain consumer groups. The rising demand for advanced medical treatments and the continuous innovation in biomedical research are expected to drive significant growth in the medical application segment of the fish skin gelatin market. As healthcare providers and researchers seek out more sustainable and effective materials, the adoption of fish skin gelatin in medical applications is set to expand rapidly.
Fish Skin Gelatin Market Segmentation
By Type
0.4
0.5
By Application
Medical
Food
Others
Countries Analyzed
North America (US, Canada, Mexico)
Europe (Germany, UK, France, Spain, Italy, Russia, Rest of Europe)
Asia Pacific (China, India, Japan, South Korea, Australia, South East Asia, Rest of Asia)
South America (Brazil, Argentina, Rest of South America)
Middle East and Africa (Saudi Arabia, UAE, Rest of Middle East, South Africa, Egypt, Rest of Africa)
Fish Skin Gelatin Companies Profiled in the Study
Aurion
Biotium
Kesheng
Merck
Weishardt
*- List Not Exhaustive
Chapter 1. TABLE OF CONTENTS
Chapter 2. Introduction to Fish Skin Gelatin Market
2.1. Market Overview
2.2. Key Statistics and Report Highlights
2.3. Scope of the Comprehensive Study
2.3.1. Market Definition
2.3.2 Countries and Regions Covered
2.3.3 Research Objective
2.3.4 Units, Currency, and Conversions
2.3.5 Industry Value Chain
2.4. Key Market Segments
2.5. Key Companies
2.6. Study Period
Chapter 3. Strategic Analysis Review
3.1. Fish Skin Gelatin Pricing Analysis and Forecast
3.2. Porter’s Five Forces
3.3. Market Ecosystem
3.4. SWOT Analysis
3.5. Regulatory Scenario
3.3. Effects of Inflation, Russia-Ukraine War, moderating economic growth, and other macroeconomic factors
Chapter 4. Competitive Landscape
4.1. Market Share Analysis
4.1.1. Global Fish Skin Gelatin Market Share by Company, 2023
4.1.2. Product Offerings of Leading Fish Skin Gelatin Companies
4.2. Market Entropy
4.2.1. New Product Launches in the Industry
4.2.2. Mergers, Acquisitions, Joint ventures, and Partnerships
4.3. Key Strategies and Best Practices
Chapter 5. Global Market Projections: Best, Reference, and Low Case Scenarios
5.1. Growth Analysis- Case Scenario Definitions
5.2. Low Growth Case Scenario Forecasts
5.3. Reference Growth Case Scenario Forecasts
5.4. High Growth Case Scenario Forecasts
Chapter 6. Market Dynamics
6.1. Fish Skin Gelatin Market Drivers
6.2. Fish Skin Gelatin Market Challenges
6.6. Fish Skin Gelatin Market Opportunities
6.4. Fish Skin Gelatin Market Trends
Chapter 7. Global Fish Skin Gelatin Market Outlook Trends
7.1. Global Fish Skin Gelatin Revenue (USD Million) and CAGR (%) by Type (2021-2032)
7.2. Global Fish Skin Gelatin Revenue (USD Million) and CAGR (%) by Application (2021-2032)
7.3. Global Fish Skin Gelatin Revenue (USD Million) and CAGR (%) by Product (2021-2032)
By Type
0.4
0.5
By Application
Medical
Food
Others
Chapter 8. Global Fish Skin Gelatin Regional Analysis and Outlook
8.1. Global Fish Skin Gelatin Revenue (USD Million) By Regions (2021- 2032)
8.2. North America Fish Skin Gelatin Revenue (USD Million) by Country (2021-2032)
8.2.1. United States Fish Skin Gelatin Regional Analysis and Outlook
8.2.2. Canada Fish Skin Gelatin Regional Analysis and Outlook
8.2.3. Mexico Fish Skin Gelatin Regional Analysis and Outlook
8.3. Europe Fish Skin Gelatin Revenue (USD Million), by Country (2021-2032)
8.3.1. Germany Fish Skin Gelatin Regional Analysis and Outlook
8.3.2. France Fish Skin Gelatin Regional Analysis and Outlook
8.3.3. United Kingdom Fish Skin Gelatin Regional Analysis and Outlook
8.3.4. Spain Fish Skin Gelatin Regional Analysis and Outlook
8.3.5. Italy Fish Skin Gelatin Regional Analysis and Outlook
8.3.6. Russia Fish Skin Gelatin Regional Analysis and Outlook
8.3.7. Rest of Europe Fish Skin Gelatin Regional Analysis and Outlook
8.4. Asia Pacific Fish Skin Gelatin Revenue (USD Million) by Country (2021-2032)
8.4.1. China Fish Skin Gelatin Regional Analysis and Outlook
8.4.2. Japan Fish Skin Gelatin Regional Analysis and Outlook
8.4.3. India Fish Skin Gelatin Regional Analysis and Outlook
8.4.4. South Korea Fish Skin Gelatin Regional Analysis and Outlook
8.4.5. Australia Fish Skin Gelatin Regional Analysis and Outlook
8.4.6. South East Asia Fish Skin Gelatin Regional Analysis and Outlook
8.4.7. Rest of Asia Pacific Fish Skin Gelatin Regional Analysis and Outlook
8.5. South America Fish Skin Gelatin Revenue (USD Million), by Country (2021-2032)
8.5.1. Brazil Fish Skin Gelatin Regional Analysis and Outlook
8.5.2. Argentina Fish Skin Gelatin Regional Analysis and Outlook
8.5.3. Rest of South America Fish Skin Gelatin Regional Analysis and Outlook
8.6. Middle East and Africa Fish Skin Gelatin Revenue (USD Million) by Country (2021-2032)
8.6.1. Middle East Fish Skin Gelatin Regional Analysis and Outlook
8.6.2. Africa Fish Skin Gelatin Regional Analysis and Outlook
Chapter 9. North America Fish Skin Gelatin Analysis and Outlook
9.1. North America Fish Skin Gelatin Revenue (USD Million) by Segments (2021-2032)
9.1.1. North America Fish Skin Gelatin Revenue (USD Million) by Type (2021-2032)
9.1.2. North America Fish Skin Gelatin Revenue (USD Million) by Application (2021-2032)
9.1.3. North America Fish Skin Gelatin Revenue (USD Million) by Product (2021-2032)
By Type
0.4
0.5
By Application
Medical
Food
Others
Chapter 10. Europe Fish Skin Gelatin Analysis and Outlook
10.1. Europe Fish Skin Gelatin Revenue (USD Million), by Segments (USD Million) (2021-2032)
10.1.1. Europe Fish Skin Gelatin Revenue (USD Million) by Type (2021-2032)
10.1.2. Europe Fish Skin Gelatin Revenue (USD Million) by Application (2021-2032)
10.1.3. Europe Fish Skin Gelatin Revenue (USD Million) by Product (2021-2032)
By Type
0.4
0.5
By Application
Medical
Food
Others
Chapter 11. Asia Pacific Fish Skin Gelatin Analysis and Outlook
11.1. Asia Pacific Fish Skin Gelatin Revenue (USD Million), and Revenue (USD Million) by Segments (2021-2032)
11.1.1. Asia Pacific Fish Skin Gelatin Revenue (USD Million) by Type (2021-2032)
11.1.2. Asia Pacific Fish Skin Gelatin Revenue (USD Million) by Application (2021-2032)
11.1.3. Asia Pacific Fish Skin Gelatin Revenue (USD Million) by Product (2021-2032)
By Type
0.4
0.5
By Application
Medical
Food
Others
Chapter 12. South America Fish Skin Gelatin Analysis and Outlook
12.1. South America Fish Skin Gelatin Revenue (USD Million), by Segments (2021-2032)
12.1.1. South America Fish Skin Gelatin Revenue (USD Million) by Type (2021-2032)
12.1.2. South America Fish Skin Gelatin Revenue (USD Million) by Application (2021-2032)
12.1.3. South America Fish Skin Gelatin Revenue (USD Million) by Product (2021-2032)
By Type
0.4
0.5
By Application
Medical
Food
Others
Chapter 13. Middle East and Africa Fish Skin Gelatin Analysis and Outlook
13.1. Middle East and Africa Fish Skin Gelatin Revenue (USD Million), by Segments (2021-2032)
13.1.1. Middle East and Africa Fish Skin Gelatin Revenue (USD Million) by Type (2021-2032)
13.1.2. Middle East and Africa Fish Skin Gelatin Revenue (USD Million) by Application (2021-2032)
13.1.3. Middle East and Africa Fish Skin Gelatin Revenue (USD Million) by Product (2021-2032)
By Type
0.4
0.5
By Application
Medical
Food
Others
Chapter 14. Fish Skin Gelatin Company Profiles
14.1 Business Overview
14.2 Product Profiles
14.3 SWOT Profiles
14.5 Recent Developments
14.6 Financial Profile
List of Companies
Aurion
Biotium
Kesheng
Merck
Weishardt
15. Methodology and Data Sources
15.1 Customization Offerings
15.2 Subscription Services
15.3 Related Reports
15.4 Publisher Expertise
LIST OF TABLES
Table 1 Market Segmentation Analysis
Table 2 Global Fish Skin Gelatin Market Share of Leading Companies, 2023
Table 3 Product Offerings of Leading Companies
Table 4 Low Growth Scenario Forecasts
Table 5 Reference Case Growth Scenario
Table 6 High Growth Case Scenario
Table 7 Global Fish Skin Gelatin Revenue (USD Million) And CAGR (%) By Type (2021-2032)
Table 8 Global Fish Skin Gelatin Revenue (USD Million) And CAGR (%) By Application (2021-2032)
Table 9 Global Fish Skin Gelatin Revenue (USD Million) And CAGR (%) By Product (2021-2032)
Table 10 Global Fish Skin Gelatin Market Revenue (USD Million) By Regions (2021-2032)
Table 11 Global Fish Skin Gelatin Market Share (%) By Regions (2021-2032)
Table 12 North America Fish Skin Gelatin Revenue (USD Million) By Country (2021-2032)
Table 13 Europe Fish Skin Gelatin Revenue (USD Million) By Country (2021-2032)
Table 14 Asia Pacific Fish Skin Gelatin Revenue (USD Million) By Country (2021-2032)
Table 15 South America Fish Skin Gelatin Revenue (USD Million) By Country (2021-2032)
Table 16 Middle East and Africa Fish Skin Gelatin Revenue (USD Million) By Region (2021-2032)
Table 17 North America Fish Skin Gelatin Revenue (USD Million) By Type (2021-2032)
Table 18 North America Fish Skin Gelatin Revenue (USD Million) By Application (2021-2032)
Table 19 North America Fish Skin Gelatin Revenue (USD Million) By Product (2021-2032)
Table 20 Europe Fish Skin Gelatin Revenue (USD Million) By Type (2021-2032)
Table 21 Europe Fish Skin Gelatin Revenue (USD Million) By Application (2021-2032)
Table 22 Europe Fish Skin Gelatin Revenue (USD Million) By Product (2021-2032)
Table 23 Asia Pacific Fish Skin Gelatin Revenue (USD Million) By Type (2021-2032)
Table 24 Asia Pacific Fish Skin Gelatin Revenue (USD Million) By Application (2021-2032)
Table 25 Asia Pacific Fish Skin Gelatin Revenue (USD Million) By Product (2021-2032)
Table 26 South America Fish Skin Gelatin Revenue (USD Million) By Type (2021-2032)
Table 27 South America Fish Skin Gelatin Revenue (USD Million) By Application (2021-2032)
Table 28 South America Fish Skin Gelatin Revenue (USD Million) By Product (2021-2032)
Table 29 Middle East and Africa Fish Skin Gelatin Revenue (USD Million) By Type (2021-2032)
Table 30 Middle East and Africa Fish Skin Gelatin Revenue (USD Million) By Application (2021-2032)
Table 31 Middle East and Africa Fish Skin Gelatin Revenue (USD Million) By Product (2021-2032)
LIST OF FIGURES
Figure 1. Market Scope
Figure 2. Pricing Forecasts Per Unit, 2023- 2032
Figure 3. Porter’s Five Forces
Figure 4. Global Fish Skin Gelatin Market Revenue (USD Million) By Regions (2021-2032)
Figure 5. Global Fish Skin Gelatin Market Share (%) By Regions (2023)
Figure 6. North America Fish Skin Gelatin Revenue (USD Million) By Country (2021-2032)
Figure 7. United States Fish Skin Gelatin Revenue (USD Million) By Country (2021-2032)
Figure 8. Canada Fish Skin Gelatin Revenue (USD Million) By Country (2021-2032)
Figure 9. Mexico Fish Skin Gelatin Revenue (USD Million) By Country (2021-2032)
Figure 10. Europe Fish Skin Gelatin Revenue (USD Million) By Country (2021-2032)
Figure 11. Germany Fish Skin Gelatin Revenue (USD Million) By Country (2021-2032)
Figure 12. France Fish Skin Gelatin Revenue (USD Million) By Country (2021-2032)
Figure 13. United Kingdom Fish Skin Gelatin Revenue (USD Million) By Country (2021-2032)
Figure 14. Spain Fish Skin Gelatin Revenue (USD Million) By Country (2021-2032)
Figure 15. Italy Fish Skin Gelatin Revenue (USD Million) By Country (2021-2032)
Figure 16. Russia Fish Skin Gelatin Revenue (USD Million) By Country (2021-2032)
Figure 17. Rest of Europe Fish Skin Gelatin Revenue (USD Million) By Country (2021-2032)
Figure 11. Asia Pacific Fish Skin Gelatin Revenue (USD Million) By Country (2021-2032)
Figure 12. China Fish Skin Gelatin Revenue (USD Million) By Country (2021-2032)
Figure 13. Japan Fish Skin Gelatin Revenue (USD Million) By Country (2021-2032)
Figure 14. India Fish Skin Gelatin Revenue (USD Million) By Country (2021-2032)
Figure 15. South Korea Fish Skin Gelatin Revenue (USD Million) By Country (2021-2032)
Figure 16. Australia Fish Skin Gelatin Revenue (USD Million) By Country (2021-2032)
Figure 17. South East Asia Fish Skin Gelatin Revenue (USD Million) By Country (2021-2032)
Figure 18. South America Fish Skin Gelatin Revenue (USD Million) By Country (2021-2032)
Figure 19. Brazil Fish Skin Gelatin Revenue (USD Million) By Country (2021-2032)
Figure 20. Argentina Fish Skin Gelatin Revenue (USD Million) By Country (2021-2032)
Figure 21. Rest of Asia Pacific Fish Skin Gelatin Revenue (USD Million) By Country (2021-2032)
Figure 22. Middle East and Africa Fish Skin Gelatin Revenue (USD Million) By Region (2021-2032)
Figure 23. Saudi Arabia Fish Skin Gelatin Revenue (USD Million) By Region (2021-2032)
Figure 24. The UAE Fish Skin Gelatin Revenue (USD Million) By Region (2021-2032)
Figure 25. Rest of Middle East Fish Skin Gelatin Revenue (USD Million) By Region (2021-2032)
Figure 26. South Africa Fish Skin Gelatin Revenue (USD Million) By Region (2021-2032)
Figure 27. Africa Fish Skin Gelatin Revenue (USD Million) By Region (2021-2032)
Figure 28. North America Fish Skin Gelatin Revenue (USD Million) By Type (2021-2032)
Figure 29. North America Fish Skin Gelatin Revenue (USD Million) By Application (2021-2032)
Figure 30. North America Fish Skin Gelatin Revenue (USD Million) By Product (2021-2032)
Figure 31. Europe Fish Skin Gelatin Revenue (USD Million) By Type (2021-2032)
Figure 32. Europe Fish Skin Gelatin Revenue (USD Million) By Application (2021-2032)
Figure 33. Europe Fish Skin Gelatin Revenue (USD Million) By Product (2021-2032)
Figure 34. Asia Pacific Fish Skin Gelatin Revenue (USD Million) By Type (2021-2032)
Figure 35. Asia Pacific Fish Skin Gelatin Revenue (USD Million) By Application (2021-2032)
Figure 36. Asia Pacific Fish Skin Gelatin Revenue (USD Million) By Product (2021-2032)
Figure 37. South America Fish Skin Gelatin Revenue (USD Million) By Type (2021-2032)
Figure 38. South America Fish Skin Gelatin Revenue (USD Million) By Application (2021-2032)
Figure 39. South America Fish Skin Gelatin Revenue (USD Million) By Product (2021-2032)
Figure 40. Middle East and Africa Fish Skin Gelatin Revenue (USD Million) By Type (2021-2032)
Figure 41. Middle East and Africa Fish Skin Gelatin Revenue (USD Million) By Application (2021-2032)
Figure 42. Middle East and Africa Fish Skin Gelatin Revenue (USD Million) By Product (2021-2032)
By Type
0.4
0.5
By Application
Medical
Food
Others
Countries Analyzed
North America (US, Canada, Mexico)
Europe (Germany, UK, France, Spain, Italy, Russia, Rest of Europe)
Asia Pacific (China, India, Japan, South Korea, Australia, South East Asia, Rest of Asia)
South America (Brazil, Argentina, Rest of South America)
Middle East and Africa (Saudi Arabia, UAE, Rest of Middle East, South Africa, Egypt, Rest of Africa)
