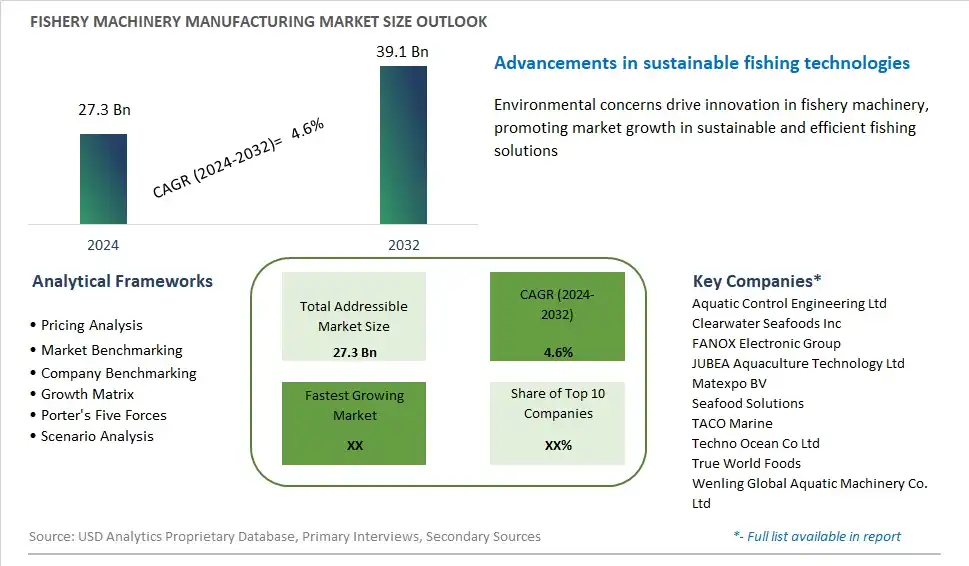
Global Fishery Machinery Manufacturing Market Size is valued at $27.3 Billion in 2024 and is forecast to register a growth rate (CAGR) of 4.6% to reach $39.1 Billion by 2032.
The global Fishery Machinery Manufacturing Market Comprehensive Study analyzes and forecasts the market size across 6 regions and 24 countries for diverse segments -By Mode of Operation (Automatic, Semi-Automatic), By Equipment (Incinerators, Clipping Machines, Gutting Machines, Hammer Mills, Scales, Skinners, Wrap Machines, Others), By Process (Cleaning, Cooking, Drying, Grinding, Packaging, Peeling, Smoking), By End-user (Retail, Food Processing, Others)
An Introduction to Fishery Machinery Manufacturing Market
In 2024, the fishery machinery manufacturing market is experiencing robust growth, driven by advancements in technology and the increasing demand for efficient and sustainable fishery practices. Fishery machinery includes a wide range of equipment, such as fishing vessels, nets, processing machines, and aquaculture systems. The market is benefiting from innovations in automation, robotics, and IoT (Internet of Things), which are enhancing the efficiency, productivity, and traceability of fishery operations. The growing focus on sustainable fishing practices and the need to comply with stringent environmental regulations are prompting manufacturers to develop eco-friendly and energy-efficient machinery. Additionally, the rising demand for seafood, fueled by population growth and dietary shifts towards healthier protein sources, is driving investments in modernizing fishery infrastructure. The fishery machinery manufacturing market is poised for continued expansion as technological advancements and sustainability initiatives shape the future of the fishing industry.
Fishery Machinery Manufacturing Competitive Landscape
The market report analyses the leading companies in the industry including Aquatic Control Engineering Ltd, Clearwater Seafoods Inc, FANOX Electronic Group, JUBEA Aquaculture Technology Ltd, Matexpo BV, Seafood Solutions, TACO Marine, Techno Ocean Co Ltd, True World Foods, Wenling Global Aquatic Machinery Co. Ltd, and Others.
Fishery Machinery Manufacturing Market Dynamics
Fishery Machinery Manufacturing Market Trend: Automation and Technological Advancements
One of the most prominent trends in fishery machinery manufacturing is the increasing adoption of automation and technological advancements in equipment and processes. As the fishing industry evolves to meet growing demand and sustainability challenges, there is a shift towards the use of advanced machinery and automation systems to improve efficiency, productivity, and safety in fishery operations. This trend is driven by factors such as labor shortages, rising labor costs, and the need for precision and consistency in fishing and processing activities. Manufacturers are developing innovative machinery and equipment equipped with sensors, robotics, and artificial intelligence capabilities to automate various tasks, such as harvesting, sorting, processing, and packaging. Additionally, advancements in technology enable real-time monitoring, data analysis, and remote operation of fishery machinery, allowing for better control and optimization of operations. As fishery businesses seek to enhance productivity, reduce labor dependency, and comply with sustainability standards, the adoption of automated machinery becomes increasingly essential.
Market Driver: Global Demand for Seafood Products
The primary driver of fishery machinery manufacturing is the global demand for seafood products. With the world's population steadily increasing and dietary preferences shifting towards healthier and protein-rich foods, there is a rising demand for fish and seafood products across various regions and markets. This driver is fueled by factors such as population growth, urbanization, rising disposable incomes, and the growing awareness of the health benefits associated with seafood consumption. As a result, fishery businesses are expanding their operations and investing in modern machinery and equipment to meet the growing demand for seafood products efficiently. Furthermore, globalization and international trade agreements have facilitated the exchange of seafood products between countries, creating opportunities for fishery machinery manufacturers to supply equipment to domestic and international markets. By addressing the increasing demand for seafood and supporting the growth of fishery businesses, manufacturers of fishery machinery can capitalize on this driver and contribute to the sustainability and profitability of the industry.
Market Opportunity: Innovation in Sustainable Practices and Green Technologies
A significant opportunity for fishery machinery manufacturing lies in innovation in sustainable practices and green technologies. With growing concerns about overfishing, habitat degradation, and marine pollution, there is a growing emphasis on adopting environmentally responsible practices in the fishing industry. Fishery machinery manufacturers can seize this opportunity by developing and promoting sustainable technologies and equipment that minimize environmental impact and support responsible fishing practices. This includes the development of energy-efficient machinery, waste reduction systems, bycatch mitigation devices, and eco-friendly materials. Additionally, manufacturers can collaborate with fishery businesses, government agencies, and environmental organizations to promote sustainable fishing practices and compliance with regulatory standards. By aligning with sustainability goals and offering eco-friendly solutions, fishery machinery manufacturers can differentiate themselves in the market, attract environmentally conscious customers, and contribute to the long-term health and resilience of marine ecosystems.
Fishery Machinery Manufacturing Market Share Analysis: Automatic Mode of Operation held the dominant market share in 2024
Within the Fishery Machinery Manufacturing Market, the automatic mode of operation segment is the largest, commanding a significant share of the industry. This dominance can be attributed to several factors, including technological advancements, efficiency gains, and labor cost savings. Automatic fishery machinery offers streamlined and automated processes for tasks such as fish sorting, cleaning, and packaging, resulting in increased productivity and reduced labor requirements. Further, automatic machinery enables precise control over processing parameters, ensuring consistent product quality and minimizing waste. Additionally, the scalability and versatility of automatic fishery machinery make it suitable for a wide range of fishery operations, from small-scale processing facilities to large industrial plants. As the demand for processed fish products continues to grow globally, driven by factors such as population growth and changing dietary preferences, the automatic mode of operation segment is expected to maintain its stronghold in the Fishery Machinery Manufacturing Market, driving market growth and innovation.
Fishery Machinery Manufacturing Market Share Analysis: Gutting Machines market is poised to register the fastest growth rae over the forecast period to 2032
Among the equipment segments in the Fishery Machinery Manufacturing Market, gutting machines stand out as the fastest-growing, experiencing significant expansion in recent years. The robust growth outlook is driven by several factors, including increasing demand for efficiency and automation in fish processing operations, as well as advancements in machine technology. Gutting machines streamline the process of removing internal organs from fish, reducing manual labor and improving processing speed. Additionally, gutting machines offer precision and consistency in gutting operations, ensuring uniformity in product quality and minimizing waste. Further, the growing global demand for processed fish products, driven by factors such as population growth and rising seafood consumption, has spurred the adoption of gutting machines in fish processing facilities worldwide. As fishery operators seek to enhance productivity, reduce operating costs, and meet consumer demand for high-quality seafood products, the gutting machine segment is expected to sustain its rapid growth trajectory, driving market expansion and innovation in the Fishery Machinery Manufacturing Market.
Fishery Machinery Manufacturing Market Share Analysis: Packaging Process held the dominant market share in 2024
Within the Fishery Machinery Manufacturing Market, the packaging process segment is the largest, commanding a significant share of the industry. This dominance can be attributed to several factors, including the critical role of packaging in preserving and protecting seafood products, ensuring their freshness and quality from production to consumption. Packaging machinery facilitates the efficient and hygienic packaging of various seafood products, including fish fillets, shrimp, and canned seafood, in a variety of formats such as vacuum-sealed bags, trays, and cans. Further, the increasing demand for convenience and ready-to-eat seafood products has driven the adoption of advanced packaging technologies, such as modified atmosphere packaging (MAP) and intelligent packaging solutions, which extend shelf life and enhance product presentation. Additionally, stringent regulatory requirements and consumer preferences for sustainable and eco-friendly packaging materials have spurred innovation in packaging machinery, further consolidating the dominance of the packaging process segment in the Fishery Machinery Manufacturing Market. As seafood consumption continues to rise globally, fueled by factors such as population growth and changing dietary habits, the packaging process segment is expected to maintain its stronghold, driving market growth and technological advancement in the industry.
Fishery Machinery Manufacturing Market Segmentation
By Mode of Operation
Automatic
Semi-Automatic
By Equipment
Incinerators
Clipping Machines
Gutting Machines
Hammer Mills
Scales
Skinners
Wrap Machines
Others
By Process
Cleaning
Cooking
Drying
Grinding
Packaging
Peeling
Smoking
By End-User
Retail
Food Processing
Others
Countries Analyzed
North America (US, Canada, Mexico)
Europe (Germany, UK, France, Spain, Italy, Russia, Rest of Europe)
Asia Pacific (China, India, Japan, South Korea, Australia, South East Asia, Rest of Asia)
South America (Brazil, Argentina, Rest of South America)
Middle East and Africa (Saudi Arabia, UAE, Rest of Middle East, South Africa, Egypt, Rest of Africa)
Fishery Machinery Manufacturing Companies Profiled in the Study
Aquatic Control Engineering Ltd
Clearwater Seafoods Inc
FANOX Electronic Group
JUBEA Aquaculture Technology Ltd
Matexpo BV
Seafood Solutions
TACO Marine
Techno Ocean Co Ltd
True World Foods
Wenling Global Aquatic Machinery Co. Ltd
*- List Not Exhaustive
Chapter 1. TABLE OF CONTENTS
Chapter 2. Introduction to Fishery Machinery Manufacturing Market
2.1. Market Overview
2.2. Key Statistics and Report Highlights
2.3. Scope of the Comprehensive Study
2.3.1. Market Definition
2.3.2 Countries and Regions Covered
2.3.3 Research Objective
2.3.4 Units, Currency, and Conversions
2.3.5 Industry Value Chain
2.4. Key Market Segments
2.5. Key Companies
2.6. Study Period
Chapter 3. Strategic Analysis Review
3.1. Fishery Machinery Manufacturing Pricing Analysis and Forecast
3.2. Porter’s Five Forces
3.3. Market Ecosystem
3.4. SWOT Analysis
3.5. Regulatory Scenario
3.3. Effects of Inflation, Russia-Ukraine War, moderating economic growth, and other macroeconomic factors
Chapter 4. Competitive Landscape
4.1. Market Share Analysis
4.1.1. Global Fishery Machinery Manufacturing Market Share by Company, 2023
4.1.2. Product Offerings of Leading Fishery Machinery Manufacturing Companies
4.2. Market Entropy
4.2.1. New Product Launches in the Industry
4.2.2. Mergers, Acquisitions, Joint ventures, and Partnerships
4.3. Key Strategies and Best Practices
Chapter 5. Global Market Projections: Best, Reference, and Low Case Scenarios
5.1. Growth Analysis- Case Scenario Definitions
5.2. Low Growth Case Scenario Forecasts
5.3. Reference Growth Case Scenario Forecasts
5.4. High Growth Case Scenario Forecasts
Chapter 6. Market Dynamics
6.1. Fishery Machinery Manufacturing Market Drivers
6.2. Fishery Machinery Manufacturing Market Challenges
6.6. Fishery Machinery Manufacturing Market Opportunities
6.4. Fishery Machinery Manufacturing Market Trends
Chapter 7. Global Fishery Machinery Manufacturing Market Outlook Trends
7.1. Global Fishery Machinery Manufacturing Revenue (USD Million) and CAGR (%) by Type (2021-2032)
7.2. Global Fishery Machinery Manufacturing Revenue (USD Million) and CAGR (%) by Application (2021-2032)
7.3. Global Fishery Machinery Manufacturing Revenue (USD Million) and CAGR (%) by Product (2021-2032)
By Mode of Operation
Automatic
Semi-Automatic
By Equipment
Incinerators
Clipping Machines
Gutting Machines
Hammer Mills
Scales
Skinners
Wrap Machines
Others
By Process
Cleaning
Cooking
Drying
Grinding
Packaging
Peeling
Smoking
By End-User
Retail
Food Processing
Others
Chapter 8. Global Fishery Machinery Manufacturing Regional Analysis and Outlook
8.1. Global Fishery Machinery Manufacturing Revenue (USD Million) By Regions (2021- 2032)
8.2. North America Fishery Machinery Manufacturing Revenue (USD Million) by Country (2021-2032)
8.2.1. United States Fishery Machinery Manufacturing Regional Analysis and Outlook
8.2.2. Canada Fishery Machinery Manufacturing Regional Analysis and Outlook
8.2.3. Mexico Fishery Machinery Manufacturing Regional Analysis and Outlook
8.3. Europe Fishery Machinery Manufacturing Revenue (USD Million), by Country (2021-2032)
8.3.1. Germany Fishery Machinery Manufacturing Regional Analysis and Outlook
8.3.2. France Fishery Machinery Manufacturing Regional Analysis and Outlook
8.3.3. United Kingdom Fishery Machinery Manufacturing Regional Analysis and Outlook
8.3.4. Spain Fishery Machinery Manufacturing Regional Analysis and Outlook
8.3.5. Italy Fishery Machinery Manufacturing Regional Analysis and Outlook
8.3.6. Russia Fishery Machinery Manufacturing Regional Analysis and Outlook
8.3.7. Rest of Europe Fishery Machinery Manufacturing Regional Analysis and Outlook
8.4. Asia Pacific Fishery Machinery Manufacturing Revenue (USD Million) by Country (2021-2032)
8.4.1. China Fishery Machinery Manufacturing Regional Analysis and Outlook
8.4.2. Japan Fishery Machinery Manufacturing Regional Analysis and Outlook
8.4.3. India Fishery Machinery Manufacturing Regional Analysis and Outlook
8.4.4. South Korea Fishery Machinery Manufacturing Regional Analysis and Outlook
8.4.5. Australia Fishery Machinery Manufacturing Regional Analysis and Outlook
8.4.6. South East Asia Fishery Machinery Manufacturing Regional Analysis and Outlook
8.4.7. Rest of Asia Pacific Fishery Machinery Manufacturing Regional Analysis and Outlook
8.5. South America Fishery Machinery Manufacturing Revenue (USD Million), by Country (2021-2032)
8.5.1. Brazil Fishery Machinery Manufacturing Regional Analysis and Outlook
8.5.2. Argentina Fishery Machinery Manufacturing Regional Analysis and Outlook
8.5.3. Rest of South America Fishery Machinery Manufacturing Regional Analysis and Outlook
8.6. Middle East and Africa Fishery Machinery Manufacturing Revenue (USD Million) by Country (2021-2032)
8.6.1. Middle East Fishery Machinery Manufacturing Regional Analysis and Outlook
8.6.2. Africa Fishery Machinery Manufacturing Regional Analysis and Outlook
Chapter 9. North America Fishery Machinery Manufacturing Analysis and Outlook
9.1. North America Fishery Machinery Manufacturing Revenue (USD Million) by Segments (2021-2032)
9.1.1. North America Fishery Machinery Manufacturing Revenue (USD Million) by Type (2021-2032)
9.1.2. North America Fishery Machinery Manufacturing Revenue (USD Million) by Application (2021-2032)
9.1.3. North America Fishery Machinery Manufacturing Revenue (USD Million) by Product (2021-2032)
By Mode of Operation
Automatic
Semi-Automatic
By Equipment
Incinerators
Clipping Machines
Gutting Machines
Hammer Mills
Scales
Skinners
Wrap Machines
Others
By Process
Cleaning
Cooking
Drying
Grinding
Packaging
Peeling
Smoking
By End-User
Retail
Food Processing
Others
Chapter 10. Europe Fishery Machinery Manufacturing Analysis and Outlook
10.1. Europe Fishery Machinery Manufacturing Revenue (USD Million), by Segments (USD Million) (2021-2032)
10.1.1. Europe Fishery Machinery Manufacturing Revenue (USD Million) by Type (2021-2032)
10.1.2. Europe Fishery Machinery Manufacturing Revenue (USD Million) by Application (2021-2032)
10.1.3. Europe Fishery Machinery Manufacturing Revenue (USD Million) by Product (2021-2032)
By Mode of Operation
Automatic
Semi-Automatic
By Equipment
Incinerators
Clipping Machines
Gutting Machines
Hammer Mills
Scales
Skinners
Wrap Machines
Others
By Process
Cleaning
Cooking
Drying
Grinding
Packaging
Peeling
Smoking
By End-User
Retail
Food Processing
Others
Chapter 11. Asia Pacific Fishery Machinery Manufacturing Analysis and Outlook
11.1. Asia Pacific Fishery Machinery Manufacturing Revenue (USD Million), and Revenue (USD Million) by Segments (2021-2032)
11.1.1. Asia Pacific Fishery Machinery Manufacturing Revenue (USD Million) by Type (2021-2032)
11.1.2. Asia Pacific Fishery Machinery Manufacturing Revenue (USD Million) by Application (2021-2032)
11.1.3. Asia Pacific Fishery Machinery Manufacturing Revenue (USD Million) by Product (2021-2032)
By Mode of Operation
Automatic
Semi-Automatic
By Equipment
Incinerators
Clipping Machines
Gutting Machines
Hammer Mills
Scales
Skinners
Wrap Machines
Others
By Process
Cleaning
Cooking
Drying
Grinding
Packaging
Peeling
Smoking
By End-User
Retail
Food Processing
Others
Chapter 12. South America Fishery Machinery Manufacturing Analysis and Outlook
12.1. South America Fishery Machinery Manufacturing Revenue (USD Million), by Segments (2021-2032)
12.1.1. South America Fishery Machinery Manufacturing Revenue (USD Million) by Type (2021-2032)
12.1.2. South America Fishery Machinery Manufacturing Revenue (USD Million) by Application (2021-2032)
12.1.3. South America Fishery Machinery Manufacturing Revenue (USD Million) by Product (2021-2032)
By Mode of Operation
Automatic
Semi-Automatic
By Equipment
Incinerators
Clipping Machines
Gutting Machines
Hammer Mills
Scales
Skinners
Wrap Machines
Others
By Process
Cleaning
Cooking
Drying
Grinding
Packaging
Peeling
Smoking
By End-User
Retail
Food Processing
Others
Chapter 13. Middle East and Africa Fishery Machinery Manufacturing Analysis and Outlook
13.1. Middle East and Africa Fishery Machinery Manufacturing Revenue (USD Million), by Segments (2021-2032)
13.1.1. Middle East and Africa Fishery Machinery Manufacturing Revenue (USD Million) by Type (2021-2032)
13.1.2. Middle East and Africa Fishery Machinery Manufacturing Revenue (USD Million) by Application (2021-2032)
13.1.3. Middle East and Africa Fishery Machinery Manufacturing Revenue (USD Million) by Product (2021-2032)
By Mode of Operation
Automatic
Semi-Automatic
By Equipment
Incinerators
Clipping Machines
Gutting Machines
Hammer Mills
Scales
Skinners
Wrap Machines
Others
By Process
Cleaning
Cooking
Drying
Grinding
Packaging
Peeling
Smoking
By End-User
Retail
Food Processing
Others
Chapter 14. Fishery Machinery Manufacturing Company Profiles
14.1 Business Overview
14.2 Product Profiles
14.3 SWOT Profiles
14.5 Recent Developments
14.6 Financial Profile
List of Companies
Aquatic Control Engineering Ltd
Clearwater Seafoods Inc
FANOX Electronic Group
JUBEA Aquaculture Technology Ltd
Matexpo BV
Seafood Solutions
TACO Marine
Techno Ocean Co Ltd
True World Foods
Wenling Global Aquatic Machinery Co. Ltd
15. Methodology and Data Sources
15.1 Customization Offerings
15.2 Subscription Services
15.3 Related Reports
15.4 Publisher Expertise
LIST OF TABLES
Table 1 Market Segmentation Analysis
Table 2 Global Fishery Machinery Manufacturing Market Share of Leading Companies, 2023
Table 3 Product Offerings of Leading Companies
Table 4 Low Growth Scenario Forecasts
Table 5 Reference Case Growth Scenario
Table 6 High Growth Case Scenario
Table 7 Global Fishery Machinery Manufacturing Revenue (USD Million) And CAGR (%) By Type (2021-2032)
Table 8 Global Fishery Machinery Manufacturing Revenue (USD Million) And CAGR (%) By Application (2021-2032)
Table 9 Global Fishery Machinery Manufacturing Revenue (USD Million) And CAGR (%) By Product (2021-2032)
Table 10 Global Fishery Machinery Manufacturing Market Revenue (USD Million) By Regions (2021-2032)
Table 11 Global Fishery Machinery Manufacturing Market Share (%) By Regions (2021-2032)
Table 12 North America Fishery Machinery Manufacturing Revenue (USD Million) By Country (2021-2032)
Table 13 Europe Fishery Machinery Manufacturing Revenue (USD Million) By Country (2021-2032)
Table 14 Asia Pacific Fishery Machinery Manufacturing Revenue (USD Million) By Country (2021-2032)
Table 15 South America Fishery Machinery Manufacturing Revenue (USD Million) By Country (2021-2032)
Table 16 Middle East and Africa Fishery Machinery Manufacturing Revenue (USD Million) By Region (2021-2032)
Table 17 North America Fishery Machinery Manufacturing Revenue (USD Million) By Type (2021-2032)
Table 18 North America Fishery Machinery Manufacturing Revenue (USD Million) By Application (2021-2032)
Table 19 North America Fishery Machinery Manufacturing Revenue (USD Million) By Product (2021-2032)
Table 20 Europe Fishery Machinery Manufacturing Revenue (USD Million) By Type (2021-2032)
Table 21 Europe Fishery Machinery Manufacturing Revenue (USD Million) By Application (2021-2032)
Table 22 Europe Fishery Machinery Manufacturing Revenue (USD Million) By Product (2021-2032)
Table 23 Asia Pacific Fishery Machinery Manufacturing Revenue (USD Million) By Type (2021-2032)
Table 24 Asia Pacific Fishery Machinery Manufacturing Revenue (USD Million) By Application (2021-2032)
Table 25 Asia Pacific Fishery Machinery Manufacturing Revenue (USD Million) By Product (2021-2032)
Table 26 South America Fishery Machinery Manufacturing Revenue (USD Million) By Type (2021-2032)
Table 27 South America Fishery Machinery Manufacturing Revenue (USD Million) By Application (2021-2032)
Table 28 South America Fishery Machinery Manufacturing Revenue (USD Million) By Product (2021-2032)
Table 29 Middle East and Africa Fishery Machinery Manufacturing Revenue (USD Million) By Type (2021-2032)
Table 30 Middle East and Africa Fishery Machinery Manufacturing Revenue (USD Million) By Application (2021-2032)
Table 31 Middle East and Africa Fishery Machinery Manufacturing Revenue (USD Million) By Product (2021-2032)
LIST OF FIGURES
Figure 1. Market Scope
Figure 2. Pricing Forecasts Per Unit, 2023- 2032
Figure 3. Porter’s Five Forces
Figure 4. Global Fishery Machinery Manufacturing Market Revenue (USD Million) By Regions (2021-2032)
Figure 5. Global Fishery Machinery Manufacturing Market Share (%) By Regions (2023)
Figure 6. North America Fishery Machinery Manufacturing Revenue (USD Million) By Country (2021-2032)
Figure 7. United States Fishery Machinery Manufacturing Revenue (USD Million) By Country (2021-2032)
Figure 8. Canada Fishery Machinery Manufacturing Revenue (USD Million) By Country (2021-2032)
Figure 9. Mexico Fishery Machinery Manufacturing Revenue (USD Million) By Country (2021-2032)
Figure 10. Europe Fishery Machinery Manufacturing Revenue (USD Million) By Country (2021-2032)
Figure 11. Germany Fishery Machinery Manufacturing Revenue (USD Million) By Country (2021-2032)
Figure 12. France Fishery Machinery Manufacturing Revenue (USD Million) By Country (2021-2032)
Figure 13. United Kingdom Fishery Machinery Manufacturing Revenue (USD Million) By Country (2021-2032)
Figure 14. Spain Fishery Machinery Manufacturing Revenue (USD Million) By Country (2021-2032)
Figure 15. Italy Fishery Machinery Manufacturing Revenue (USD Million) By Country (2021-2032)
Figure 16. Russia Fishery Machinery Manufacturing Revenue (USD Million) By Country (2021-2032)
Figure 17. Rest of Europe Fishery Machinery Manufacturing Revenue (USD Million) By Country (2021-2032)
Figure 11. Asia Pacific Fishery Machinery Manufacturing Revenue (USD Million) By Country (2021-2032)
Figure 12. China Fishery Machinery Manufacturing Revenue (USD Million) By Country (2021-2032)
Figure 13. Japan Fishery Machinery Manufacturing Revenue (USD Million) By Country (2021-2032)
Figure 14. India Fishery Machinery Manufacturing Revenue (USD Million) By Country (2021-2032)
Figure 15. South Korea Fishery Machinery Manufacturing Revenue (USD Million) By Country (2021-2032)
Figure 16. Australia Fishery Machinery Manufacturing Revenue (USD Million) By Country (2021-2032)
Figure 17. South East Asia Fishery Machinery Manufacturing Revenue (USD Million) By Country (2021-2032)
Figure 18. South America Fishery Machinery Manufacturing Revenue (USD Million) By Country (2021-2032)
Figure 19. Brazil Fishery Machinery Manufacturing Revenue (USD Million) By Country (2021-2032)
Figure 20. Argentina Fishery Machinery Manufacturing Revenue (USD Million) By Country (2021-2032)
Figure 21. Rest of Asia Pacific Fishery Machinery Manufacturing Revenue (USD Million) By Country (2021-2032)
Figure 22. Middle East and Africa Fishery Machinery Manufacturing Revenue (USD Million) By Region (2021-2032)
Figure 23. Saudi Arabia Fishery Machinery Manufacturing Revenue (USD Million) By Region (2021-2032)
Figure 24. The UAE Fishery Machinery Manufacturing Revenue (USD Million) By Region (2021-2032)
Figure 25. Rest of Middle East Fishery Machinery Manufacturing Revenue (USD Million) By Region (2021-2032)
Figure 26. South Africa Fishery Machinery Manufacturing Revenue (USD Million) By Region (2021-2032)
Figure 27. Africa Fishery Machinery Manufacturing Revenue (USD Million) By Region (2021-2032)
Figure 28. North America Fishery Machinery Manufacturing Revenue (USD Million) By Type (2021-2032)
Figure 29. North America Fishery Machinery Manufacturing Revenue (USD Million) By Application (2021-2032)
Figure 30. North America Fishery Machinery Manufacturing Revenue (USD Million) By Product (2021-2032)
Figure 31. Europe Fishery Machinery Manufacturing Revenue (USD Million) By Type (2021-2032)
Figure 32. Europe Fishery Machinery Manufacturing Revenue (USD Million) By Application (2021-2032)
Figure 33. Europe Fishery Machinery Manufacturing Revenue (USD Million) By Product (2021-2032)
Figure 34. Asia Pacific Fishery Machinery Manufacturing Revenue (USD Million) By Type (2021-2032)
Figure 35. Asia Pacific Fishery Machinery Manufacturing Revenue (USD Million) By Application (2021-2032)
Figure 36. Asia Pacific Fishery Machinery Manufacturing Revenue (USD Million) By Product (2021-2032)
Figure 37. South America Fishery Machinery Manufacturing Revenue (USD Million) By Type (2021-2032)
Figure 38. South America Fishery Machinery Manufacturing Revenue (USD Million) By Application (2021-2032)
Figure 39. South America Fishery Machinery Manufacturing Revenue (USD Million) By Product (2021-2032)
Figure 40. Middle East and Africa Fishery Machinery Manufacturing Revenue (USD Million) By Type (2021-2032)
Figure 41. Middle East and Africa Fishery Machinery Manufacturing Revenue (USD Million) By Application (2021-2032)
Figure 42. Middle East and Africa Fishery Machinery Manufacturing Revenue (USD Million) By Product (2021-2032)
By Mode of Operation
Automatic
Semi-Automatic
By Equipment
Incinerators
Clipping Machines
Gutting Machines
Hammer Mills
Scales
Skinners
Wrap Machines
Others
By Process
Cleaning
Cooking
Drying
Grinding
Packaging
Peeling
Smoking
By End-User
Retail
Food Processing
Others
Countries Analyzed
North America (US, Canada, Mexico)
Europe (Germany, UK, France, Spain, Italy, Russia, Rest of Europe)
Asia Pacific (China, India, Japan, South Korea, Australia, South East Asia, Rest of Asia)
South America (Brazil, Argentina, Rest of South America)
Middle East and Africa (Saudi Arabia, UAE, Rest of Middle East, South Africa, Egypt, Rest of Africa)
