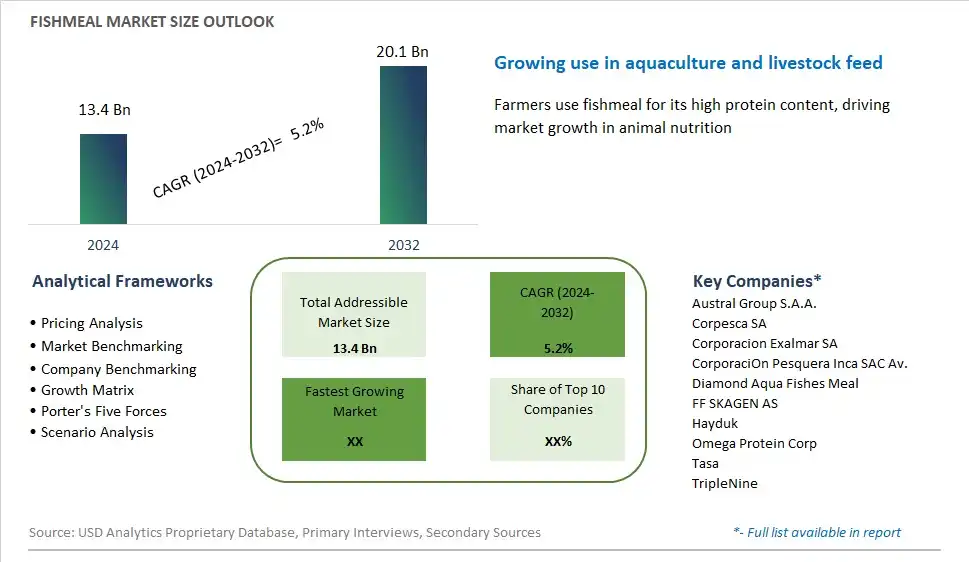
Global Fishmeal Market Size is valued at $13.4 Billion in 2024 and is forecast to register a growth rate (CAGR) of 5.2% to reach $20.1 Billion by 2032.
The global Fishmeal Market Comprehensive Study analyzes and forecasts the market size across 6 regions and 24 countries for diverse segments -By Livestock (Ruminants, Poultry, Swine, Aquatic Animals, Others), By Source (Salmon and Trout, Marine Fish, Carps, Crustaceans, Tilapia, Others), By Application (Fertilizers, Animal Feed, Others)
An Introduction to Fishmeal Market
The market for fishmeal is evolving in 2024, driven by the increasing demand for high-protein feed ingredients in the aquaculture, livestock, and pet food industries. Fishmeal, made from ground-up fish and fish byproducts, is valued for its high protein content, essential amino acids, and digestibility, making it an ideal supplement for enhancing animal growth and performance. However, concerns about overfishing and sustainability have prompted efforts to reduce reliance on wild-caught fish for fishmeal production. Alternative sources of protein, such as plant-based proteins, insect meal, and single-cell proteins, are gaining traction as sustainable alternatives to fishmeal. Moreover, advancements in processing technologies, such as enzymatic hydrolysis and extrusion, are improving the nutritional quality and functional properties of alternative protein sources, making them more viable options for animal feed formulation. As the aquaculture industry continues to expand to meet growing global protein demand, the market for fishmeal is undergoing a transformation towards greater sustainability and innovation.
Fishmeal Competitive Landscape
The market report analyses the leading companies in the industry including Austral Group S.A.A., Corpesca SA, Corporacion Exalmar SA, CorporaciOn Pesquera Inca SAC Av., Diamond Aqua Fishes Meal, FF SKAGEN AS, Hayduk, Omega Protein Corp, Tasa, TripleNine, and Others.
Fishmeal Market Dynamics
Fishmeal Market Trend: Growing Demand for Aquafeed in Aquaculture Industry
One prominent trend in the fishmeal market is the growing demand for aquafeed in the aquaculture industry. As global aquaculture production continues to expand to meet the rising demand for seafood, there is a corresponding increase in the need for high-quality feed ingredients to support the growth and health of farmed fish and shrimp. Fishmeal, renowned for its high protein content and essential amino acids, remains a valuable component of aquafeed formulations due to its superior nutritional profile. With aquaculture representing a significant portion of the world's seafood supply, the demand for fishmeal as a key ingredient in aquafeed is expected to continue its upward trajectory, driven by the expansion of aquaculture operations worldwide.
Market Driver: Growth in Aquaculture Production and Consumption
A key driver behind the fishmeal market is the sustained growth in aquaculture production and consumption globally. As wild fish stocks face challenges such as overfishing and environmental degradation, aquaculture has emerged as a vital solution to meet the growing demand for seafood while reducing pressure on natural ecosystems. Fishmeal plays a crucial role in supporting the rapid growth and development of farmed fish and shrimp, contributing to the efficiency and productivity of aquaculture operations. With rising incomes, changing dietary preferences, and increasing awareness of the health benefits of seafood consumption, the demand for aquaculture products continues to rise, further driving the need for quality feed ingredients like fishmeal.
Market Opportunity: Sustainable Sourcing and Alternative Protein Ingredients
An opportunity for the fishmeal market lies in promoting sustainable sourcing practices and exploring alternative protein ingredients to meet the growing demand for aquafeed while addressing environmental and ethical concerns. With sustainability becoming a top priority for consumers, regulators, and industry stakeholders, there is a growing emphasis on reducing the reliance on wild-caught fish as the primary source of fishmeal. Manufacturers and suppliers can seize this opportunity by investing in sustainable fisheries management practices, promoting responsible sourcing certifications, and exploring innovative solutions such as utilizing byproducts from seafood processing, insect proteins, and plant-based alternatives to supplement or replace traditional fishmeal in aquafeed formulations. By embracing sustainable sourcing and incorporating alternative protein sources, the fishmeal industry can enhance its environmental stewardship, ensure long-term viability, and meet the evolving needs of the aquaculture sector while tapping into new market segments focused on sustainability and ethical sourcing.
Fishmeal Market Share Analysis: Aquatic Animals held the dominant market share in 2024
In the Fishmeal Market, the Aquatic Animals segment is the largest segment due to several factors driving its dominance. Aquatic animals, including farmed fish and shrimp, heavily rely on fishmeal as a vital source of high-quality protein and essential nutrients to support their growth, health, and reproductive performance. Fishmeal is highly prized for its amino acid profile, omega-3 fatty acids, and digestibility, making it an ideal dietary supplement for aquatic species in aquaculture operations. Further, the rapid expansion of the global aquaculture industry to meet the escalating demand for seafood has significantly increased the consumption of fishmeal in aquafeed formulations. Additionally, the sustainable sourcing and utilization of fishmeal align with the growing emphasis on environmentally friendly aquaculture practices and responsible fishery management. Furthermore, advancements in aquafeed formulation technologies and the development of specialized fishmeal products tailored to the nutritional requirements of different aquatic species further contribute to the dominance of the Aquatic Animals segment in the Fishmeal Market. Consequently, the Aquatic Animals segment maintains its leadership position, driven by the critical role of fishmeal in supporting the sustainable growth and development of the aquaculture industry.
Fishmeal Market Share Analysis: Tilapia market is poised to register the fastest growth rae over the forecast period to 2032
In the Fishmeal Market, the Tilapia segment is the fastest-growing segment due to several factors propelling its rapid expansion. Tilapia, a widely cultivated freshwater fish species, is gaining popularity in aquaculture due to its fast growth rate, adaptability to various environmental conditions, and mild flavor profile. As the global demand for seafood continues to rise, there is an increasing focus on sustainable aquaculture practices, with tilapia being recognized as an environmentally friendly protein source. Tilapia farmers are increasingly incorporating fishmeal into their feed formulations to enhance the nutritional quality and growth performance of their stocks, driving demand for fishmeal. Further, advancements in tilapia farming techniques and genetics have led to improvements in feed conversion efficiency and overall productivity, further fueling the demand for fishmeal. Additionally, the rising consumer demand for tilapia as a nutritious and affordable source of protein contributes to the growth of the Tilapia segment in the Fishmeal Market. Consequently, the Tilapia segment is poised for robust growth, driven by the expanding tilapia aquaculture industry and the increasing utilization of fishmeal to support its sustainable growth and development.
Fishmeal Market Share Analysis: Animal Feed held the dominant market share in 2024
In the Fishmeal Market, the Animal Feed segment is the largest segment due to several factors driving its dominance. Fishmeal is widely recognized as a valuable ingredient in animal feed formulations, particularly for aquaculture, poultry, swine, and livestock industries. It is highly prized for its high protein content, essential amino acids, vitamins, and minerals, which are crucial for promoting growth, enhancing feed conversion efficiency, and maintaining overall animal health. The aquaculture sector, in particular, heavily relies on fishmeal as a primary protein source in aquafeed formulations to support the growth and development of farmed fish and shrimp. Additionally, the poultry and livestock industries utilize fishmeal to supplement the nutritional quality of feed rations and improve the performance and productivity of animals. Furthermore, the sustainability and cost-effectiveness of fishmeal as a feed ingredient contribute to its widespread adoption in animal feed applications, driving its dominance in the Fishmeal Market. Consequently, the Animal Feed segment maintains its leadership position, driven by the critical role of fishmeal in meeting the nutritional requirements and supporting the growth of animals across various agricultural sectors.
Fishmeal Market Segmentation
By Livestock
Ruminants
Poultry
Swine
Aquatic Animals
Others
By Source
Salmon and Trout
Marine Fish
Carps
Crustaceans
Tilapia
Others
By Application
Fertilizers
Animal Feed
Others
Countries Analyzed
North America (US, Canada, Mexico)
Europe (Germany, UK, France, Spain, Italy, Russia, Rest of Europe)
Asia Pacific (China, India, Japan, South Korea, Australia, South East Asia, Rest of Asia)
South America (Brazil, Argentina, Rest of South America)
Middle East and Africa (Saudi Arabia, UAE, Rest of Middle East, South Africa, Egypt, Rest of Africa)
Fishmeal Companies Profiled in the Study
Austral Group S.A.A.
Corpesca SA
Corporacion Exalmar SA
CorporaciOn Pesquera Inca SAC Av.
Diamond Aqua Fishes Meal
FF SKAGEN AS
Hayduk
Omega Protein Corp
Tasa
TripleNine
*- List Not Exhaustive
Chapter 1. TABLE OF CONTENTS
Chapter 2. Introduction to Fishmeal Market
2.1. Market Overview
2.2. Key Statistics and Report Highlights
2.3. Scope of the Comprehensive Study
2.3.1. Market Definition
2.3.2 Countries and Regions Covered
2.3.3 Research Objective
2.3.4 Units, Currency, and Conversions
2.3.5 Industry Value Chain
2.4. Key Market Segments
2.5. Key Companies
2.6. Study Period
Chapter 3. Strategic Analysis Review
3.1. Fishmeal Pricing Analysis and Forecast
3.2. Porter’s Five Forces
3.3. Market Ecosystem
3.4. SWOT Analysis
3.5. Regulatory Scenario
3.3. Effects of Inflation, Russia-Ukraine War, moderating economic growth, and other macroeconomic factors
Chapter 4. Competitive Landscape
4.1. Market Share Analysis
4.1.1. Global Fishmeal Market Share by Company, 2023
4.1.2. Product Offerings of Leading Fishmeal Companies
4.2. Market Entropy
4.2.1. New Product Launches in the Industry
4.2.2. Mergers, Acquisitions, Joint ventures, and Partnerships
4.3. Key Strategies and Best Practices
Chapter 5. Global Market Projections: Best, Reference, and Low Case Scenarios
5.1. Growth Analysis- Case Scenario Definitions
5.2. Low Growth Case Scenario Forecasts
5.3. Reference Growth Case Scenario Forecasts
5.4. High Growth Case Scenario Forecasts
Chapter 6. Market Dynamics
6.1. Fishmeal Market Drivers
6.2. Fishmeal Market Challenges
6.6. Fishmeal Market Opportunities
6.4. Fishmeal Market Trends
Chapter 7. Global Fishmeal Market Outlook Trends
7.1. Global Fishmeal Revenue (USD Million) and CAGR (%) by Type (2021-2032)
7.2. Global Fishmeal Revenue (USD Million) and CAGR (%) by Application (2021-2032)
7.3. Global Fishmeal Revenue (USD Million) and CAGR (%) by Product (2021-2032)
By Livestock
Ruminants
Poultry
Swine
Aquatic Animals
Others
By Source
Salmon and Trout
Marine Fish
Carps
Crustaceans
Tilapia
Others
By Application
Fertilizers
Animal Feed
Others
Chapter 8. Global Fishmeal Regional Analysis and Outlook
8.1. Global Fishmeal Revenue (USD Million) By Regions (2021- 2032)
8.2. North America Fishmeal Revenue (USD Million) by Country (2021-2032)
8.2.1. United States Fishmeal Regional Analysis and Outlook
8.2.2. Canada Fishmeal Regional Analysis and Outlook
8.2.3. Mexico Fishmeal Regional Analysis and Outlook
8.3. Europe Fishmeal Revenue (USD Million), by Country (2021-2032)
8.3.1. Germany Fishmeal Regional Analysis and Outlook
8.3.2. France Fishmeal Regional Analysis and Outlook
8.3.3. United Kingdom Fishmeal Regional Analysis and Outlook
8.3.4. Spain Fishmeal Regional Analysis and Outlook
8.3.5. Italy Fishmeal Regional Analysis and Outlook
8.3.6. Russia Fishmeal Regional Analysis and Outlook
8.3.7. Rest of Europe Fishmeal Regional Analysis and Outlook
8.4. Asia Pacific Fishmeal Revenue (USD Million) by Country (2021-2032)
8.4.1. China Fishmeal Regional Analysis and Outlook
8.4.2. Japan Fishmeal Regional Analysis and Outlook
8.4.3. India Fishmeal Regional Analysis and Outlook
8.4.4. South Korea Fishmeal Regional Analysis and Outlook
8.4.5. Australia Fishmeal Regional Analysis and Outlook
8.4.6. South East Asia Fishmeal Regional Analysis and Outlook
8.4.7. Rest of Asia Pacific Fishmeal Regional Analysis and Outlook
8.5. South America Fishmeal Revenue (USD Million), by Country (2021-2032)
8.5.1. Brazil Fishmeal Regional Analysis and Outlook
8.5.2. Argentina Fishmeal Regional Analysis and Outlook
8.5.3. Rest of South America Fishmeal Regional Analysis and Outlook
8.6. Middle East and Africa Fishmeal Revenue (USD Million) by Country (2021-2032)
8.6.1. Middle East Fishmeal Regional Analysis and Outlook
8.6.2. Africa Fishmeal Regional Analysis and Outlook
Chapter 9. North America Fishmeal Analysis and Outlook
9.1. North America Fishmeal Revenue (USD Million) by Segments (2021-2032)
9.1.1. North America Fishmeal Revenue (USD Million) by Type (2021-2032)
9.1.2. North America Fishmeal Revenue (USD Million) by Application (2021-2032)
9.1.3. North America Fishmeal Revenue (USD Million) by Product (2021-2032)
By Livestock
Ruminants
Poultry
Swine
Aquatic Animals
Others
By Source
Salmon and Trout
Marine Fish
Carps
Crustaceans
Tilapia
Others
By Application
Fertilizers
Animal Feed
Others
Chapter 10. Europe Fishmeal Analysis and Outlook
10.1. Europe Fishmeal Revenue (USD Million), by Segments (USD Million) (2021-2032)
10.1.1. Europe Fishmeal Revenue (USD Million) by Type (2021-2032)
10.1.2. Europe Fishmeal Revenue (USD Million) by Application (2021-2032)
10.1.3. Europe Fishmeal Revenue (USD Million) by Product (2021-2032)
By Livestock
Ruminants
Poultry
Swine
Aquatic Animals
Others
By Source
Salmon and Trout
Marine Fish
Carps
Crustaceans
Tilapia
Others
By Application
Fertilizers
Animal Feed
Others
Chapter 11. Asia Pacific Fishmeal Analysis and Outlook
11.1. Asia Pacific Fishmeal Revenue (USD Million), and Revenue (USD Million) by Segments (2021-2032)
11.1.1. Asia Pacific Fishmeal Revenue (USD Million) by Type (2021-2032)
11.1.2. Asia Pacific Fishmeal Revenue (USD Million) by Application (2021-2032)
11.1.3. Asia Pacific Fishmeal Revenue (USD Million) by Product (2021-2032)
By Livestock
Ruminants
Poultry
Swine
Aquatic Animals
Others
By Source
Salmon and Trout
Marine Fish
Carps
Crustaceans
Tilapia
Others
By Application
Fertilizers
Animal Feed
Others
Chapter 12. South America Fishmeal Analysis and Outlook
12.1. South America Fishmeal Revenue (USD Million), by Segments (2021-2032)
12.1.1. South America Fishmeal Revenue (USD Million) by Type (2021-2032)
12.1.2. South America Fishmeal Revenue (USD Million) by Application (2021-2032)
12.1.3. South America Fishmeal Revenue (USD Million) by Product (2021-2032)
By Livestock
Ruminants
Poultry
Swine
Aquatic Animals
Others
By Source
Salmon and Trout
Marine Fish
Carps
Crustaceans
Tilapia
Others
By Application
Fertilizers
Animal Feed
Others
Chapter 13. Middle East and Africa Fishmeal Analysis and Outlook
13.1. Middle East and Africa Fishmeal Revenue (USD Million), by Segments (2021-2032)
13.1.1. Middle East and Africa Fishmeal Revenue (USD Million) by Type (2021-2032)
13.1.2. Middle East and Africa Fishmeal Revenue (USD Million) by Application (2021-2032)
13.1.3. Middle East and Africa Fishmeal Revenue (USD Million) by Product (2021-2032)
By Livestock
Ruminants
Poultry
Swine
Aquatic Animals
Others
By Source
Salmon and Trout
Marine Fish
Carps
Crustaceans
Tilapia
Others
By Application
Fertilizers
Animal Feed
Others
Chapter 14. Fishmeal Company Profiles
14.1 Business Overview
14.2 Product Profiles
14.3 SWOT Profiles
14.5 Recent Developments
14.6 Financial Profile
List of Companies
Austral Group S.A.A.
Corpesca SA
Corporacion Exalmar SA
CorporaciOn Pesquera Inca SAC Av.
Diamond Aqua Fishes Meal
FF SKAGEN AS
Hayduk
Omega Protein Corp
Tasa
TripleNine
15. Methodology and Data Sources
15.1 Customization Offerings
15.2 Subscription Services
15.3 Related Reports
15.4 Publisher Expertise
LIST OF TABLES
Table 1 Market Segmentation Analysis
Table 2 Global Fishmeal Market Share of Leading Companies, 2023
Table 3 Product Offerings of Leading Companies
Table 4 Low Growth Scenario Forecasts
Table 5 Reference Case Growth Scenario
Table 6 High Growth Case Scenario
Table 7 Global Fishmeal Revenue (USD Million) And CAGR (%) By Type (2021-2032)
Table 8 Global Fishmeal Revenue (USD Million) And CAGR (%) By Application (2021-2032)
Table 9 Global Fishmeal Revenue (USD Million) And CAGR (%) By Product (2021-2032)
Table 10 Global Fishmeal Market Revenue (USD Million) By Regions (2021-2032)
Table 11 Global Fishmeal Market Share (%) By Regions (2021-2032)
Table 12 North America Fishmeal Revenue (USD Million) By Country (2021-2032)
Table 13 Europe Fishmeal Revenue (USD Million) By Country (2021-2032)
Table 14 Asia Pacific Fishmeal Revenue (USD Million) By Country (2021-2032)
Table 15 South America Fishmeal Revenue (USD Million) By Country (2021-2032)
Table 16 Middle East and Africa Fishmeal Revenue (USD Million) By Region (2021-2032)
Table 17 North America Fishmeal Revenue (USD Million) By Type (2021-2032)
Table 18 North America Fishmeal Revenue (USD Million) By Application (2021-2032)
Table 19 North America Fishmeal Revenue (USD Million) By Product (2021-2032)
Table 20 Europe Fishmeal Revenue (USD Million) By Type (2021-2032)
Table 21 Europe Fishmeal Revenue (USD Million) By Application (2021-2032)
Table 22 Europe Fishmeal Revenue (USD Million) By Product (2021-2032)
Table 23 Asia Pacific Fishmeal Revenue (USD Million) By Type (2021-2032)
Table 24 Asia Pacific Fishmeal Revenue (USD Million) By Application (2021-2032)
Table 25 Asia Pacific Fishmeal Revenue (USD Million) By Product (2021-2032)
Table 26 South America Fishmeal Revenue (USD Million) By Type (2021-2032)
Table 27 South America Fishmeal Revenue (USD Million) By Application (2021-2032)
Table 28 South America Fishmeal Revenue (USD Million) By Product (2021-2032)
Table 29 Middle East and Africa Fishmeal Revenue (USD Million) By Type (2021-2032)
Table 30 Middle East and Africa Fishmeal Revenue (USD Million) By Application (2021-2032)
Table 31 Middle East and Africa Fishmeal Revenue (USD Million) By Product (2021-2032)
LIST OF FIGURES
Figure 1. Market Scope
Figure 2. Pricing Forecasts Per Unit, 2023- 2032
Figure 3. Porter’s Five Forces
Figure 4. Global Fishmeal Market Revenue (USD Million) By Regions (2021-2032)
Figure 5. Global Fishmeal Market Share (%) By Regions (2023)
Figure 6. North America Fishmeal Revenue (USD Million) By Country (2021-2032)
Figure 7. United States Fishmeal Revenue (USD Million) By Country (2021-2032)
Figure 8. Canada Fishmeal Revenue (USD Million) By Country (2021-2032)
Figure 9. Mexico Fishmeal Revenue (USD Million) By Country (2021-2032)
Figure 10. Europe Fishmeal Revenue (USD Million) By Country (2021-2032)
Figure 11. Germany Fishmeal Revenue (USD Million) By Country (2021-2032)
Figure 12. France Fishmeal Revenue (USD Million) By Country (2021-2032)
Figure 13. United Kingdom Fishmeal Revenue (USD Million) By Country (2021-2032)
Figure 14. Spain Fishmeal Revenue (USD Million) By Country (2021-2032)
Figure 15. Italy Fishmeal Revenue (USD Million) By Country (2021-2032)
Figure 16. Russia Fishmeal Revenue (USD Million) By Country (2021-2032)
Figure 17. Rest of Europe Fishmeal Revenue (USD Million) By Country (2021-2032)
Figure 11. Asia Pacific Fishmeal Revenue (USD Million) By Country (2021-2032)
Figure 12. China Fishmeal Revenue (USD Million) By Country (2021-2032)
Figure 13. Japan Fishmeal Revenue (USD Million) By Country (2021-2032)
Figure 14. India Fishmeal Revenue (USD Million) By Country (2021-2032)
Figure 15. South Korea Fishmeal Revenue (USD Million) By Country (2021-2032)
Figure 16. Australia Fishmeal Revenue (USD Million) By Country (2021-2032)
Figure 17. South East Asia Fishmeal Revenue (USD Million) By Country (2021-2032)
Figure 18. South America Fishmeal Revenue (USD Million) By Country (2021-2032)
Figure 19. Brazil Fishmeal Revenue (USD Million) By Country (2021-2032)
Figure 20. Argentina Fishmeal Revenue (USD Million) By Country (2021-2032)
Figure 21. Rest of Asia Pacific Fishmeal Revenue (USD Million) By Country (2021-2032)
Figure 22. Middle East and Africa Fishmeal Revenue (USD Million) By Region (2021-2032)
Figure 23. Saudi Arabia Fishmeal Revenue (USD Million) By Region (2021-2032)
Figure 24. The UAE Fishmeal Revenue (USD Million) By Region (2021-2032)
Figure 25. Rest of Middle East Fishmeal Revenue (USD Million) By Region (2021-2032)
Figure 26. South Africa Fishmeal Revenue (USD Million) By Region (2021-2032)
Figure 27. Africa Fishmeal Revenue (USD Million) By Region (2021-2032)
Figure 28. North America Fishmeal Revenue (USD Million) By Type (2021-2032)
Figure 29. North America Fishmeal Revenue (USD Million) By Application (2021-2032)
Figure 30. North America Fishmeal Revenue (USD Million) By Product (2021-2032)
Figure 31. Europe Fishmeal Revenue (USD Million) By Type (2021-2032)
Figure 32. Europe Fishmeal Revenue (USD Million) By Application (2021-2032)
Figure 33. Europe Fishmeal Revenue (USD Million) By Product (2021-2032)
Figure 34. Asia Pacific Fishmeal Revenue (USD Million) By Type (2021-2032)
Figure 35. Asia Pacific Fishmeal Revenue (USD Million) By Application (2021-2032)
Figure 36. Asia Pacific Fishmeal Revenue (USD Million) By Product (2021-2032)
Figure 37. South America Fishmeal Revenue (USD Million) By Type (2021-2032)
Figure 38. South America Fishmeal Revenue (USD Million) By Application (2021-2032)
Figure 39. South America Fishmeal Revenue (USD Million) By Product (2021-2032)
Figure 40. Middle East and Africa Fishmeal Revenue (USD Million) By Type (2021-2032)
Figure 41. Middle East and Africa Fishmeal Revenue (USD Million) By Application (2021-2032)
Figure 42. Middle East and Africa Fishmeal Revenue (USD Million) By Product (2021-2032)
By Livestock
Ruminants
Poultry
Swine
Aquatic Animals
Others
By Source
Salmon and Trout
Marine Fish
Carps
Crustaceans
Tilapia
Others
By Application
Fertilizers
Animal Feed
Others
Countries Analyzed
North America (US, Canada, Mexico)
Europe (Germany, UK, France, Spain, Italy, Russia, Rest of Europe)
Asia Pacific (China, India, Japan, South Korea, Australia, South East Asia, Rest of Asia)
South America (Brazil, Argentina, Rest of South America)
Middle East and Africa (Saudi Arabia, UAE, Rest of Middle East, South Africa, Egypt, Rest of Africa)
